Team:Evry/Interlab
Interlab results
Our team decided to participate to the 2016 Interlab Study.
The goal of the 2016 interlab study was to obtain GFP fluorescence data from iGEM teams all around the world for three devices. This was aimed to permit to observe the result repeatability across technics, strains and teams.
Constructions:
- Test Device 1: J23101.B0034.E0040.B0015 in pSB1C3
- Test Device 2: J23106.B0034.E0040.B0015 in pSB1C3
- Test Device 3: J23117.B0034.E0040.B0015 in pSB1C3
- Positive Control Device: I20270 in pSB1C3
- Negative Control Device: R0040 in pSB1C3
Results
After transformation in TOP10 E. coli strain with the devices furnished by the H.Q., we obtained clones for all the devices. We checked the fluorescence of our isolated clones (Figure 1).
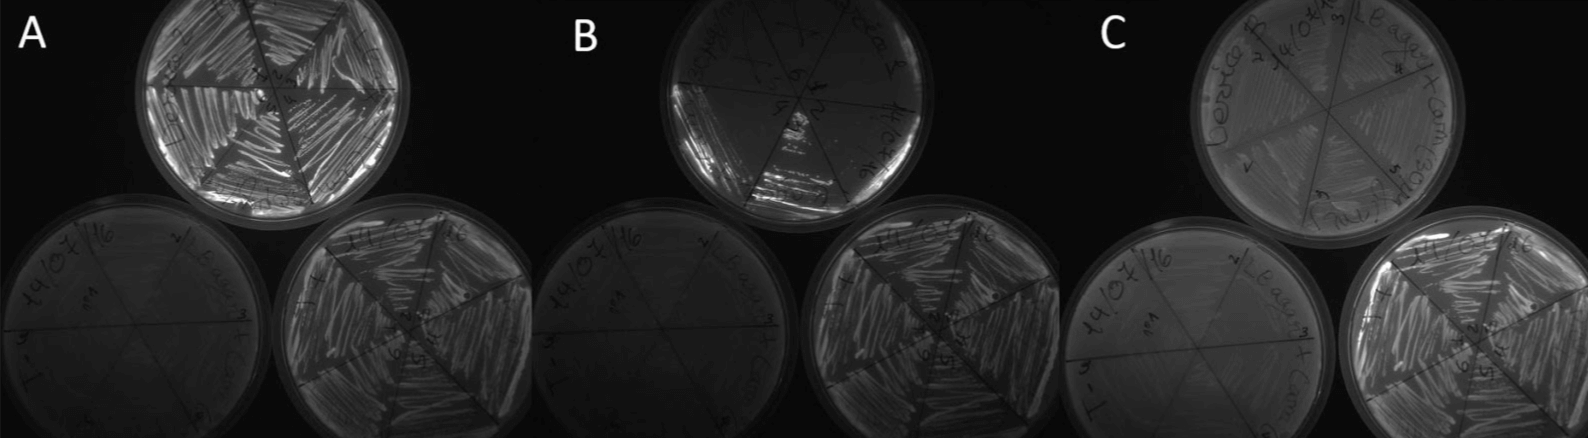
Figure 1. Transformation of all samples from IGEM HQ. (a) Device 2 on the top, Negative control on the left, Positive control on the right; (b)Device 1 on the top, Negative control on the left, Positive control on the right; (c ) Device 3 on the top, Negative control on the left, Positive control on the right. .
Before the measurement of our samples, we had to calibrate and define the standard curve. So, for that, we did:
OD600nm Reference point
The ludox solution was used to calculate a correction factor between the measured value and the reference value.
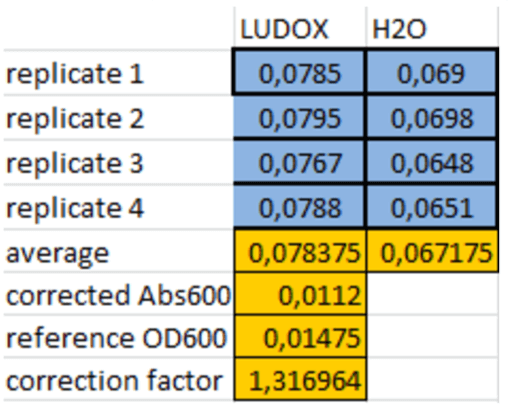
Table 1. Correction Factor Calculation
We did measurements of ludox solution and found a correction factor of 1,316964 which caracterized the difference beetwen the OD600nm measured and the standard OD600nm.
It would allow us to convert our absorbance measurements into standard OD values.
FITC fluorescence standart curve
We created a standard curve with several dilutions of FITC solutions and obtained:

Table 2. Data of FITC standard curve

Figure 2.FITC standard curve
This standard gave us the proportionality between the fluorescence value and a number of FITC molecules.
We tried differents parameters like orbitals and gain, to find the most linear standard curve.
The FITC concentration would be translated into GFP concentration.
We would access throught OD600nm to an approximize cell number and throught the fluorescence value to an approximive fluorescente molecule number. We would standardize the fluorescence value dividing it by the OD600nm and compare fluorescence by cell.
Normalisation
After an overnight culture, we measured the OD600nm and calculated the volumes needed to prepare for each device an 0.2 OD600nm culture.
Cell measurement results
Following the protocol from IGEM HQ, we decided to do our measurement in 0.5X Terrific Broth (TB) medium (at half strength).
Our team achieved the cell measurement of all samples and the obtained result is below.

Figure 3.Cell fluorescence measurements over time.
All the samples were grown in 0.5X TB medium with a working concentration of chloramphenicol at 30ug/mL.
The controls (positive and negative) and the three devices shown various fluorescence intensity at OD600nm as shown on the bar chart above. As expected, the negative control don’t have any fluorescence and the positive control have a fluorescence intensity between 8,000 and 20,000 AU. The devices 1, 2 and 3 have the expected profile according to the construction of each device (device 1: strong constitutive promoter, device 2: medium constitutive promoter and device 3: week constitutive promoter). The highest value is between 35,000 and 40,000 AU.
Meanwhile, we found that the addition of sorbitol and betaine in the TB medium improve the protein expression according to the article of R. Horgan et al.[1] Therefore, we decided to do the same protocol but we add betaine and sorbitol before the culture. The result is presented just beneath.

Figure 4.Cell fluorescence measurements on TB media+betain/sorbitol.
As expected, the negative control didn't have any fluorescence but this time the positive control had a fluorescence intensity between 10,000 and 30,000 AU. The devices 1, 2 and 3 had the expected profile according to the construction of each device. The highest value is around 120,000 AU. In comparison to the figure 3, the fluorescence intensity is twice more when we did the culture with betaine and the sorbitol.
Feel free to contact us!