| Line 51: | Line 51: | ||
<h2><b>Detailed results</b></h2> | <h2><b>Detailed results</b></h2> | ||
| − | <p style="font-size:18px">Finally, we used PET as the substrate. Excessive PET film was been put into 20 times diluted Enzyme solution (unpurified CFPS system after expression).<br> | + | <p style="font-size:18px"><li>Finally, we used PET as the substrate. Excessive PET film was been put into 20 times diluted Enzyme solution (unpurified CFPS system after expression).<br> |
| − | After static reaction at 39℃ for 5 days, we detected the characteristic adsorption peak of the product ,MHET, which has no other characteristic adsorption peak except in 260nm. | + | After static reaction at 39℃ for 5 days, we detected the characteristic adsorption peak of the product ,MHET, which has no other characteristic adsorption peak except in 260nm.</li> |
</i> .</p> | </i> .</p> | ||
| Line 72: | Line 72: | ||
</div> | </div> | ||
| − | + | <br/><br/><br/> | |
| − | <p style="font-size:18px">We screened the samples with no other characteristic adsorption peak except in 260nm. </i> .</p> | + | <p style="font-size:18px"><li>We screened the samples with no other characteristic adsorption peak except in 260nm.</li> </i> .</p> |
<div class="row"> | <div class="row"> | ||
<div class="col-md-2"></div> | <div class="col-md-2"></div> | ||
| Line 82: | Line 82: | ||
<p style="font-size:15px"> | <p style="font-size:15px"> | ||
<br/> | <br/> | ||
| − | + | Fig.2.Spectral scan for the degradation product MHET(Samples with no other absorption peak except in 260nm) | |
</p> | </p> | ||
<div class="col-md-2"></div> | <div class="col-md-2"></div> | ||
| Line 91: | Line 91: | ||
</div> | </div> | ||
| − | <p style="font-size:18px">We had been detected the fluorescence signals at 479 nm (emission wavelength) in wells of 96 well plate at the end of the expressions in the CFPS system. | + | <br/><br/><br/> |
| + | |||
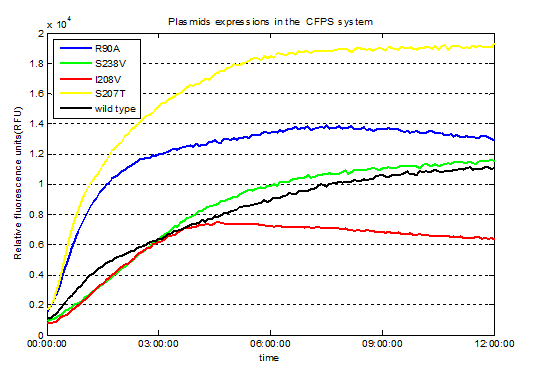
| + | <p style="font-size:18px"><li>We had been detected the fluorescence signals at 479 nm (emission wavelength) in wells of 96 well plate at the end of the expressions in the CFPS system. </li> </i> .</p> | ||
<div class="row"> | <div class="row"> | ||
<div class="col-md-2"></div> | <div class="col-md-2"></div> | ||
| Line 109: | Line 111: | ||
</div> | </div> | ||
| − | <p style="font-size:18px">According to the OD values and the RFU values of each mutation seperatelly, we got the relative activities of modified enzymes.</i> .</p> | + | <br/><br/><br/> |
| + | <p style="font-size:18px"><li>According to the OD values and the RFU values of each mutation seperatelly, we got the relative activities of modified enzymes.</li></i> .</p> | ||
<div class="row"> | <div class="row"> | ||
<div class="col-md-2"></div> | <div class="col-md-2"></div> | ||
| Line 118: | Line 121: | ||
<p style="font-size:15px"> | <p style="font-size:15px"> | ||
<br/> | <br/> | ||
| − | Fig.4. Relative activities of enzymes | + | Fig.4. Relative activities of enzymes |
</p> | </p> | ||
<div class="col-md-2"></div> | <div class="col-md-2"></div> | ||
Revision as of 10:28, 7 October 2016
Results of CFPS
Overview
We utilized the cell-free system to express the enzymes which had been modified in 22 different sites. Then we used the proteins successfully expressed to degrade PET. Our expected goal was to screen mutations with higher enzyme activities than the wild type PETase. .
Detailed results
After static reaction at 39℃ for 5 days, we detected the characteristic adsorption peak of the product ,MHET, which has no other characteristic adsorption peak except in 260nm.

Fig.1. Spectral scan for the degradation product MHET

Fig.2.Spectral scan for the degradation product MHET(Samples with no other absorption peak except in 260nm)

Fig.3. Screened plasmids expressions in the CFPS system

Fig.4. Relative activities of enzymes
Summary
We successfully screened two mutants (R90A &I208V) with higher enzyme activity by site-directed mutation.


