Difference between revisions of "Team:XMU-China/Proof"
| Line 233: | Line 233: | ||
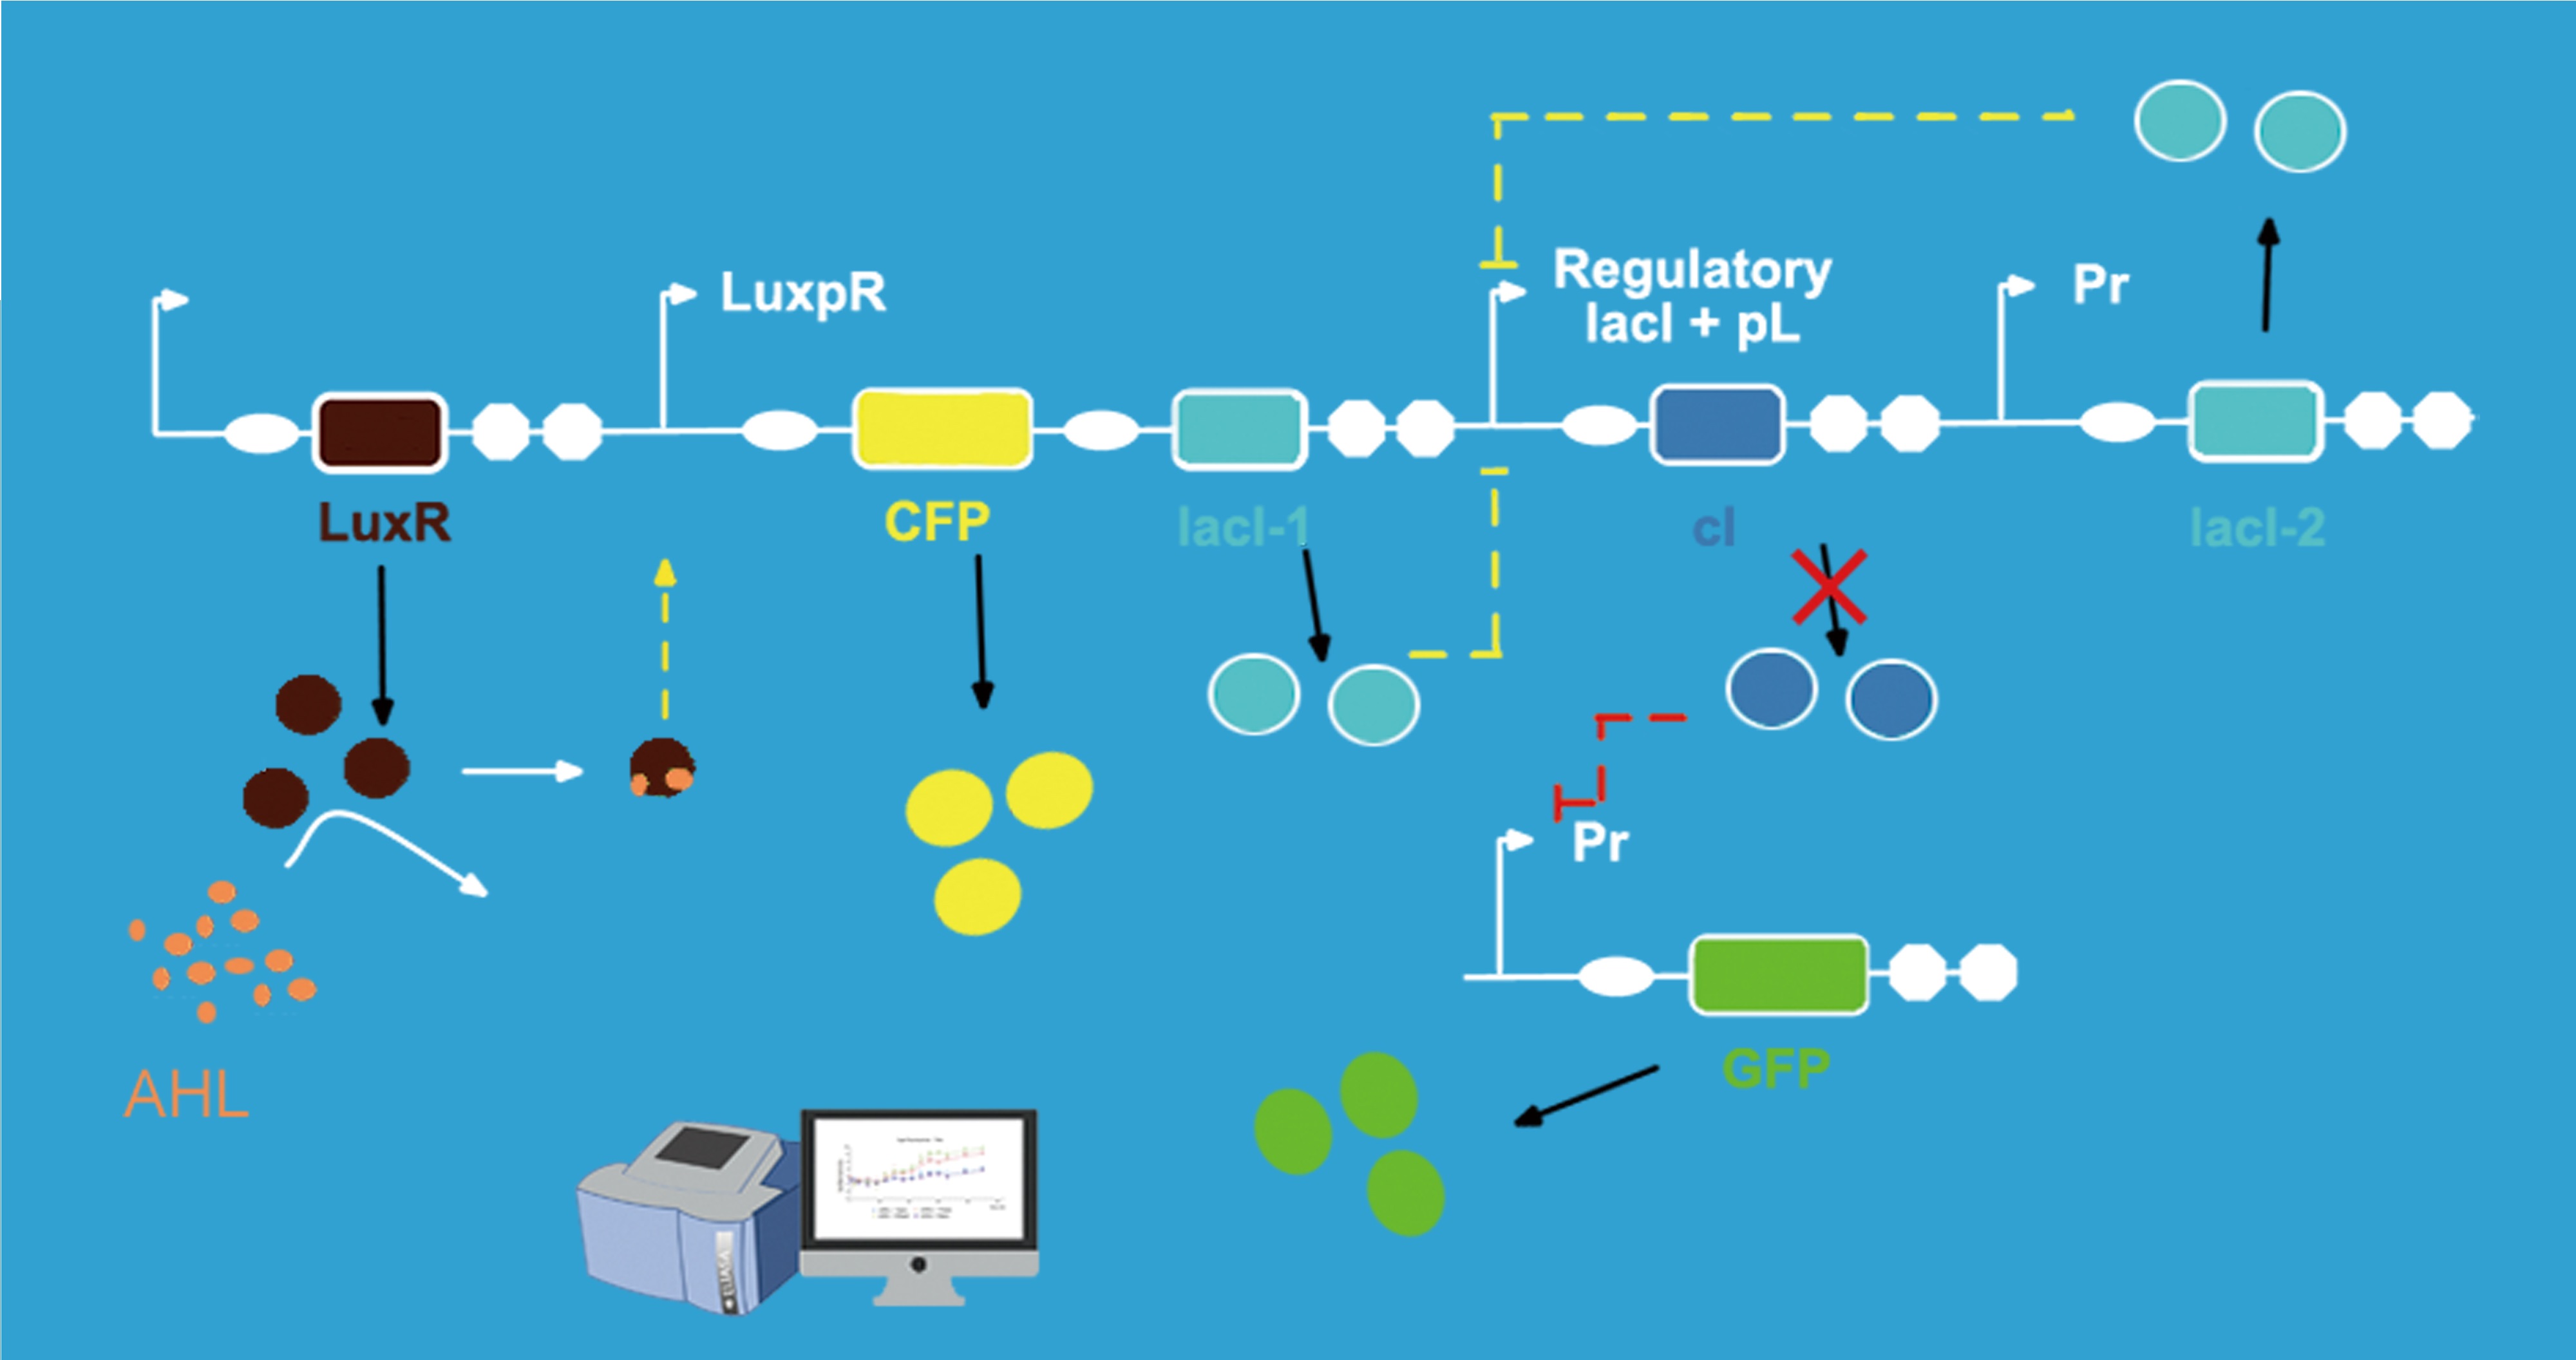
<h3>1. AHL Gradient Induction</h3> | <h3>1. AHL Gradient Induction</h3> | ||
<p>As we can see, Quorum sensing system could be induced by AHL. As for our gene circuits, when AHL raised to its threshold value and was detected by the sensor part, the promoter Lux PR can be activated, CFP and GFP are expressed. In order to find out the relationship, we decided to make an AHL gradient induction for our gene circuits. </p> | <p>As we can see, Quorum sensing system could be induced by AHL. As for our gene circuits, when AHL raised to its threshold value and was detected by the sensor part, the promoter Lux PR can be activated, CFP and GFP are expressed. In order to find out the relationship, we decided to make an AHL gradient induction for our gene circuits. </p> | ||
| − | <p>During our experiment, we first construct our gene circuit successfully, then we transformed the plasmids into chemical competent cell (DH5α). And then our engineering bacteria were divided into four groups: experimental group 1, 10 and 20 (c(AHL) = 1 ng/μL 10 ng/μL, and 20 ng/μL) and blank control group. Then we measured OD600 of the <i>E.coli</i> and the fluorescence intensity of CFP and GFP for 900 minutes. The OD600 showed the growth trend of the engineering bacteria. And the fluorescence intensity of each experimental group and control group showed the relationship between AHL and the expression of our circuits. </p> | + | <p>During our experiment, we first construct our gene circuit successfully, then we transformed the plasmids into chemical competent cell (DH5α). And then our engineering bacteria were divided into four groups: experimental group 1, 10 and 20 (c(AHL) = 1 ng/μL, 10 ng/μL, and 20 ng/μL) and blank control group. Then we measured OD600 of the <i>E.coli</i> and the fluorescence intensity of CFP and GFP for 900 minutes. The OD600 showed the growth trend of the engineering bacteria. And the fluorescence intensity of each experimental group and control group showed the relationship between AHL and the expression of our circuits. </p> |
<figure><center><img src="https://static.igem.org/mediawiki/2016/7/7e/T--XMU-China--result_fig1_1_.png" width="80%;" align="center"; style="margin-bottom:20px;"/></center> | <figure><center><img src="https://static.igem.org/mediawiki/2016/7/7e/T--XMU-China--result_fig1_1_.png" width="80%;" align="center"; style="margin-bottom:20px;"/></center> | ||
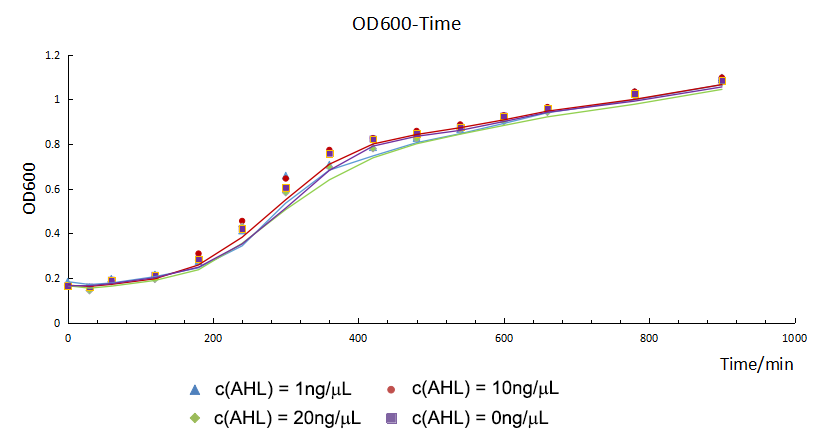
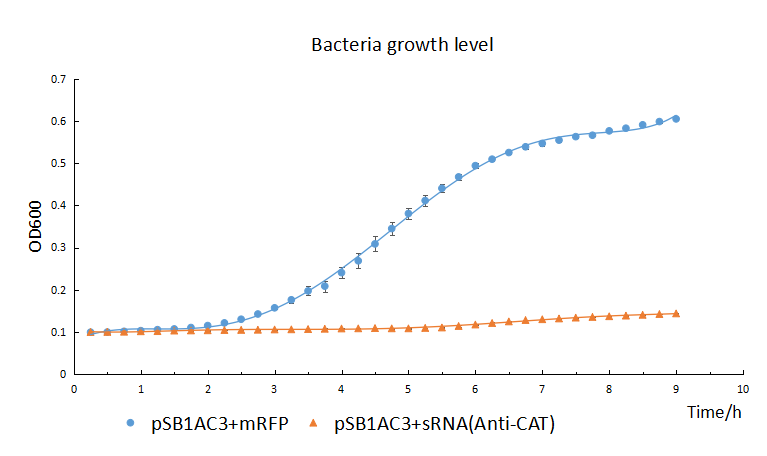
<figcaption><center><strong>Figure 1.1</strong> The OD600 of versus time of experimental group 1, 10, 20 and control</center></figcaption></figure><br/> | <figcaption><center><strong>Figure 1.1</strong> The OD600 of versus time of experimental group 1, 10, 20 and control</center></figcaption></figure><br/> | ||
| − | + | <p>From figure 1, we found that the growth curves of each group don't show much difference. It suggested that they had the same growth trend, so the difference of fluorescence intensity was mainly from the expression of circuits or other factors.</p> | |
| − | <p>From figure 1, we found that the growth curves don't show much difference. It suggested that they had the same growth trend, so the difference of fluorescence intensity was mainly from the expression of circuits or other factors.</p> | + | |
<figure><center><img src="https://static.igem.org/mediawiki/2016/f/fa/T--XMU-China--result_fig1_2_.png" width="80%;" align="center"; style="margin-bottom:20px;"/></center> | <figure><center><img src="https://static.igem.org/mediawiki/2016/f/fa/T--XMU-China--result_fig1_2_.png" width="80%;" align="center"; style="margin-bottom:20px;"/></center> | ||
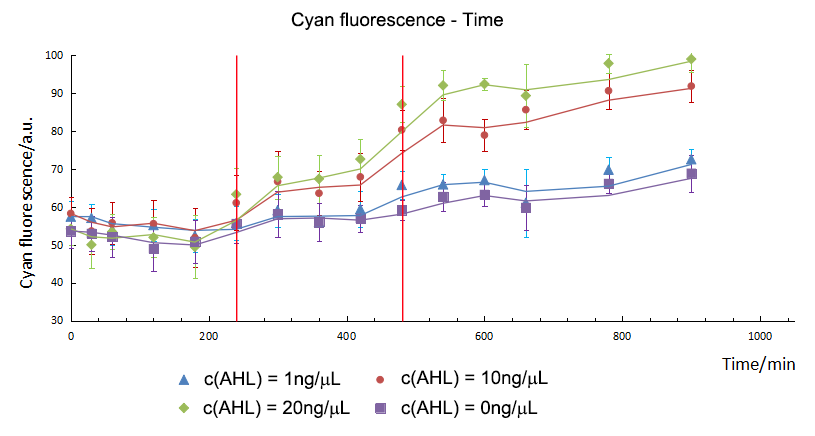
| − | <figcaption><center><strong>Figure 1.2</strong>The average cyan fluorescence intensity versus time | + | <figcaption><center><strong>Figure 1.2</strong>The average cyan fluorescence intensity versus time of experimental group 1, 10, 20 and control.</center> </figcaption> |
</figure><br/> | </figure><br/> | ||
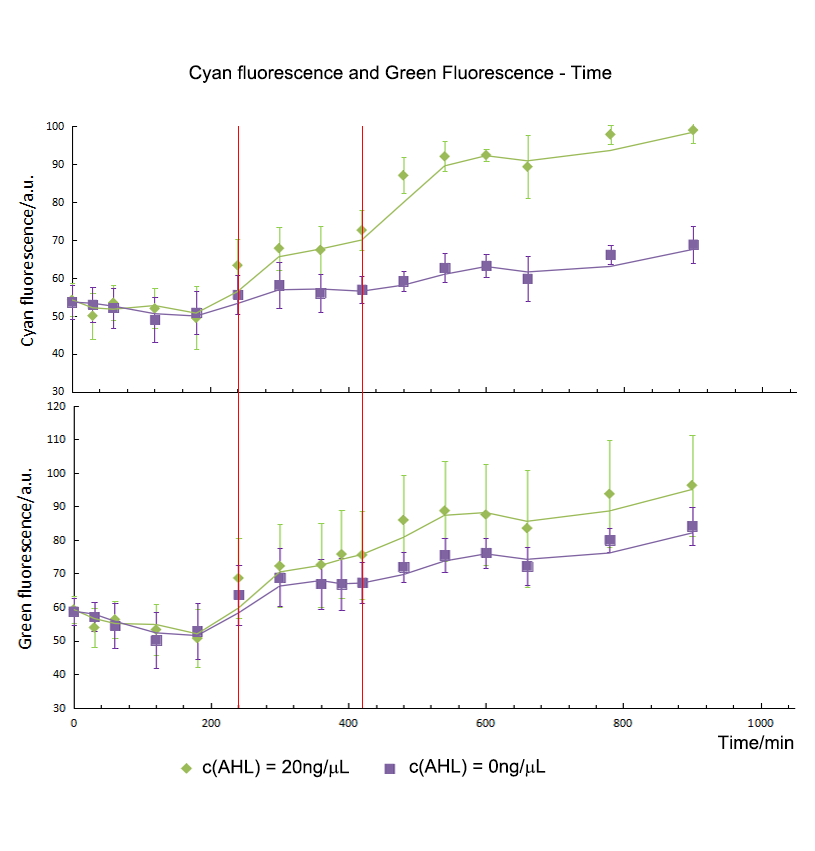
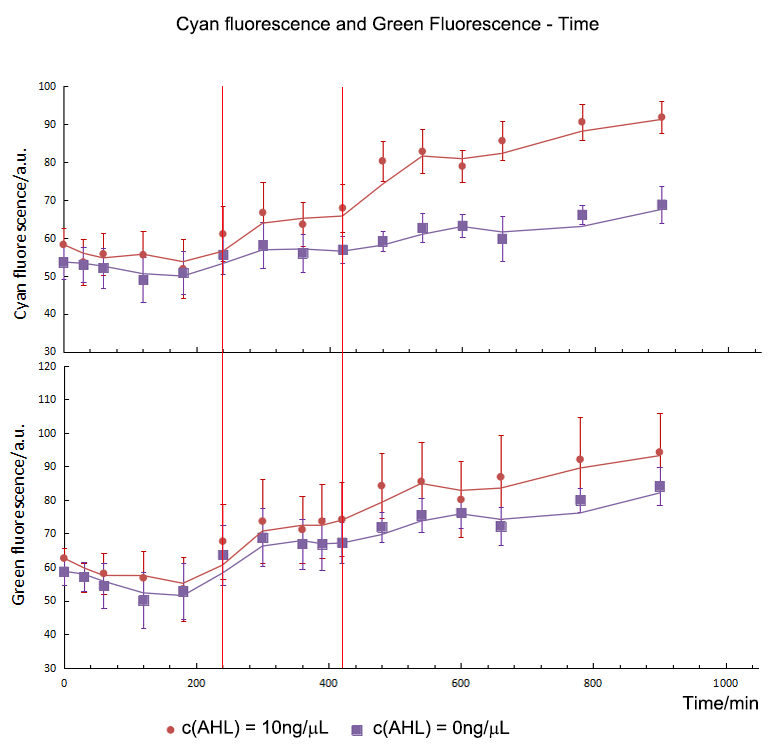
| − | <p>So we did experiments at the same condition except the concentration of AHL. | + | <p>So we did experiments at the same condition except the concentration of AHL. As showed in figure 2, with the increase of the AHL, the expression of the CFP shows an upper trend. In addition, by means of independent t-test, we compared the fluorescence intensity between the group 1, 10, 20 and control. We found the initial expression time of CFP was different. For group 10 and 20, CFP expressed initially and could be detected in the 240th minute. However, for group 1, CFP started to express in the 480th minute.</p> |
<center><img src="https://static.igem.org/mediawiki/2016/8/8b/T--XMU-China--result_fig1_3_.png" width="80%;" align="center"; style="margin-bottom:20px;"/></center> | <center><img src="https://static.igem.org/mediawiki/2016/8/8b/T--XMU-China--result_fig1_3_.png" width="80%;" align="center"; style="margin-bottom:20px;"/></center> | ||
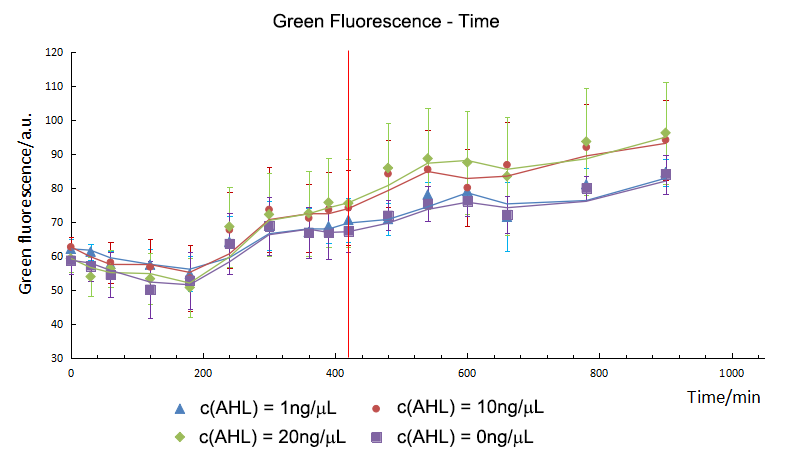
| − | <p><center><strong> Figure 1.3 </strong>The average green fluorescence intensity versus time of | + | <p><center><strong> Figure 1.3 </strong>The average green fluorescence intensity versus time of experimental group 1, 10, 20 and control. </center></p><br/> |
| − | <p>T-test showed that AHL didn't influence the expression of GFP. | + | <p>T-test showed that AHL didn't influence the expression of GFP. Group 10 and 20 expressed initially in the 420th minute and green fluorescence intensity had no significant difference in expression level. However, as for group 1, green fluorescence intensity didn’t show much difference comparing with control group, Which meant that 1 ng/μL of AHL was too low to activated the sensor. So the sensor part is an specific and smart device. </p> |
| − | + | ||
<h3>2. The Delayed Effect</h3> | <h3>2. The Delayed Effect</h3> | ||
<center><img src="https://static.igem.org/mediawiki/2016/5/53/T--XMU-China--result_fig1_4_1.png" width="80%;" align="center"; style="margin-bottom:20px;"/></center> | <center><img src="https://static.igem.org/mediawiki/2016/5/53/T--XMU-China--result_fig1_4_1.png" width="80%;" align="center"; style="margin-bottom:20px;"/></center> | ||
Revision as of 22:16, 19 October 2016
Proof Of Concept
Verities never lie.


CONTACT US
 https://www.facebook.com/IGEM-XMU-China-1067638406629389
 https://www.twitter.com/Amoy_igem
 igemxmu@gmail.com
Name: XMU-China School: Xiamen University
Address: Xiamen University, No. 422, Siming South Road, Xiamen, Fujian, P. R. China 361005
CONTACT US
https://www.facebook.com/IGEM-XMU-China-1067638406629389
https://www.twitter.com/Amoy_igem
igemxmu@gmail.com
Name: XMU-China School: Xiamen University
Address: Xiamen University, No. 422, Siming South Road, Xiamen, Fujian, P. R. China 361005