| Line 18: | Line 18: | ||
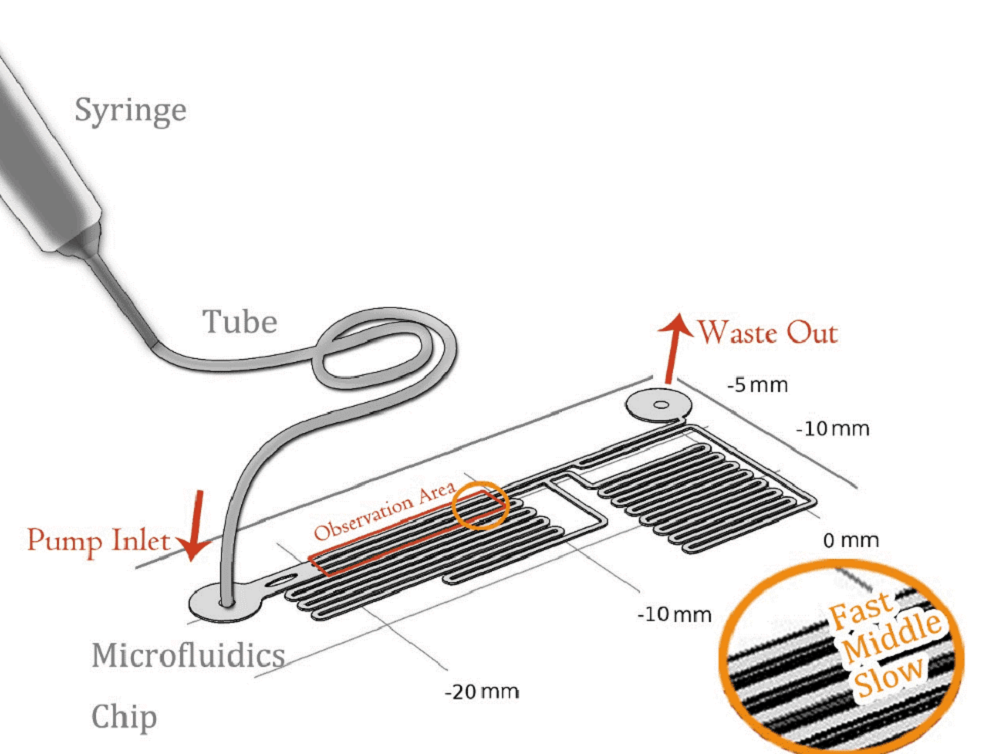
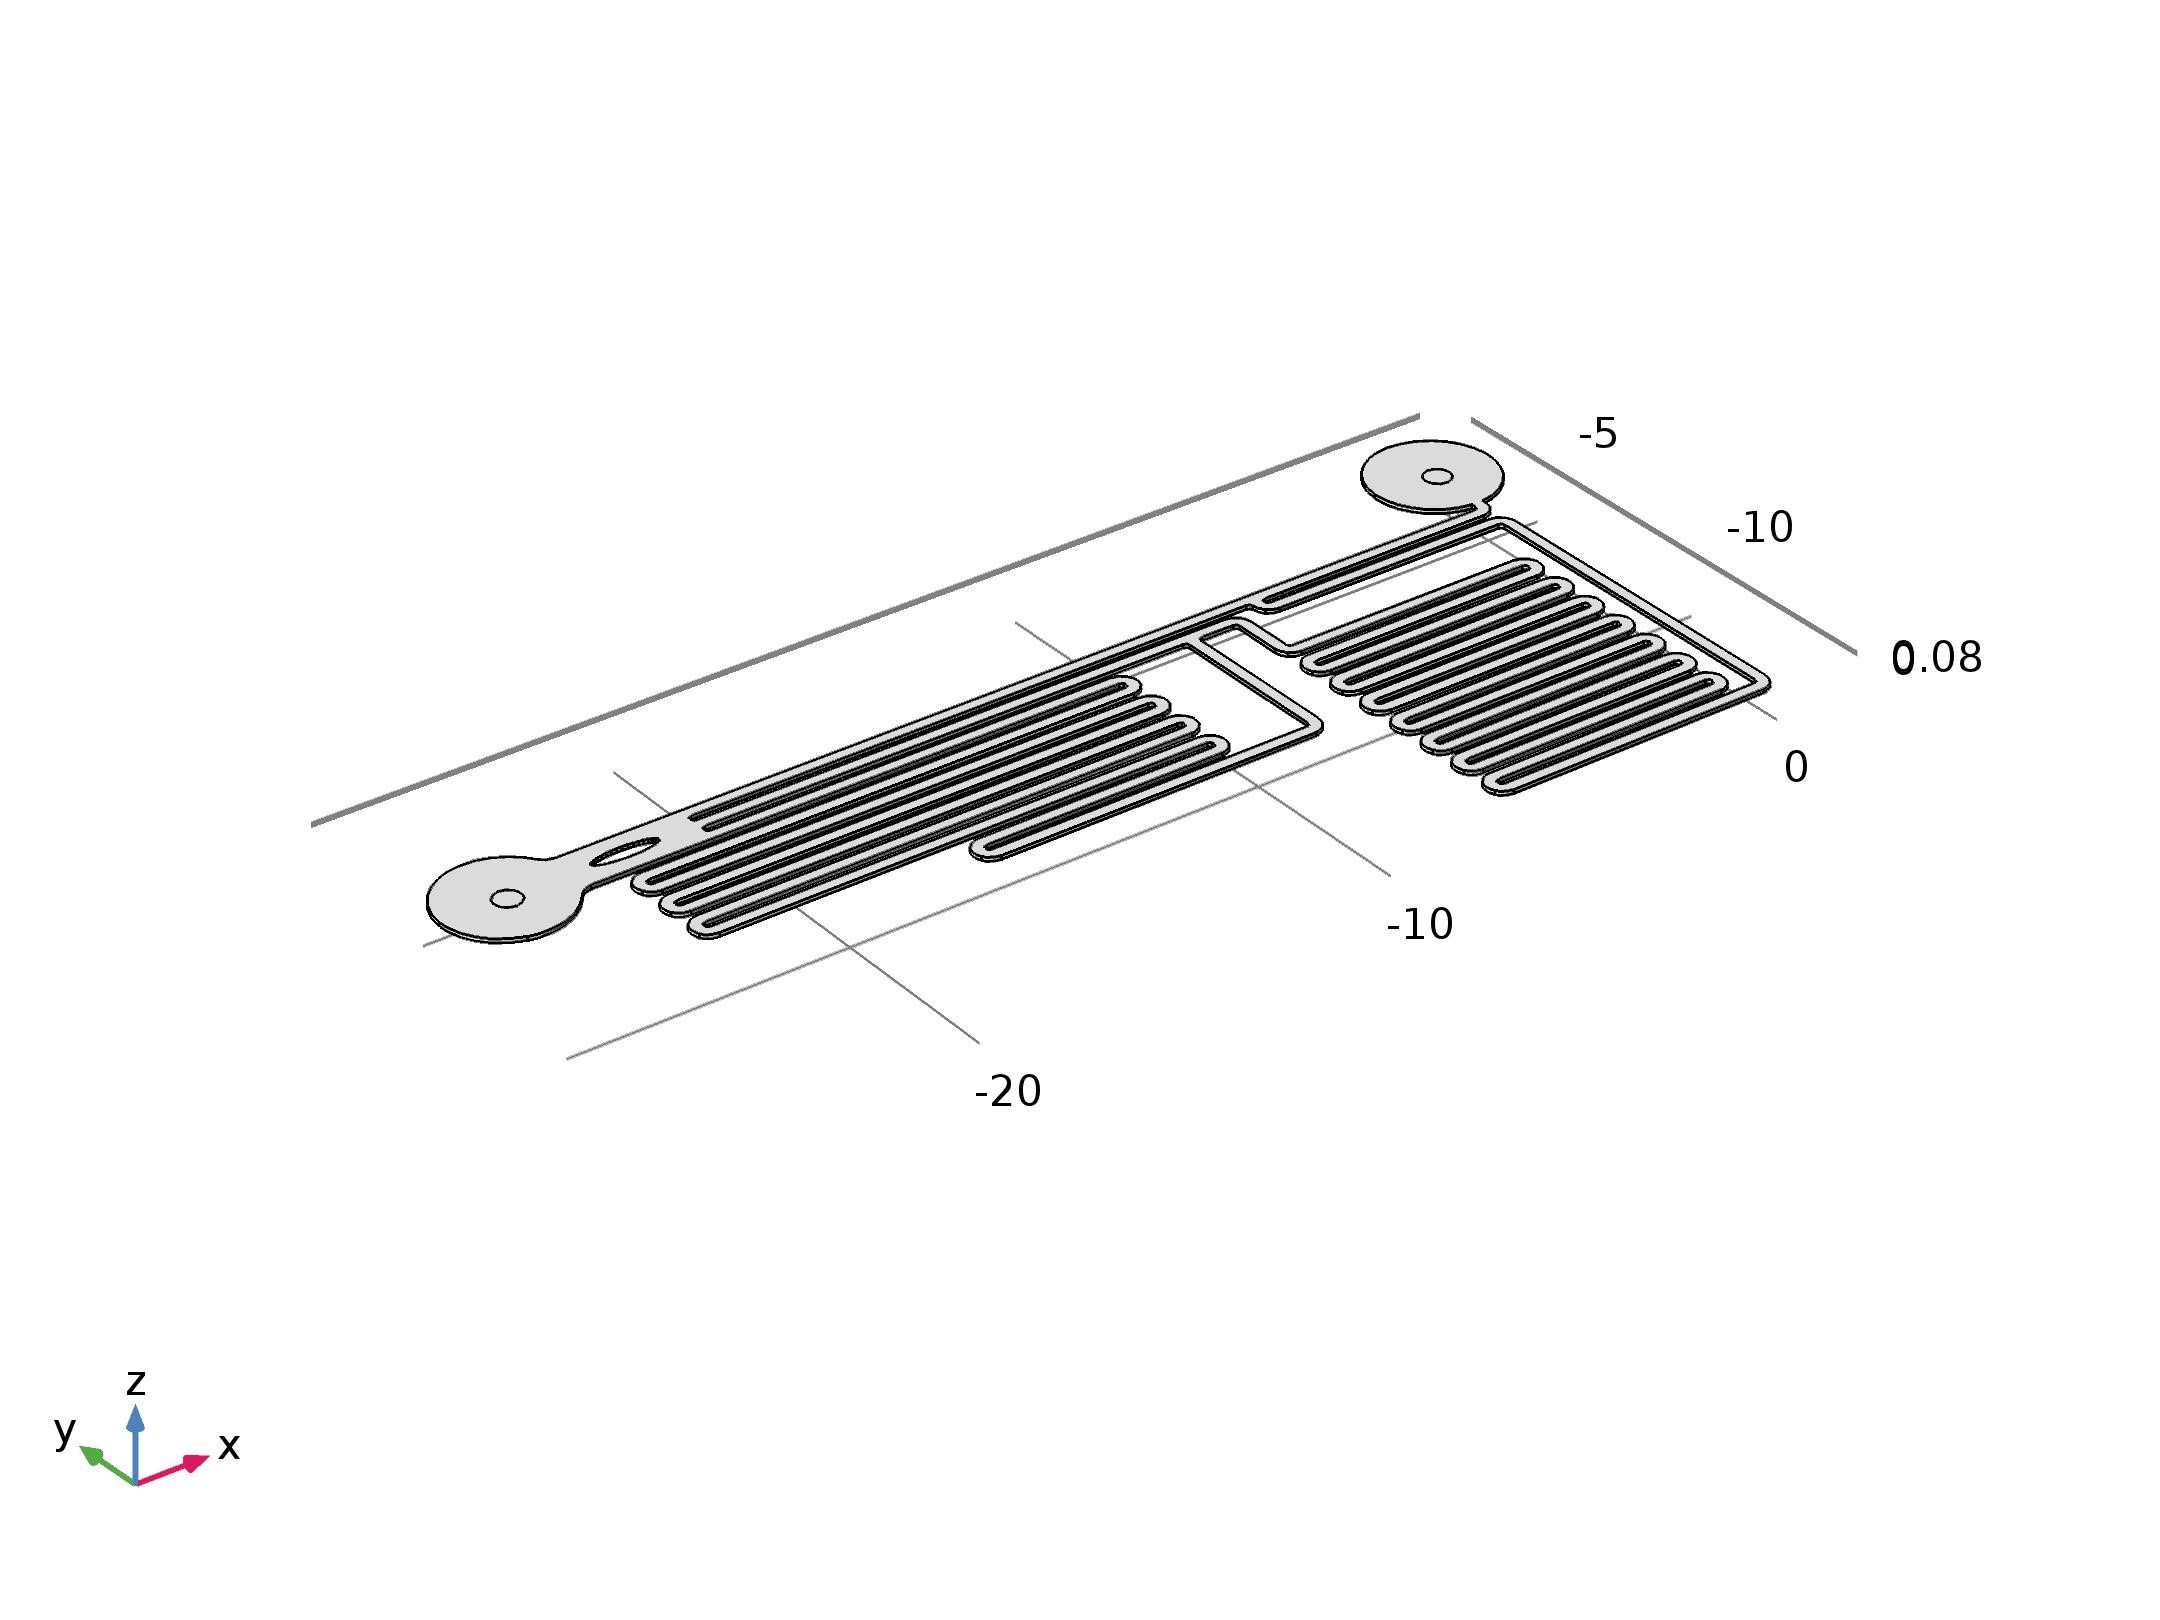
To quantitatively measure the response of MS channel on the cell membrane, we designed our experiment manipulated on microfluidic chip. CHO-K1 cells were cultured adherent on the bottom of PDMS tunnel. Stable and flexible force field could be formed surrounding cell, which directly controlled by the pumped-inflow rate. Each time when we applied a constant pumped inflow, cells in 3 different observation tunnel could receive corresponding small, middle, large, 3 level of force magnitude(1: 9: 81). By changing the pumped flow rate, we could measure MS channel response under a series of forces with different magnitude order. | To quantitatively measure the response of MS channel on the cell membrane, we designed our experiment manipulated on microfluidic chip. CHO-K1 cells were cultured adherent on the bottom of PDMS tunnel. Stable and flexible force field could be formed surrounding cell, which directly controlled by the pumped-inflow rate. Each time when we applied a constant pumped inflow, cells in 3 different observation tunnel could receive corresponding small, middle, large, 3 level of force magnitude(1: 9: 81). By changing the pumped flow rate, we could measure MS channel response under a series of forces with different magnitude order. | ||
| − | {{SUSTech_Image_Center_8 | filename=T--SUSTech_Shenzhen--rendered-device.png|width=800px|caption=}} | + | {{SUSTech_Image_Center_8 | filename=T--SUSTech_Shenzhen--rendered-device.png|width=800px|caption=<B>Fig. 1 Microfluidic Channels</B>}} |
== Mathematical Demonstration == | == Mathematical Demonstration == | ||
| Line 37: | Line 37: | ||
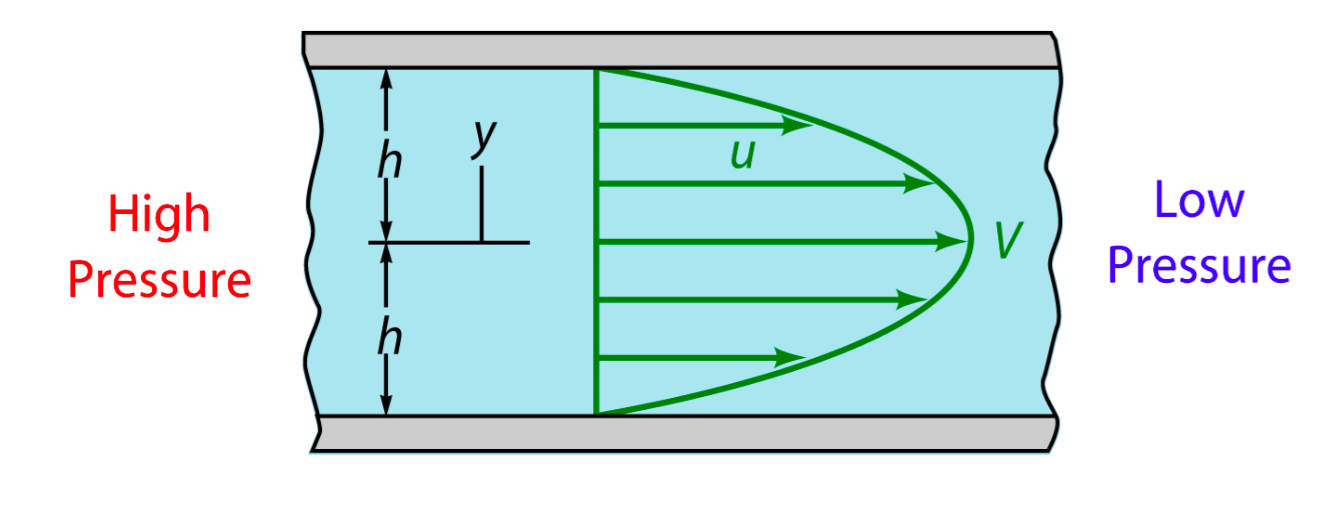
{{SUSTech_Shenzhen/bmath|equ=<nowiki>\bar V=\frac{Q}{A}=\frac{\int_A udA}{A}=\frac{1}{2}V</nowiki>}} | {{SUSTech_Shenzhen/bmath|equ=<nowiki>\bar V=\frac{Q}{A}=\frac{\int_A udA}{A}=\frac{1}{2}V</nowiki>}} | ||
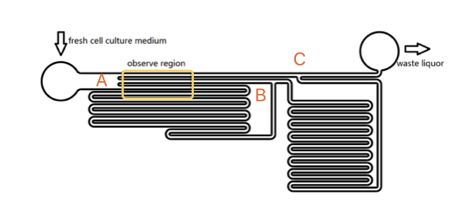
| − | {{SUSTech_Image | filename=T--SUSTech_Shenzhen--annotated-device.png|width=800px|caption=}} | + | {{SUSTech_Image | filename=T--SUSTech_Shenzhen--annotated-device.png|width=800px|caption=<B>Fig. 2 Speed Distribution Inside Channels</B>}} |
Based on the integral form of the continuity equation for an incompressible fluid, during a given time, the sum of flow volume in each branch is equal to the total volume pumped in the whole chamber. According to the Kirchhoff's law, the accumulation of flow speed at the joint point must be zero. It is easy to get the equation that{{SUSTech_Shenzhen/bmath|equ=<nowiki>\begin{matrix} L_{AC}V_1=L_{AB}V_2+R_{AB} V_3 \\ | Based on the integral form of the continuity equation for an incompressible fluid, during a given time, the sum of flow volume in each branch is equal to the total volume pumped in the whole chamber. According to the Kirchhoff's law, the accumulation of flow speed at the joint point must be zero. It is easy to get the equation that{{SUSTech_Shenzhen/bmath|equ=<nowiki>\begin{matrix} L_{AC}V_1=L_{AB}V_2+R_{AB} V_3 \\ | ||
| Line 53: | Line 53: | ||
Rainbow beads (SPHEROTM Rainbow Calibration Particles, diameter: 6um) were dissolved in the cell culture medium, which contained the dead cells. A series of pumped flow rate(5ul/min, 15ul/min, and 45ul/min) were applied to generate a steady fluid flow. The exposure time was set to 100ms. | Rainbow beads (SPHEROTM Rainbow Calibration Particles, diameter: 6um) were dissolved in the cell culture medium, which contained the dead cells. A series of pumped flow rate(5ul/min, 15ul/min, and 45ul/min) were applied to generate a steady fluid flow. The exposure time was set to 100ms. | ||
| − | {{SUSTech_Image | filename=T--SUSTech_Shenzhen--DB56D45F-D056-4A82-897A-2CE77C2C4A12.png | caption=Fig. | + | {{SUSTech_Image | filename=T--SUSTech_Shenzhen--DB56D45F-D056-4A82-897A-2CE77C2C4A12.png | caption=<B>Fig. Bead Trace in The Fastest Microfluidics Channel with The Flow Rate of 5ul/min</B> | width=1000px}} |
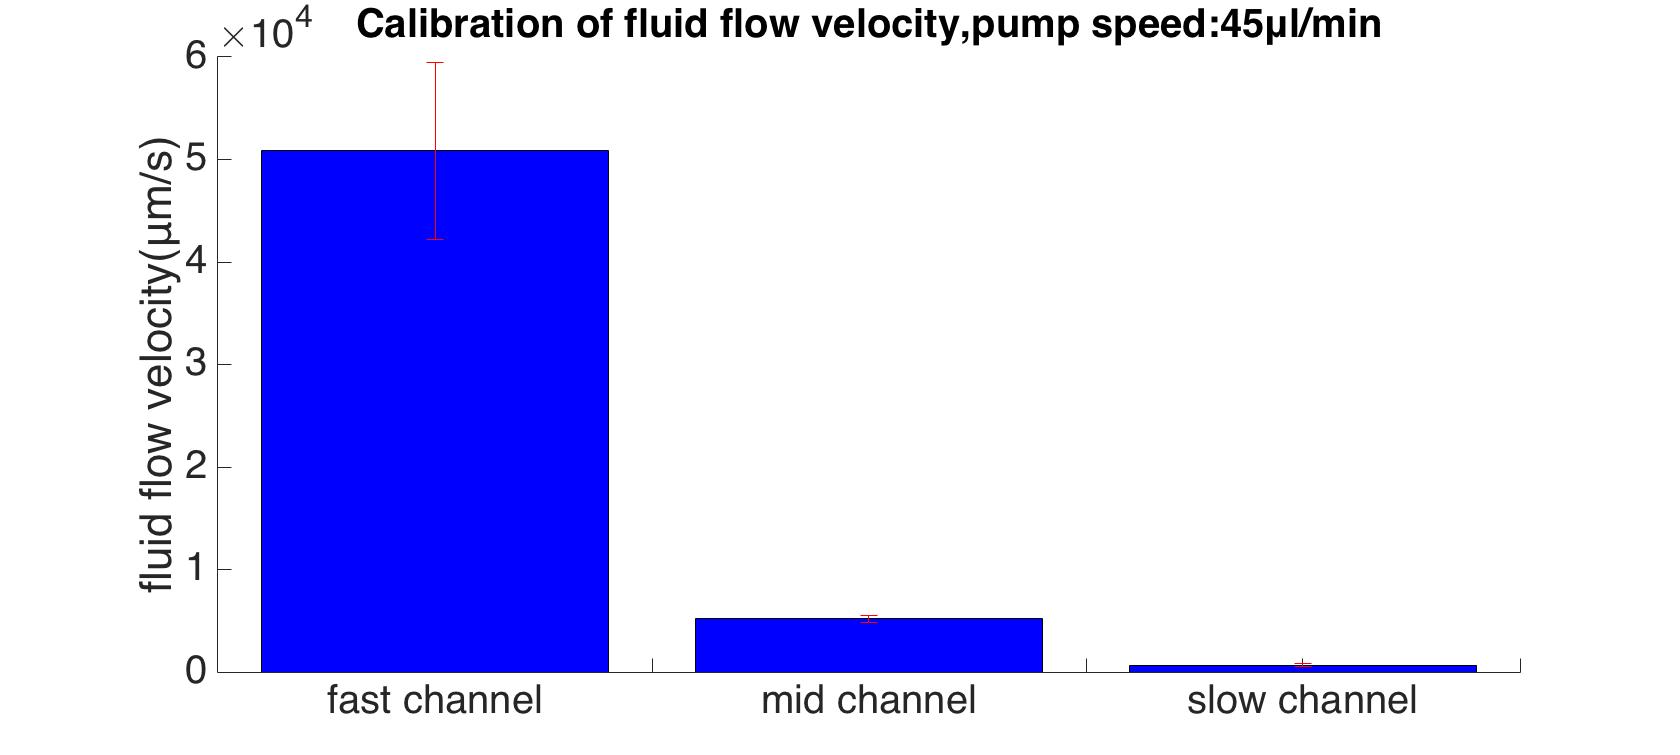
By using MATLAB program, the maximum flow velocities were calculated (13 : 100 : 978). | By using MATLAB program, the maximum flow velocities were calculated (13 : 100 : 978). | ||
| − | {{SUSTech_Image | filename=T--SUSTech_Shenzhen--855C7E02-2E51-441A-9492-A2B281185010.png | caption=Fig. | + | {{SUSTech_Image | filename=T--SUSTech_Shenzhen--855C7E02-2E51-441A-9492-A2B281185010.png | caption=<B>Fig. Maximum Velocities in Each Channel with The Flow Rate of 45ul/min</B> | width=1000px}} |
<html><a href="/Team:SUSTech_Shenzhen/Model/Calibration" class="btn btn-success"><i class="ion-arrow-right-c"></i> Code & Details</a></html> | <html><a href="/Team:SUSTech_Shenzhen/Model/Calibration" class="btn btn-success"><i class="ion-arrow-right-c"></i> Code & Details</a></html> | ||
| Line 67: | Line 67: | ||
FEM is a method for modeling and simulating physics-based problems. It divides a large problem into smaller elements, these smaller elements will be solved separately and then be assembled backed to the original model. A collection of smaller elements is called a “mesh”, the “mesh” is constructed by numerous elements, the smaller the size of the element is, the finer the “mesh” is, and the more accurate will the result be. The final geometry set up can be seen from below. | FEM is a method for modeling and simulating physics-based problems. It divides a large problem into smaller elements, these smaller elements will be solved separately and then be assembled backed to the original model. A collection of smaller elements is called a “mesh”, the “mesh” is constructed by numerous elements, the smaller the size of the element is, the finer the “mesh” is, and the more accurate will the result be. The final geometry set up can be seen from below. | ||
| − | {{SUSTech_Image | filename=T--SUSTech_Shenzhen--geometrydscvdfscvsd.jpg|caption=Fig. | + | {{SUSTech_Image | filename=T--SUSTech_Shenzhen--geometrydscvdfscvsd.jpg|caption=<B>Fig. Final Geometry Setup</B> | width=1000px}} |
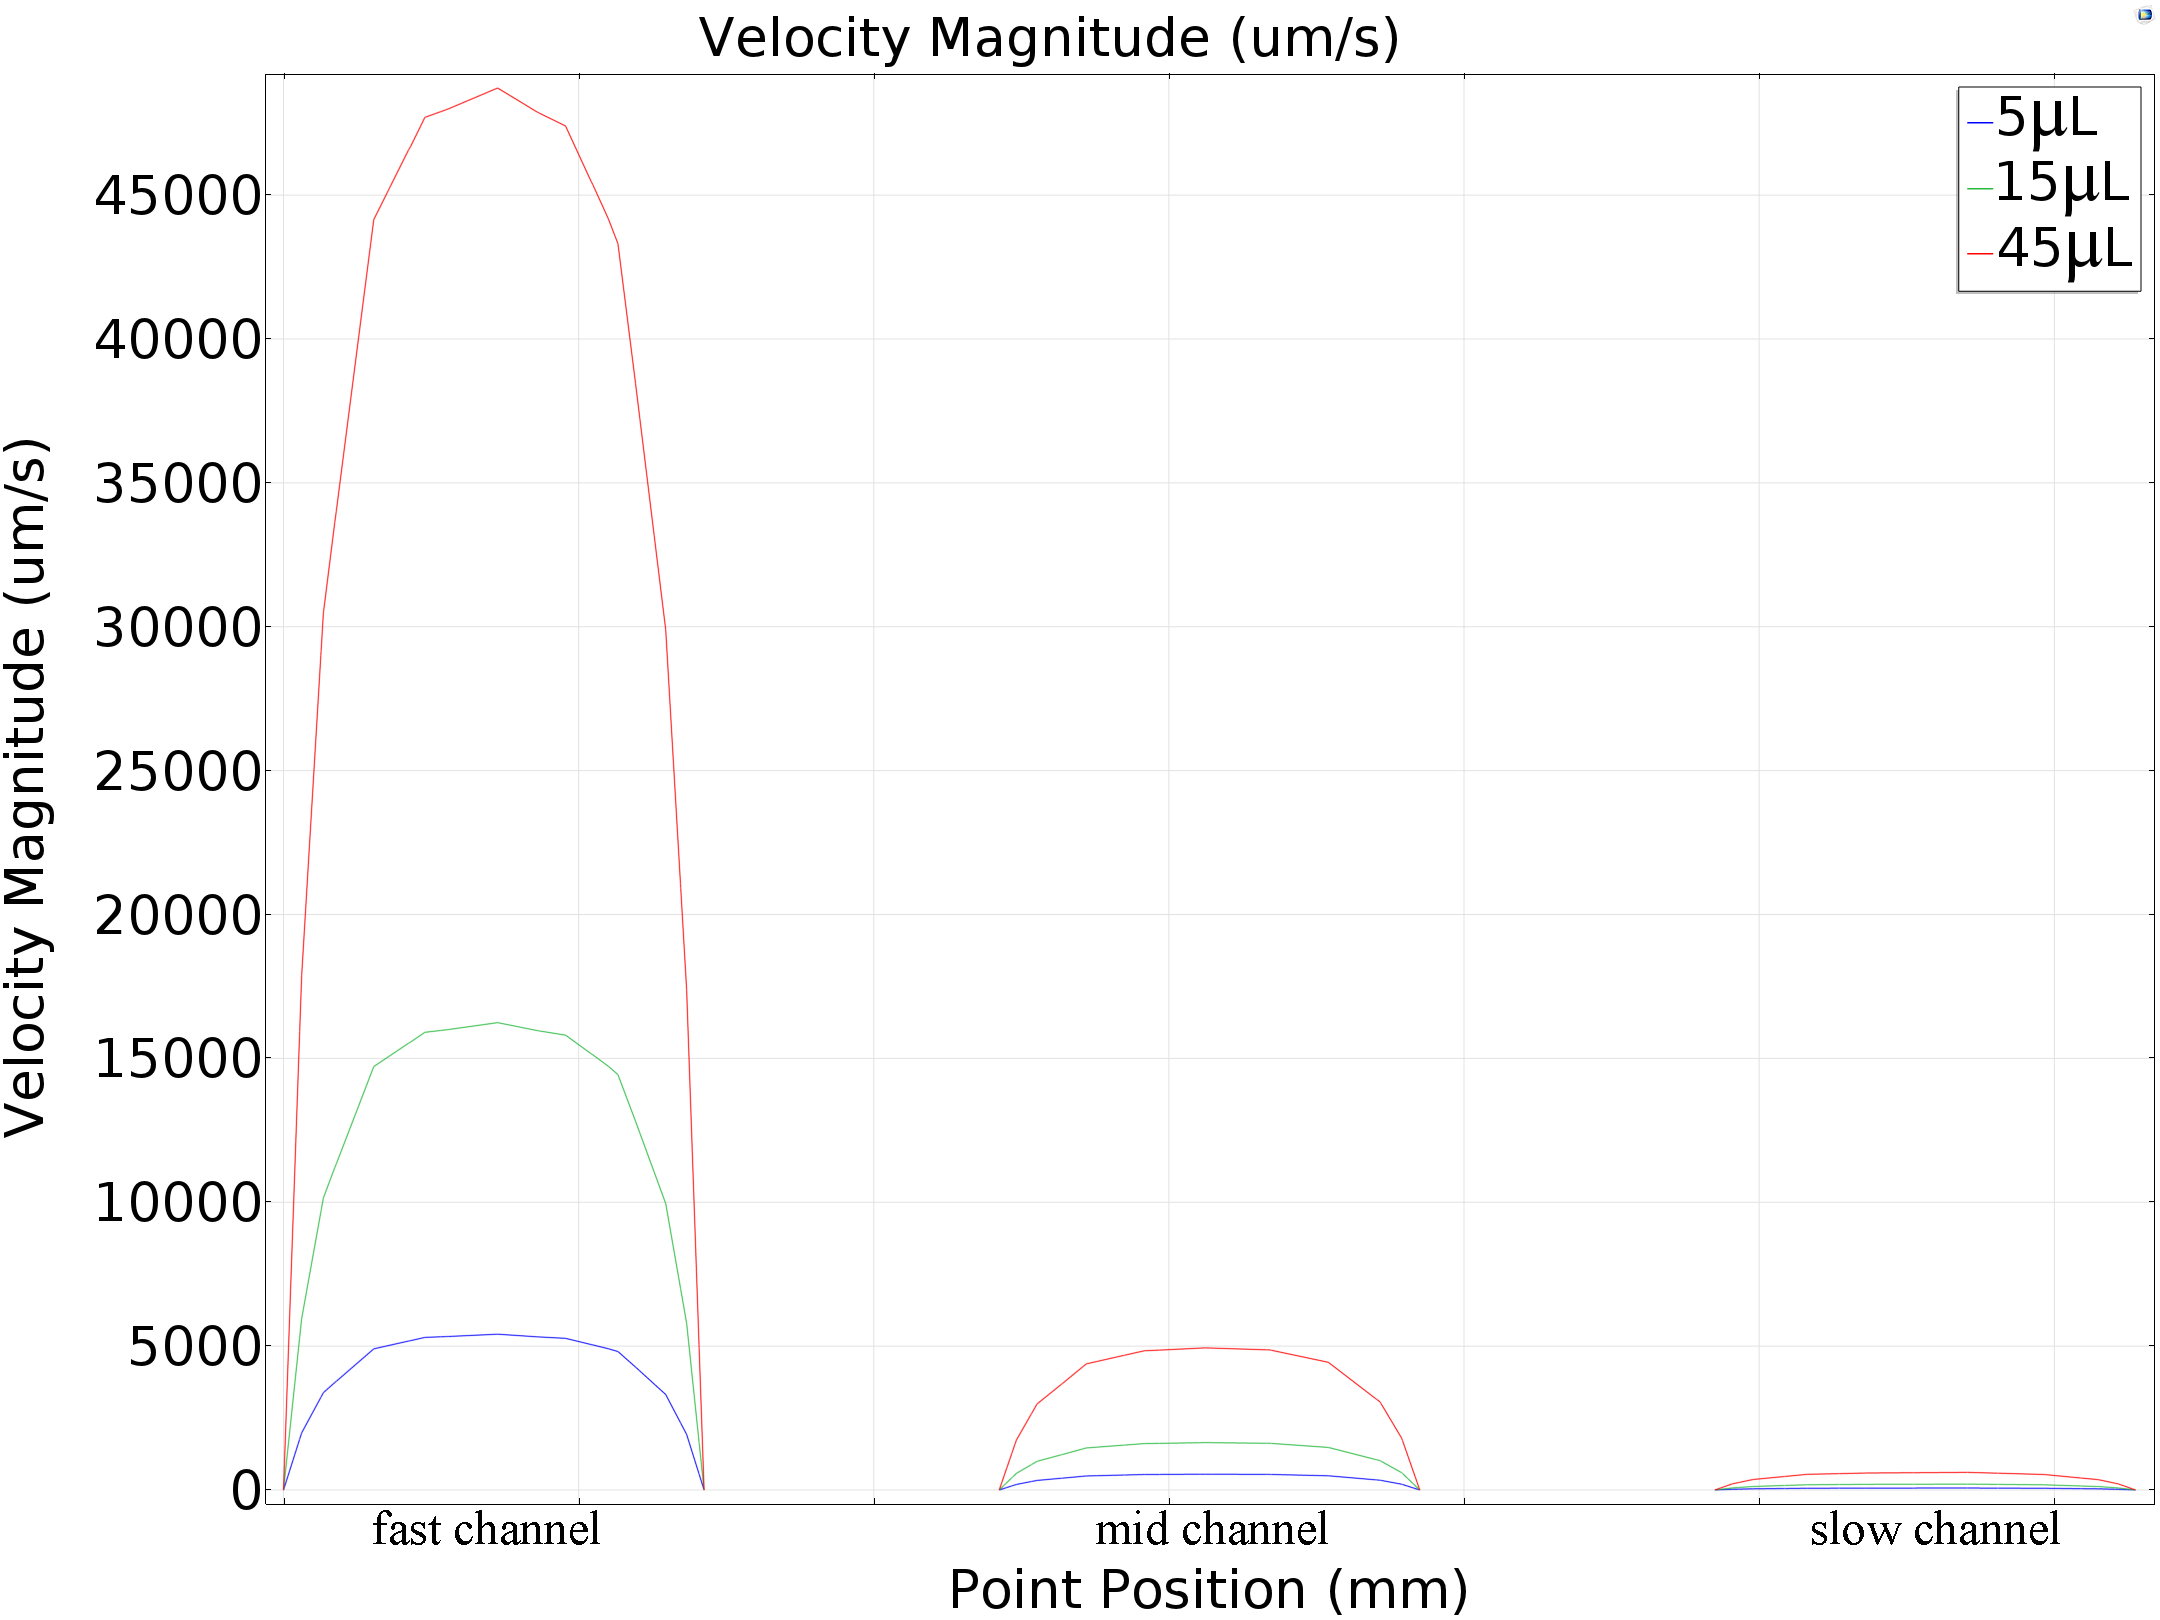
Under different pumped inflow rate(5μL/min,15μL/min and45μL/min), the velocity magnitude distribution was calculated. The result of maximum velocity and shear force applied on the bottom wall matched with the mathematics perfectly( around 80: 10: 1 in all the conditions, shown in the table below). | Under different pumped inflow rate(5μL/min,15μL/min and45μL/min), the velocity magnitude distribution was calculated. The result of maximum velocity and shear force applied on the bottom wall matched with the mathematics perfectly( around 80: 10: 1 in all the conditions, shown in the table below). | ||
| − | {{SUSTech_Image_Center_10 | filename=T--SUSTech_Shenzhen--MSfevefvcef.jpg|caption=Fig. | + | {{SUSTech_Image_Center_10 | filename=T--SUSTech_Shenzhen--MSfevefvcef.jpg|caption=<B>Fig. Velocity Magnitude Distribution on The Cut Line</B> | width=1000px}} |
{|class="table table-striped" | {|class="table table-striped" | ||
| Line 124: | Line 124: | ||
'''Table 4 Simulation Results of Central Line shear Stress''' | '''Table 4 Simulation Results of Central Line shear Stress''' | ||
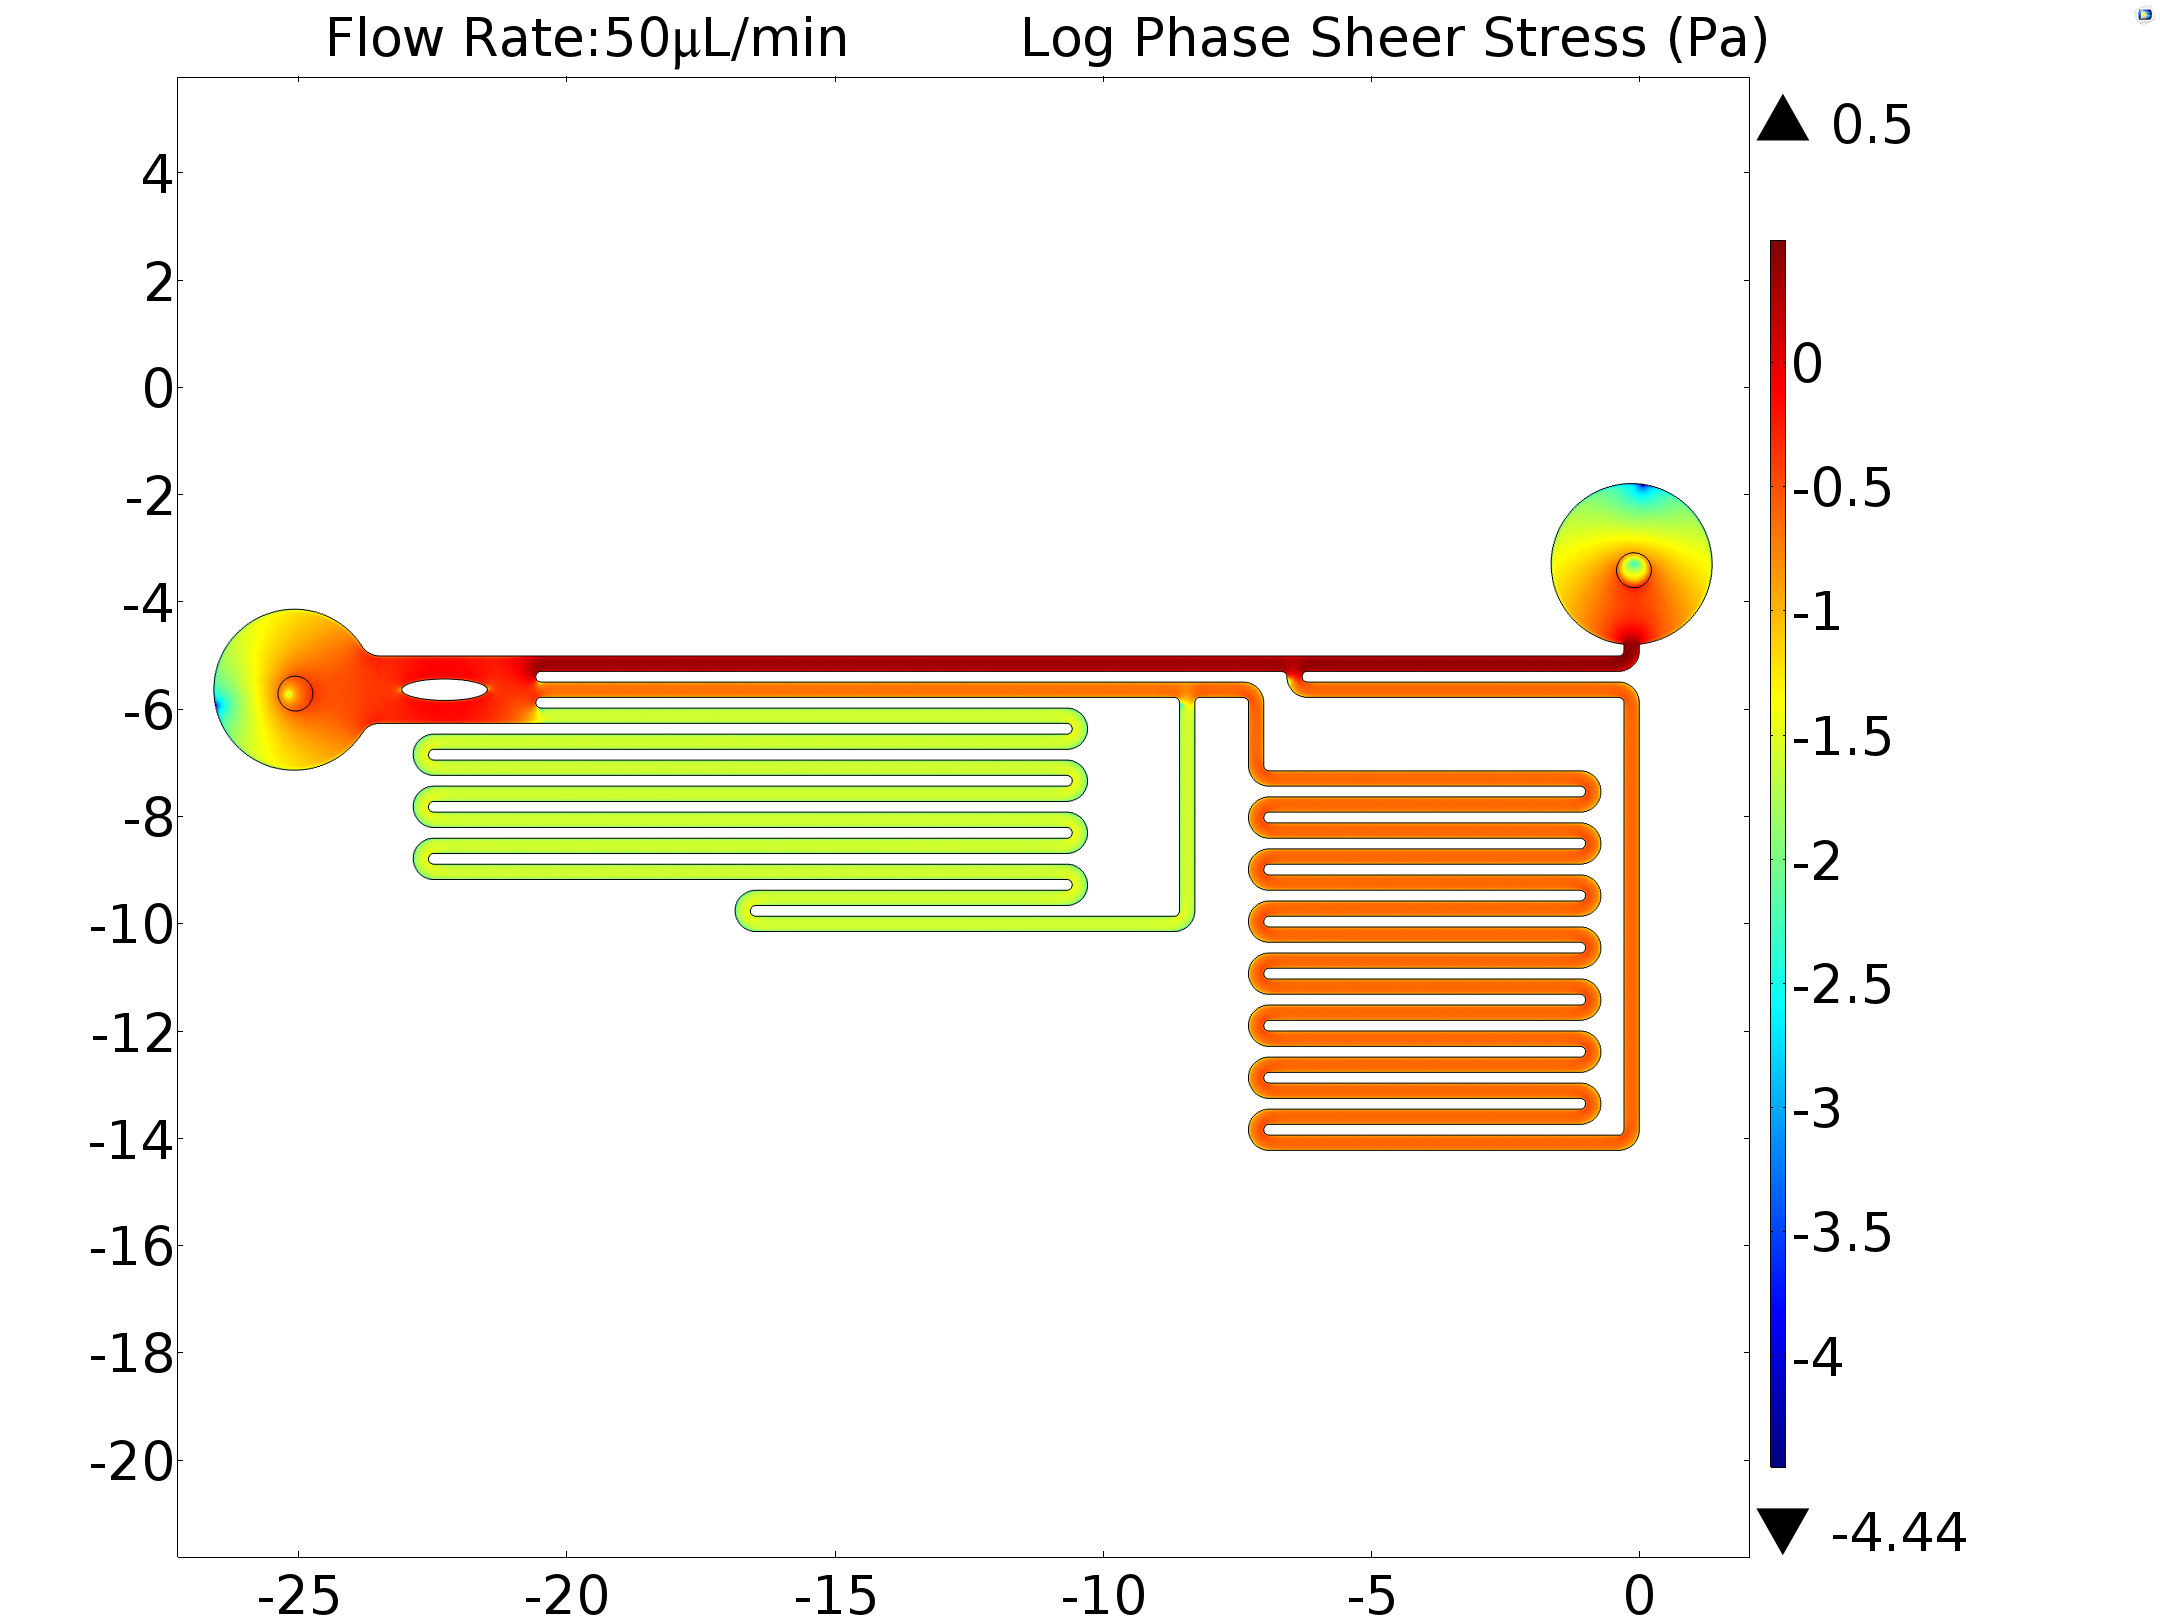
| − | {{SUSTech_Image | filename=T--SUSTech_Shenzhen--sheardsgvfdv.png|caption=Fig. | + | {{SUSTech_Image | filename=T--SUSTech_Shenzhen--sheardsgvfdv.png|caption=<B>Fig. shear Stress Distribution Under Input Flow Rate 50μL/min (log scale)</B> | width=1000px}} |
<html><a href="/Team:SUSTech_Shenzhen/Model/Simulation_Force_Field" class="btn btn-success"><i class="ion-arrow-right-c"></i> Detailed Protocol</a></html> | <html><a href="/Team:SUSTech_Shenzhen/Model/Simulation_Force_Field" class="btn btn-success"><i class="ion-arrow-right-c"></i> Detailed Protocol</a></html> | ||
Revision as of 08:26, 19 October 2016

Model
Contents
Overview
When we were discovering audio-genetics, to find correspondences between our mechanosensitive(MS) channels and different sound wavelengths, we needed the support of modeling and logical result ascription besides constructing a huge mutagenesis library and testing them in vitro continuously, although it is already very hard to do. We designed the experiment based on the discovery of the mechanism of MS channel and applyed it on the regulation of downstream gene expression. Modeling has been our guide throughout the project and we finally got the results we initially expected.
On one hand, we employed microfluidics to realize the stable force field controlled by fluidic velocity. In vitro experiments were operated on the designed chips. On the other hand, we used various devices to generate sound field and tested cell response in different conditions.
Finite Element Analysis (FEA) was applied to modeling of the field generated by the microfluidic devices and the acoustic stimulators. Modeling reliability has been tested and confirmed by comparing the calculated results with raw results from the experiments.
Force Field
To quantitatively measure the response of MS channel on the cell membrane, we designed our experiment manipulated on microfluidic chip. CHO-K1 cells were cultured adherent on the bottom of PDMS tunnel. Stable and flexible force field could be formed surrounding cell, which directly controlled by the pumped-inflow rate. Each time when we applied a constant pumped inflow, cells in 3 different observation tunnel could receive corresponding small, middle, large, 3 level of force magnitude(1: 9: 81). By changing the pumped flow rate, we could measure MS channel response under a series of forces with different magnitude order.
Mathematical Demonstration
In experiment, when fluid(culture medium x flowed through the tunnel, the shear force was applied on the wall. Seeing the culture medium as a Newtonian flow, it has a constant viscosity μ,0.012dyn·s/cm2[1]. The shear stress that medium generated on the wall is proportional to strain rate. As a result, we could relate the magnitude of stress to the velocity gradient along the transversal surface of each tunnel.
Due to the extremely small scale of microfluidic tunnel (only 0.285mm of width and 0.090mm of height), fluid in it observes the Laminar flow. We could assume there is no turbulence when inflow applied constantly, even at the corners, and the head loss of the pumped inflow could also be ignored. The modeling of flow between 2 parallel plates applies to such stable state, in which the magnitude of shear stress on the bottom is proportional to the maximum velocity( at the longitudinal central line).
As the shear stress is proved proportional to the flow rate in the tunnel, we designed the chip to achieve that each of 3 tunnels in observation area has the same transversal surface but the gradient (81: 9: 1 from up to bottom) flow rate, also the average speed.
The lengths of straight tunnels between AB and AC (LAB, LAC)are 14.3mm and 12.0mm, and the curved tunnels between AB and BC(RAB, RBC) are 108.0 mm and 105.0mm.
Based on the integral form of the continuity equation for an incompressible fluid, during a given time, the sum of flow volume in each branch is equal to the total volume pumped in the whole chamber. According to the Kirchhoff's law, the accumulation of flow speed at the joint point must be zero. It is easy to get the equation that\begin{matrix} L_{AC}V_1=L_{AB}V_2+R_{AB} V_3 \\ V_2:V_3=R_{AB}:L_{AB} \end{matrix}
Consequently, we could reach the conclusion that the maximum velocity, average flow rate and the shear force on the bottom of each tunnel is at a ratio of 81 : 9 : 1. To verify the modeling result, we made calibration in the real microfluidics chip, and the testing result is very close to designing value (about 75 : 8 : 1 of the maximum velocity ratio in each tunnel) and the simulation result ( 80 : 8 : 1).
Experimental result Analysis
On October 12th, we testify one of our MS channels, Piezo1, under the simulation of shear stress, with R-GECO fluorescent indicating its activation level. (results showed below) 12等今晚结果图放一张和动力学解释(详细解释也另放一页)
Calibration
Rainbow beads (SPHEROTM Rainbow Calibration Particles, diameter: 6um) were dissolved in the cell culture medium, which contained the dead cells. A series of pumped flow rate(5ul/min, 15ul/min, and 45ul/min) were applied to generate a steady fluid flow. The exposure time was set to 100ms.
By using MATLAB program, the maximum flow velocities were calculated (13 : 100 : 978).
Simulation
To make the analysis of experimental result is convincible, we also made the simulation using the Finite Element Method(FEM) to define that the field in microfluidic channel confirmed to our expectation.
FEM is a method for modeling and simulating physics-based problems. It divides a large problem into smaller elements, these smaller elements will be solved separately and then be assembled backed to the original model. A collection of smaller elements is called a “mesh”, the “mesh” is constructed by numerous elements, the smaller the size of the element is, the finer the “mesh” is, and the more accurate will the result be. The final geometry set up can be seen from below.
Under different pumped inflow rate(5μL/min,15μL/min and45μL/min), the velocity magnitude distribution was calculated. The result of maximum velocity and shear force applied on the bottom wall matched with the mathematics perfectly( around 80: 10: 1 in all the conditions, shown in the table below).
|
Channel Flow Rate |
fast | middle | slow |
| 5μL/min | 5413.994μm/s | 548.52153μm/s | 67.9229μm/s |
| 15μL/min | 16241.73779μm/s | 1645.63652μm/s | 203.79536μm/s |
| 45μL/min | 48723.94763μm/s | 4937.93255μm/s | 611.65866μm/s |
Table. Simulation Results of Central Line Speed of each channel
In order to obtain the exact shear force applied to the cells by the fluid flow. We inputed the experimentally used flow rate as a boundary condition(6.25μL/min,50μL/min) in our model. The shear stress on the bottom of every channel where the cells adhered to was also calculated.
|
Channel Flow Rate |
fast | middle | slow |
| 6.25μL/min | 1.07519Pa | 0.10819Pa | 0.0033Pa |
| 50μL/min | 2.15057Pa | 0.21642Pa | 0.02641Pa |
Table 4 Simulation Results of Central Line shear Stress
Acoustic Field
Sonic and ultrasonic waves could generate a pressure field to the cells adhering to the bottom of the cell dish. In our study of the sensitivity of mechanosensitive (MS) channel, we really found a most efficient sound frequency using 108KHz ultrasonic transducer and around 80V driving voltage. However, to quantitively define the relationship of channel opening ( considering the influence of energy or force difference), it was important to know the pressure field distribution on the cell layer with a certain device configuration. Mathematical analysis and finite element analysis (FEA) were used to define the modeling.
Firstly, a function was studied to give pressure on the surface of the ultrasonic transducer-water interface knowing the input voltage. Based on the interface pressure and physical properties of device, we constructed FEA models to simulate the ultrasonic radiant pressure field of the cell layer. Pressure field was studied in conditions of diverse power and distance between transducer interface and cell layer.

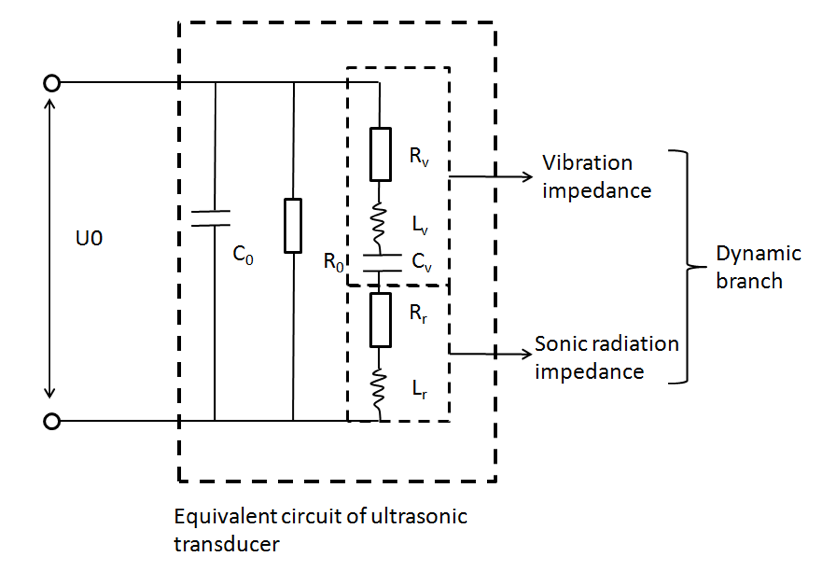
The equivalent circuit of ultrasonic transducer was used to calculate the ultrasonic radiant power of an ultrasonic transducer. We assume the ultrasonic energy was evenly distributed on the transducer interface[2], that is:
I\left( x,y,z = 0 \right) = \left\{ \begin{matrix} I_{0},x^{2} + y^{2} \leq R^{2} \\ 0,x^{2} + y^{2} \lt R^{2} \end{matrix} \right.\
Where I0 is the absolute ultrasound intensity, R is the radio of transducer interface
According to power intensity and pressure relation:
I_{0} = \frac{{P_{0}}^{2}}{2c\rho}
In which P_0 , c, \rho are respectively absolute pressure, acoustic velocity and water density. We managed to calculate the pressure on the transducer-culture medium interface.
Then, we implemented FEM to do a series of simulations to find the absolute pressure filed distribution in different conditions. 108KHz and 1.1MHz transducer device were modeled as is shown in Fig.
A
BC
DFig. A. Pressure distribution of 108KHz ultrasonic transducer, the transducer was 1.0mm far above the cell layer, 251700 Pa was added to the transducer-water interface. B Pressure distribution of 1.1MHz ultrasonic transducer, the transducer was 1.0mm far above the cell layer. 60V voltage was input to drive the 1.1MHz transducer thus 634000 Pa was added to the transducer-water interface. Vertical pressure distribution on different concentric circles for 108KHz condition (C) and 1.1MHz condition (D).
The influence of distance error on pressure distribution pattern was also studied, which indicated that the 108KHz transducer was very robust to distance error, while the 1.1MHz acted as a chaos when little distance error occurs.
In all, the 108KHz ultrasonic transducer was recommended as ultrasonic stimulator for quantitative measure cell response based on modeling and experimental results.
References
- ↑ Booth, R., & Kim, H. (2012). Characterization of a microfluidic in vitro model of the blood-brain barrier (μBBB). Lab on a Chip, 12(10), 1784-1792.
- ↑ A Zhen-Xiao, Simulation and Visualization of the Radiated acoustic Field of Ultrasonic Transducer. Nondestructive examination (NDE), 33(5),2-6

