HomePage • PROJECT • Demonstrations
Demonstration
FOR FURTHER DEMONSTRATION OF OUR PROJECT, let-7a was dissolved in 7% mixed human serum collected from 50 healthy volunteers on various concentrations to assess the reliability, sensibility and specificity of our scheme.
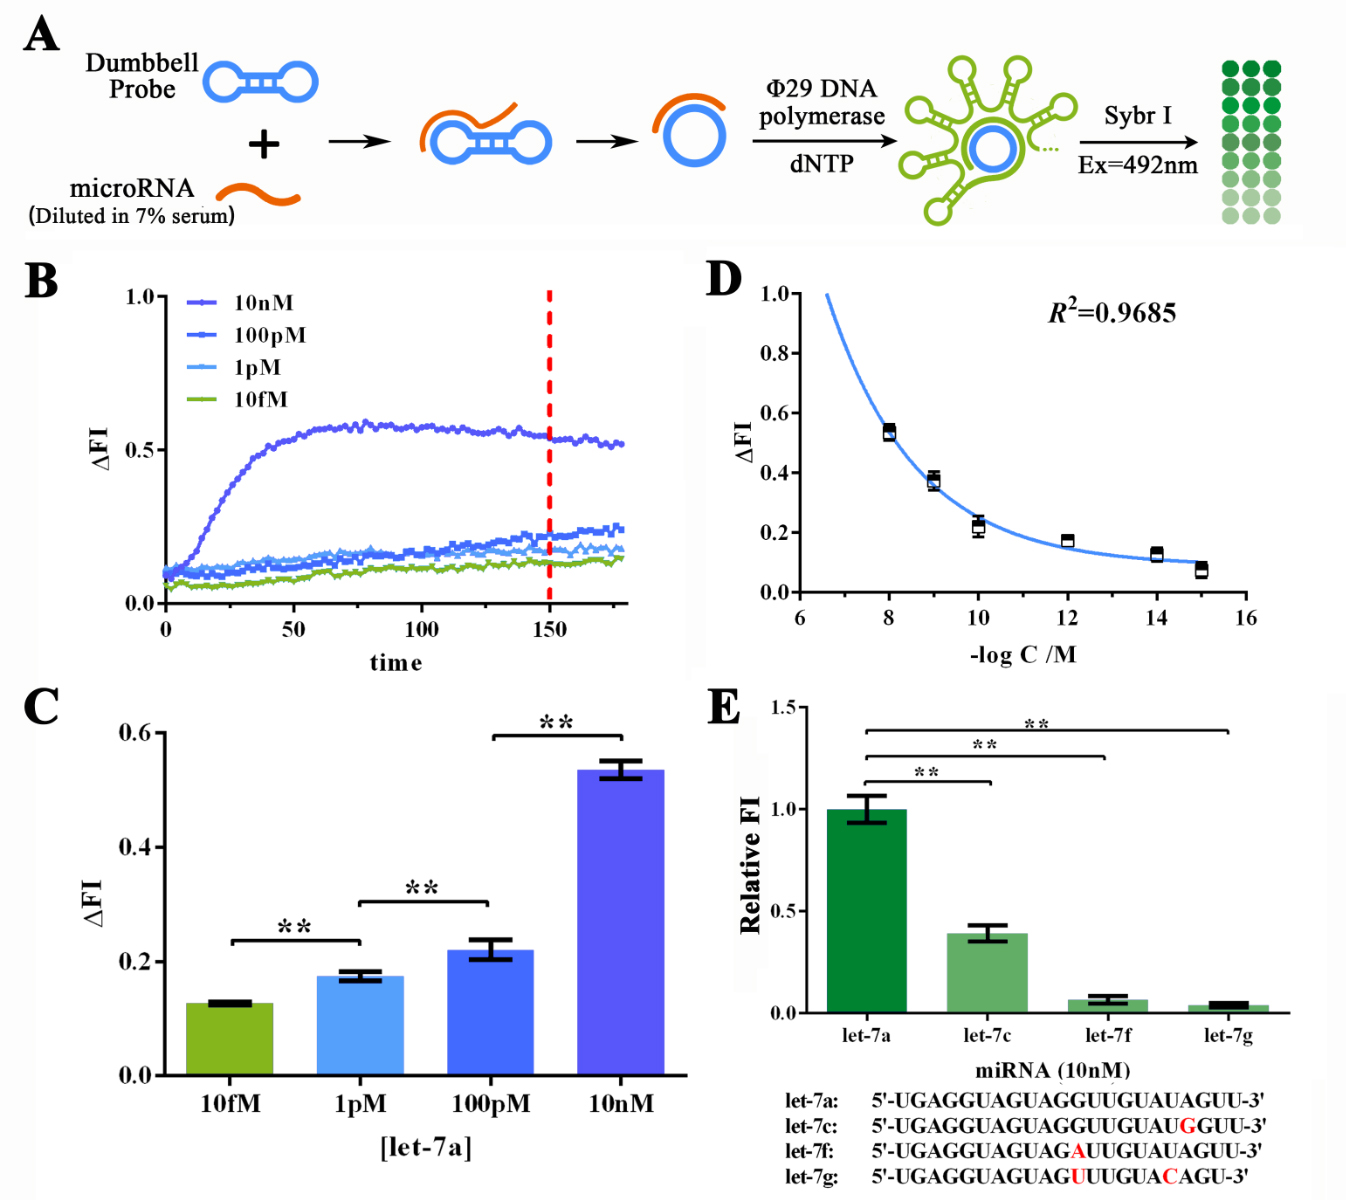
Similarly, the sensibility and specificity of RCA reaction were then determined with sybr I fluorescence assay (Figure 1). MiR let-7a, as the target miRNA was DISOLVED IN 7% HUMAN SERUM for various concentrations to determine the sensitivity of RCA reaction (Figure 1A). The best reaction time under such circumstance was determined to be 150min through a Real-time fluorescent assay using Sybr I as the Fluorescent dye indicating the dsDNA amount in reaction solution (Figure 1B and C). The sensitivity of such system was estimated to be under 1 fM building on a plotting the ΔFI data against minus logarithm of let-7a concentration and its fitting curve (Figure 1D). A brilliant specificity of RCA reaction was also shown by evaluating the RCA reaction strength under the input miRNA of let-7a, let-7c, let-7f and let-7g (Figure 1E).
Figure 1. Evaluation of the sensitivity and specificity of RCA reactions initiated by serum-dissolved miRNAs by Sybr I fluorescent assay.
((A) Schematic representation of the Sybr I fluorescent assay for RCA reactions for the RCA reaction initiated by serum-dissolved miRNAs. (B) Real-time fluorescent measurements for RCA process, carried out at 10fM, 1pM, 100 pM, and 10nM of let-7a. The results on 120-min time point was labeled as such time duration was used for following experiments. (C) Plot of fluorescent intensity variation against let-7a concentration. (D) Plot of fluorescent intensity variation against negative logarithm of let-7a concentration. (E) Determination of the specificity of RCA reaction initiated by collaboration of designed probe and let-7a, let-7c (single-mismatch), let-7f (single-mismatch) or let-7g (double-mismatch). The bases marked red in the sequences of tested miRNAs displayed below are mismatched bases against let-7a. The concentration used in such assay was 10nM. MiRNAs were dissolved and diluted into various concentrations in 7% human serum, which was the mixture of serum samples from 50 healthy volunteers. The excitation wavelength was 495nm, the emission wavelength was 515nm. Fluorescence intensity variation was calculated by subtracting the fluorescent intensity of the blank group. For the calculation of relative fluorescence intensity variation, the let-7a group was set arbitrarily at 1.0, and the levels of the other groups were adjusted correspondingly. All these experiments were run in three parallel reactions, and the error bars were obtained from at least three independent experiments. The squared correlation coefficient (R2) was analyzed by Graphpad Prism 6.0. ** p<0.01.
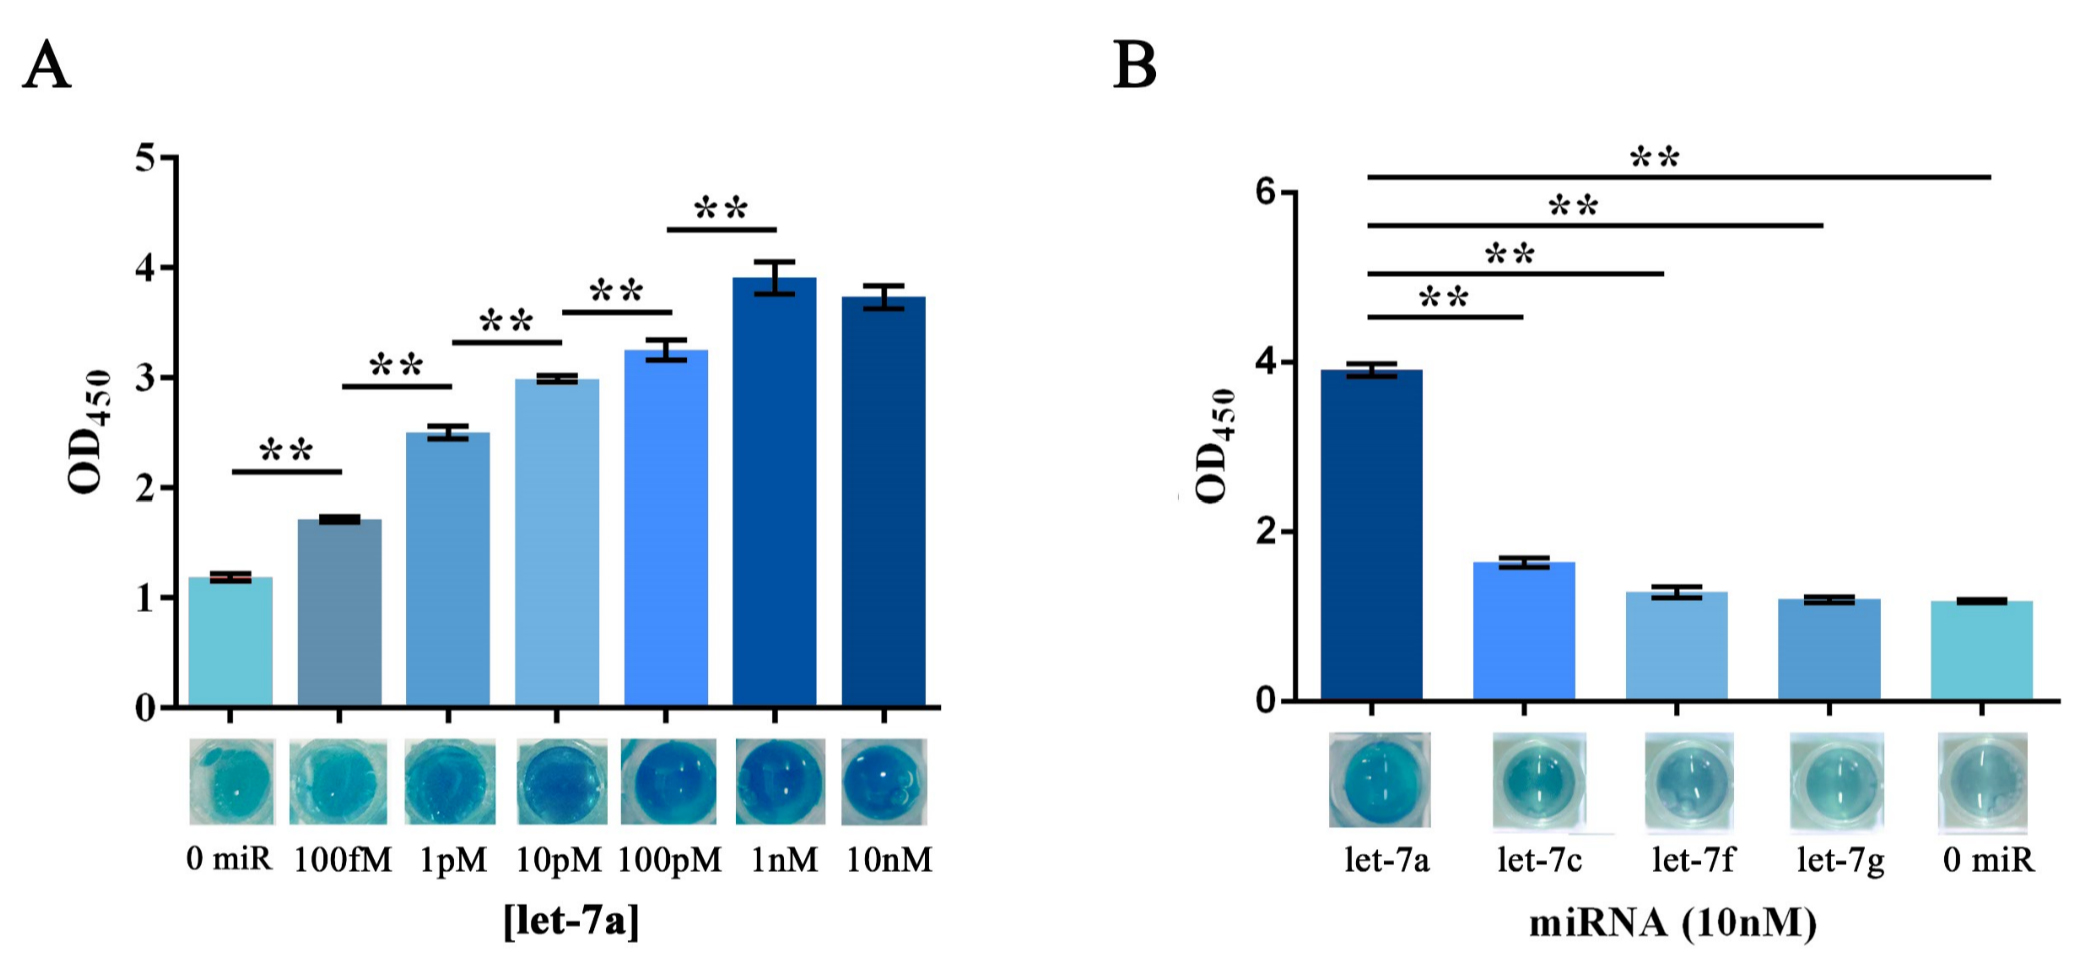
Subsequently, RCA outputs were then used for dCas9 binding and down-stream HRP activity analysis (Figure 2). Through which, the preciously-determined protein concentration was further validated and a basic demonstration on the specificity and sensitivity of our project was presented (Figure 2A and B).
Figure 2. HRP activity assay evaluating the sensitivity and specificity of the visualization process of RCA-output signal amplified from 7% serum dissolved miRNAs.
(A) Plots of OD450 against different concentration of initial input let-7a. In such assay, 0.16M sulfuric acid was added into the reaction solution to stop the reaction and forming productions with the maximum absorbance on 450nm. Images showed below was the visualized output signal of different concentration of initial input let-7a respectively before adding the stop solution. (B) Determination of the specificity of the whole workflow under different serum dissolved miRNAs of let-7a, let-7c (single-mismatch), let-7f (single-mismatch) or let-7g (double-mismatch). Images showed below was the visualized output signal of different initial input miRNA respectively before adding the stop solution. The 7% human serum used in the experiment was the mixture of serum samples from 50 healthy volunteers. All these experiments were run in three parallel reactions, and the error bars were obtained from at least three independent experiments. ** p<0.01.
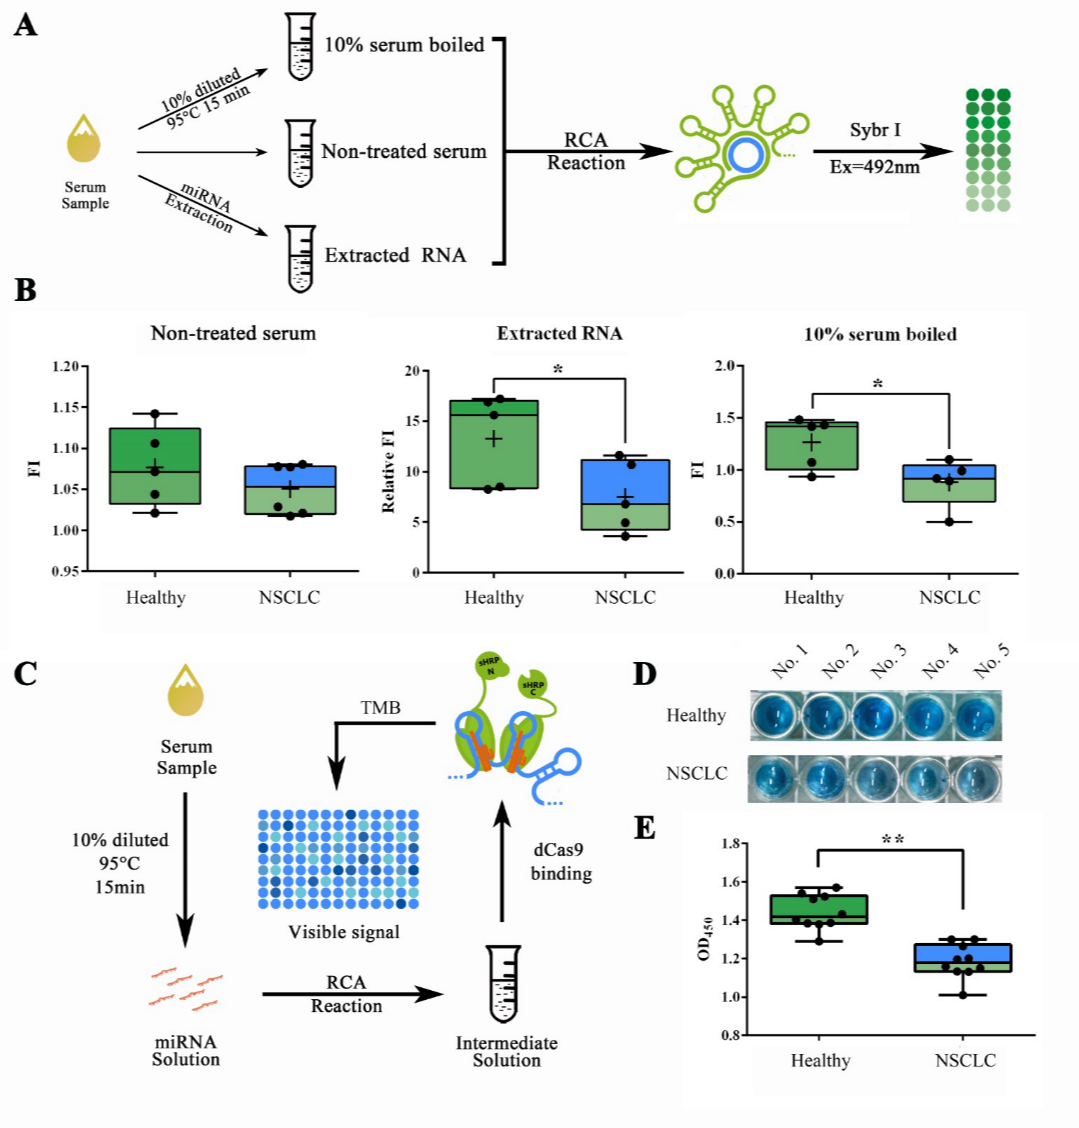
MOREOVER, as a deepened demonstration of the whole detection workflow, serum samples collected from NSCLC patients and healthy volunteers were tested after different pretreatment for further demonstration of our scheme. For such matters, we collected serum samples from 5 healthy volunteers and 5 volunteered non-small cell lung cancer (NSCLC) patients under their consent. Patient group was formed by two phase III patients, two phase IV patients and one phase V patient. To evaluate the optimal explosion effect of the serum miRNAs, which were previously reported to mainly exist as RNA-protein complex or even in exosomes, for further detection, we used different methods for the pre-treatment of serum samples (Figure 3A). RCA reaction followed by a Sybr I fluorescence assay revealed that both the approaches of serum RNA extraction by TRIzol LS and 10% serum boiled in 95℃ for 15 min can show a significantly lower concentration of let-7a in NSCLC patients compared to healthy people, and the latter is more convenient and effective (Figure 3B). Which then, made the low-cost, high efficient RNA extraction possible for field-ready detection of miRNAs in serum sample (Figure 3C). We then expanded our sample numbers into 20 (10 healthy people and 10 NSCLC patients). Results showed a visiable color difference between NSCLC group and healthy group (Figure 3D), further analysis indicated that the serum let-7a concentration determined by our method in NSCLC patients was abourt 21% lower than healthy people. Such result corroborated to the previous literature reported 20%-60% decrease measured through qRT-PCR(Figure 3D and E)1.
Figure 3. Detection workflow validation with samples from NSCLC patients.
(A) Schematic representation of the pre-treatment process. (B) Sybr I fluorescent assay for RCA products amplified from serum samples with different pre-treatment process. Serum samples were collected from healthy volunteers and phase III, IV and V NSCLC patients. (C) Schematic representation of the complete visible detection process from serum sample. (D) Images showed the visualized signal output from samples collected in healthy people and NSCLC patients. (E) Plots of OD450 obtained through the complete detection workflow on samples of 10 healthy volunteers and 10 NSCLC patients. A stop solution containing 0.16M sulfuric acid was added so that the results could be quantified using OD450. All these experiments were run in three parallel reactions. * p<0.05.
Generally speaking, brilliant specificity and sensitivity was achieved in stimulated clinical condition and actual patient samples. Thus provided a solid demonstration of our scheme and a sound support for the further development of such system.
The detailed results could be found on the RESULT PAGE.
Reference
1 Jeong, H. C. et al. Aberrant expression of let-7a miRNA in the blood of non-small cell lung cancer patients. Mol Med Rep 4, 383-387, doi:10.3892/mmr.2011.430 (2011).


