HomePage • PROJECT • Prooof of Concept
Proof of Concept
Wet Lab
To validate and demonstrate our design, miR let-7a, as an important serum biomarker for non-small cell lung cancer, was chosen as the target miRNA. Previously, miR let-7a has been reported to be down-regulated for 20%-40% in serum samples from NSCLC patients compared to healthy people 1.
AS A PROOF OF CONCEPT, let-7a was diluted in DEPC-treated water on various concentrations to assess the reliability, sensibility and specificity of our scheme.
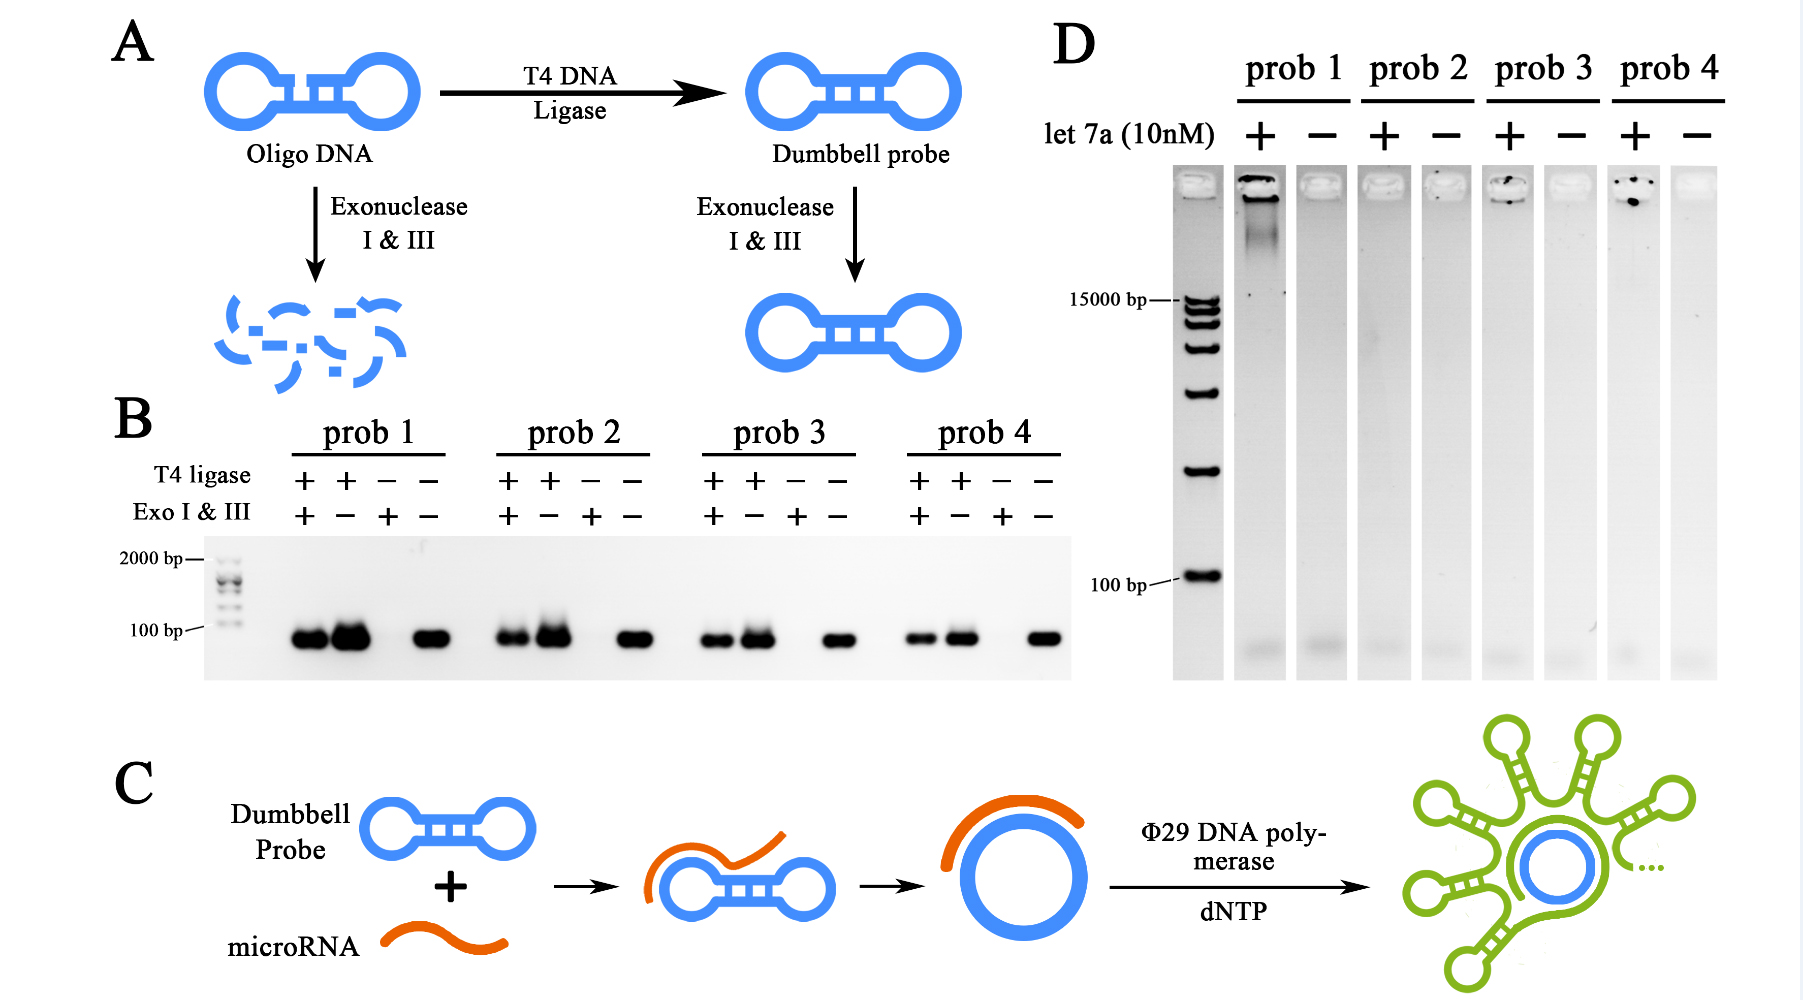
To begin with, four different probes were designed to be probe candidates for the RCA reaction based on let7a sequence and probe design principles. Once they have been synthesized, sealed and purified (Figure 1A and B), RCA reactions with 10nM let-7a input were performed against all four probes to select the optimal probe for further test (Figure 1C and D). Electrophoresis results showed that prob1, prob3 and prob4 were all functional for the RCA reaction once sealed, among which, prob1 showed the strongest ability for such reaction. Prob1 was then selected as the probe in the further experiment.
Figure 1. Preparation and selection of dumbbell probes.
(A)Schematic representation of the preparation of the probes, the dumbbell structure was formed from synthesized oligo DNA through T7 DNA ligase, the un-ligated ones were digested by Exonuclease I and III to avoid unspecified amplification. (B) Agarose gel electrophoresis showing the preparation results of four different probes. (C) Schematic representation of miRNA initiated Rolling Cycle Amplification (RCA). (D) Agarose gel electrophoresis showing the results of the RCA products from four different probes initiated by miRNA let-7a. The concentration of target miRNA was 10nM. The RCA reactions were performed for 2 hours. All gel images were color-inverted to gain a better contrast.
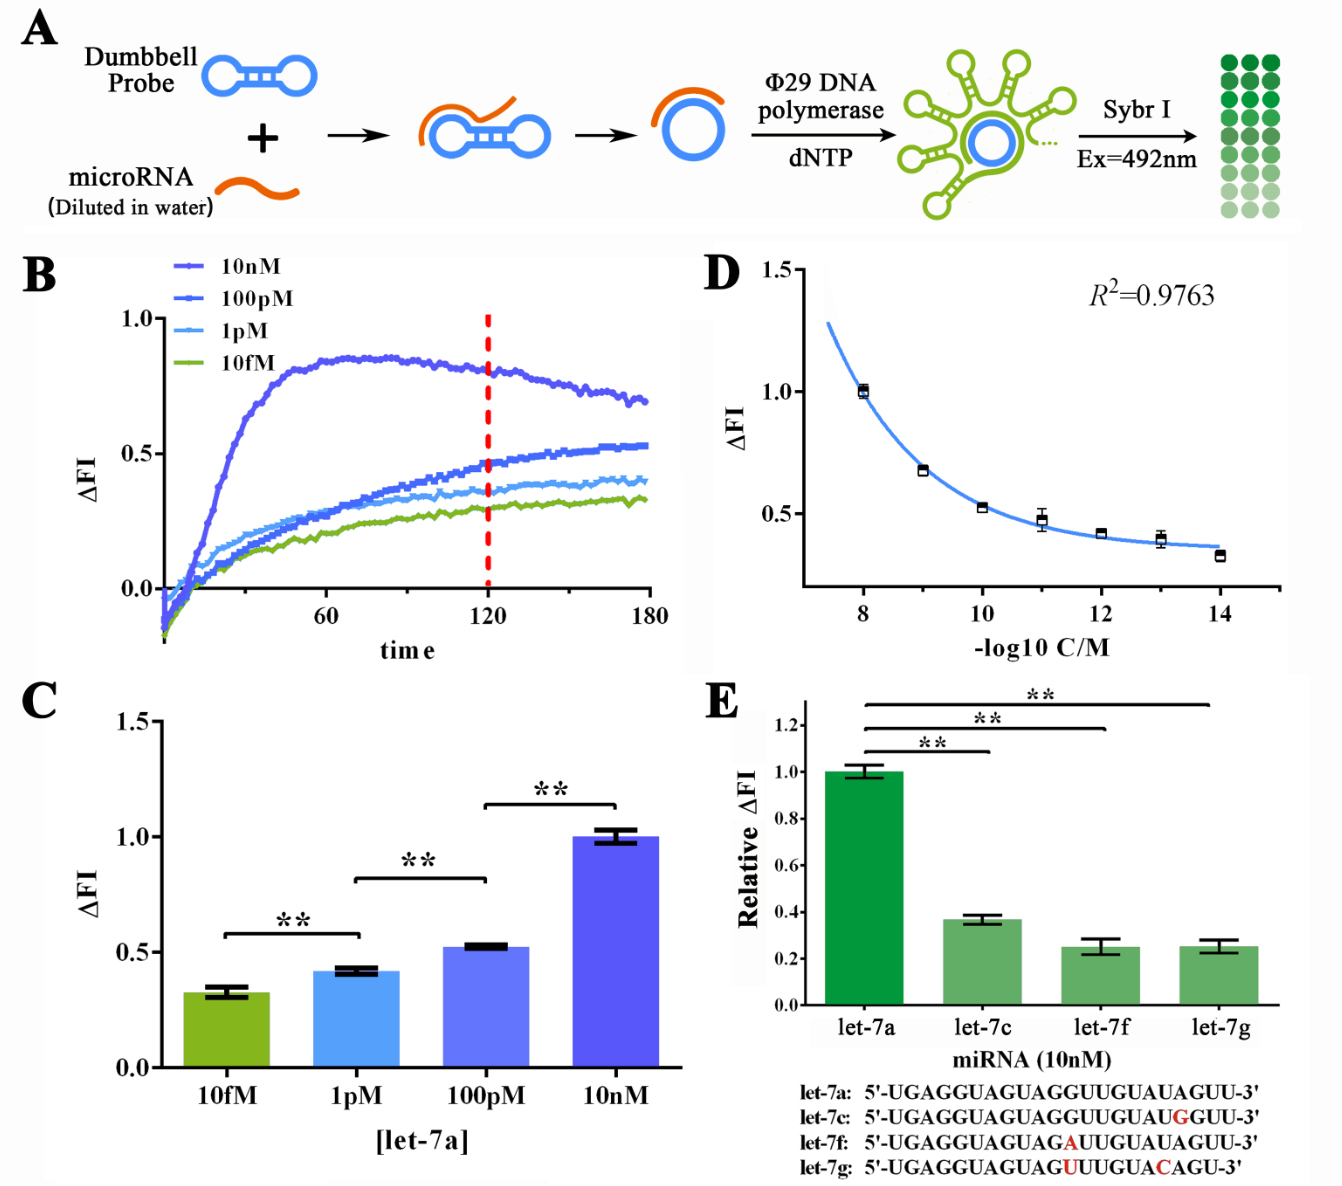
By using this probe, the sensibility and specificity of RCA reaction were then determined with sybr I fluorescence assay (Figure 2). MiR let-7a, as the target miRNA was DISOLVED IN DEPC-TREATED WATER for various concentrations to determine the sensitivity of RCA reaction (Figure 2A). The best reaction time under such circumstance was determined to be 120min through a Real-time fluorescent assay using Sybr I as the Fluorescent dye indicating the dsDNA amount in reaction solution (Figure 2B and C). The sensitivity of such system was estimated to be under 1 fM building on a plotting the ΔFI data against minus logarithm of let-7a concentration and its fitting curve (Figure 2D). A brilliant specificity of RCA reaction was also shown by evaluating the RCA reaction strength under the input miRNA of let-7a, let-7c, let-7f and let-7g (Figure 2E).
Figure 2. Evaluation of the sensitivity and specificity of RCA reactions initiated by water-dissolved miRNAs by Sybr I fluorescent assay.
(A) Schematic representation of the Sybr I fluorescent assay for RCA reactions for the RCA reaction initiated by water-dissolved miRNAs. (B) Real-time fluorescent measurements for RCA process, carried out at 10fM, 1pM, 100 pM, and 10nM of let-7a. The results on 120-min time point was labeled as such time duration was used for following experiments. (C) Plot of fluorescent intensity variation against let-7a concentration. (D) Plot of fluorescent intensity variation against negative logarithm of let-7a concentration. (E) Determination of the specificity of RCA reaction initiated by collaboration of designed probe and let-7a, let-7c (single-mismatch), let-7f (single-mismatch) or let-7g (double-mismatch). The bases marked red in the sequences of tested miRNAs displayed below are mismatched bases against let-7a. The concentration used in such assay was 10nM. The excitation wavelength was 495nm, the emission wavelength was 515nm. Fluorescence intensity variation was calculated by subtracting the fluorescent intensity of the blank group. For the calculation of relative fluorescence intensity variation, the let-7a group was set arbitrarily at 1.0, and the levels of the other groups were adjusted correspondingly. All these experiments were run in three parallel reactions, and the error bars were obtained from at least three independent experiments. The squared correlation coefficient (R2) was analyzed by Graphpad Prism 6.0. ** p<0.01.
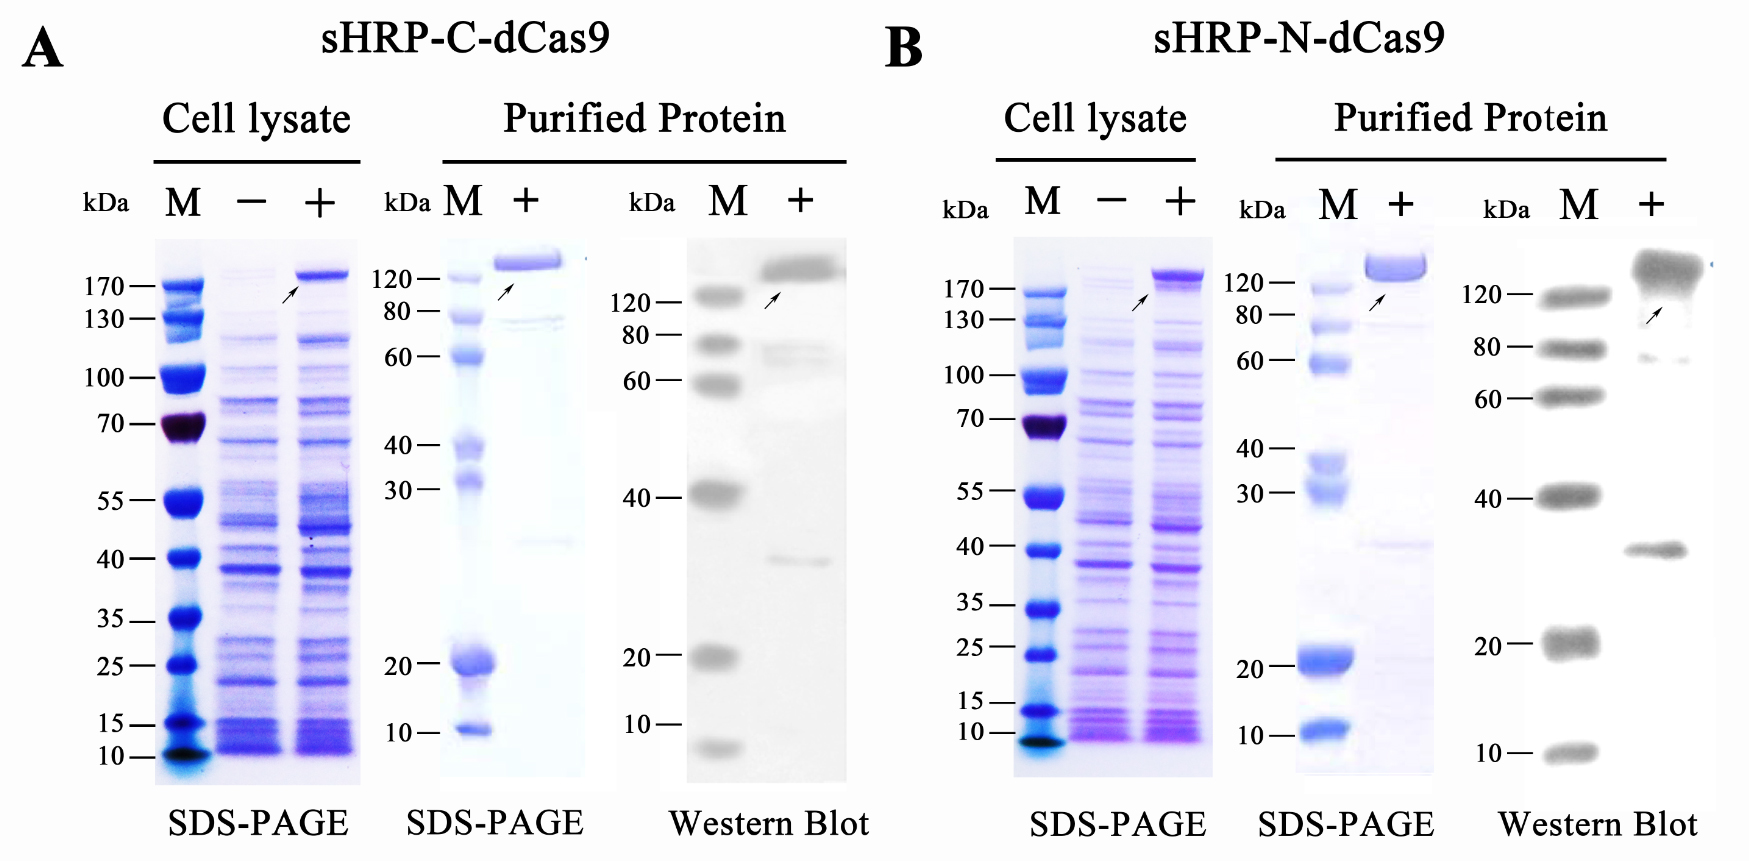
Moreover, N-sHdC and C-sHdC protein were expressed and purified from E.coli. The expression and purification was verified through SDS-PAGE and Western blots (probed with an anti-His-tag antibody) (Figure 3).
Figure 3. Prokaryotic expression and protein purification of split-HRP-dCas9 fusion proteins.
(A) Expression and purification of sHRP-C-dCas9 protein. (B) Expression and purification of sHRP-C-dCas9 protein. Western blots were probed with an anti-His-tag antibody. “-” represents the un-induced control group, “+” represents the induced group.
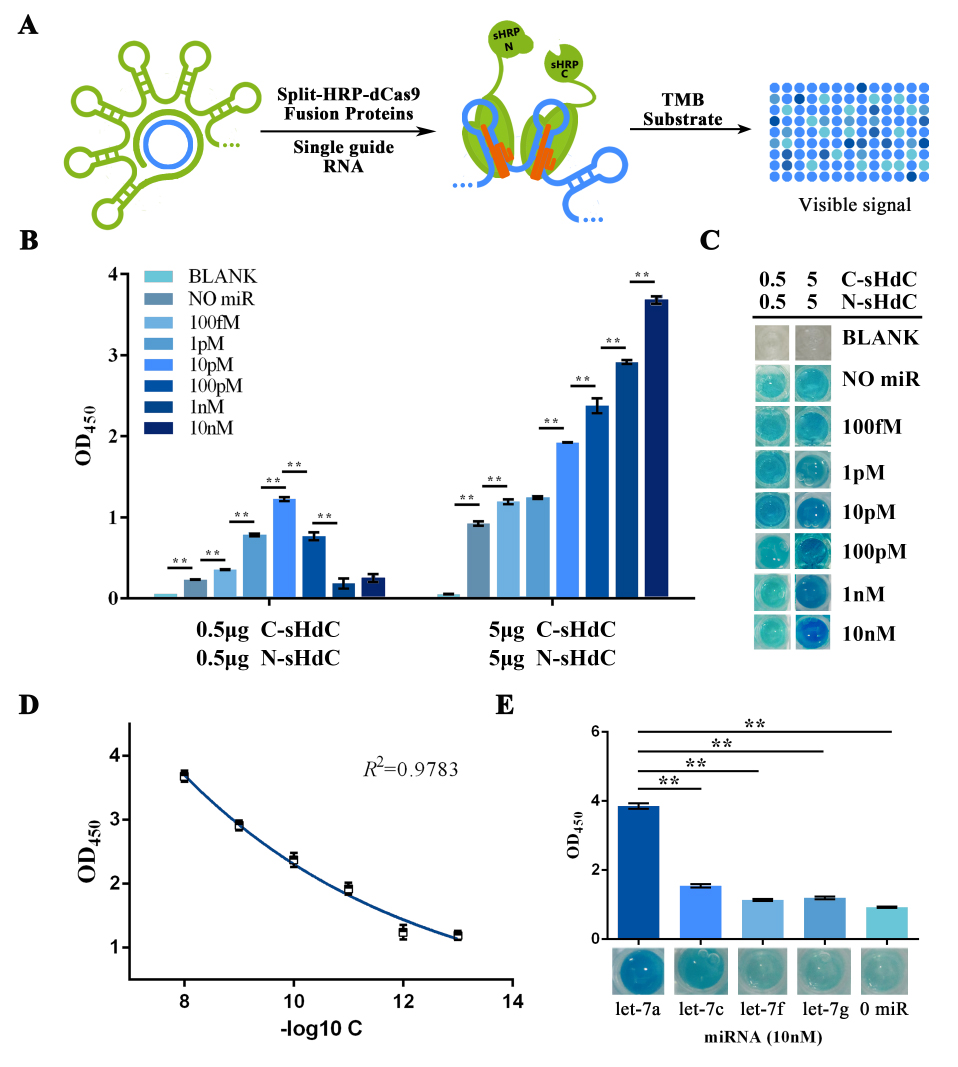
Once purified, fusion proteins were subsequently used for the dCas9 binding process together with an in vitro expressed sgRNA. TMB substrate was used to test the HRP activity (Figure 4A). Through which, the protein concentration was optimized (Figure 4B) and the specificity and sensitivity of our scheme was examed and validated. Thus, the basic concept of our design was proofed (Figure 4C, 4D, 4E).
Figure 4. HRP activity assay evaluating the sensitivity and specificity of the visualization process of RCA-output signal amplified from water dissolved miRNAs.
(A) Schematic representation of the visualization and further amplification of RCA outputs. The split-HRP-dCas9 fusion protein could bind with the RCA product with the assistance of single-guide RNA, thus shorten the distance of split-HRP subunits and reinstate the HRP activity. (B) Plots of OD450 on different concentration of let-7a against various protein concentrations. In such assay, 0.16M sulfuric acid was added into the reaction solution to stop the reaction and forming productions with the maximum absorbance on 450nm. (C) Images showed the visualized signal output through different amount of let-7a and various concentration of fusion protein before adding the sulfuric acid. The abbreviation “[C-sHdC]” represents the sHRP-C-dCas9 fusion protein, and “[N-sHdC]” represents the sHRP-N-dCas9 fusion protein. (D) Plot of OD450 against negative logarithm of let-7a concentration. . (E) Determination of the specificity of the whole workflow under different miRNAs of let-7a, let-7c (single-mismatch), let-7f (single-mismatch) or let-7g (double-mismatch). Images showed below was the visualized output signal of different initial input miRNA respectively before adding the stop solution. All these experiments were run in three parallel reactions, and the error bars were obtained from at least three independent experiments. The 7% human serum used in the experiment was the mixture of serum samples from 50 healthy volunteers. The squared correlation coefficient (R2) was analyzed by Graphpad Prism 6.0. ** p<0.01.
Modeling
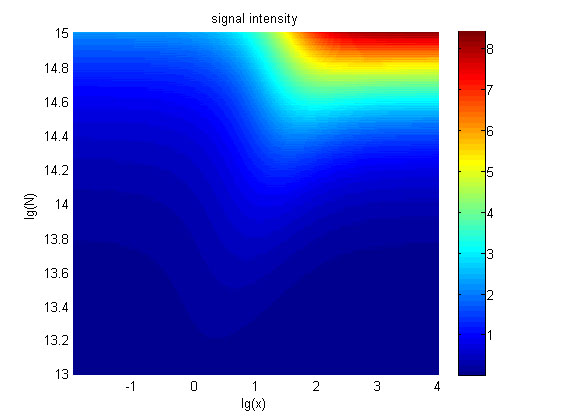
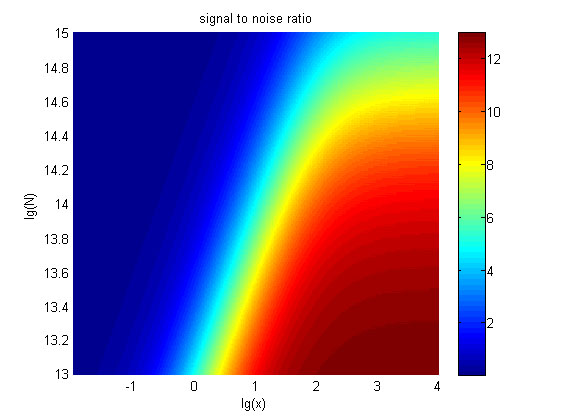
This model was created to evaluate the effectiveness of initial design and offer guidelines about how the system can (or must) be improved. The relationships between the signal to noise ratio (SNR), the signal intensity respectively and the concentration of miRNA under different additional amount of fusion proteins were discussed mainly in this model. For such matter, theoretical calculation and experimental results were well integrated and a brilliant probability model was introduced.
The relationships were obtained and shown below.
Figure 5. The signal intensity (OD450) Three-dimensional map of signal intensity (OD450) against miRNA concentration(pM) and additional amount of fusion proteins.
The relationship between the concentration of miRNA and the signal intensity was monotonous when the value of the molecule number of the fusion proteins was relatively large. While the relationship did not hold when the value of the molecule number of the fusion proteins was relatively small. And the signal intensity increased as the value of the molecule number of the fusion proteins increases.
Figure 6. The result of SNR Three-dimensional map of signal to noise ratio against miRNA concentration (pM) and additional amount of fusion proteins.
The signal-to-noise ratio decreased as the value of the molecule number of the fusion proteins increased.
The detailed results could be found on the RESULT PAGE.
Reference
1 Jeong, H. C. et al. Aberrant expression of let-7a miRNA in the blood of non-small cell lung cancer patients. Mol Med Rep 4, 383-387, doi:10.3892/mmr.2011.430 (2011).

