Results
Wet Lab
Preparing and selecting the
dumbbell probes
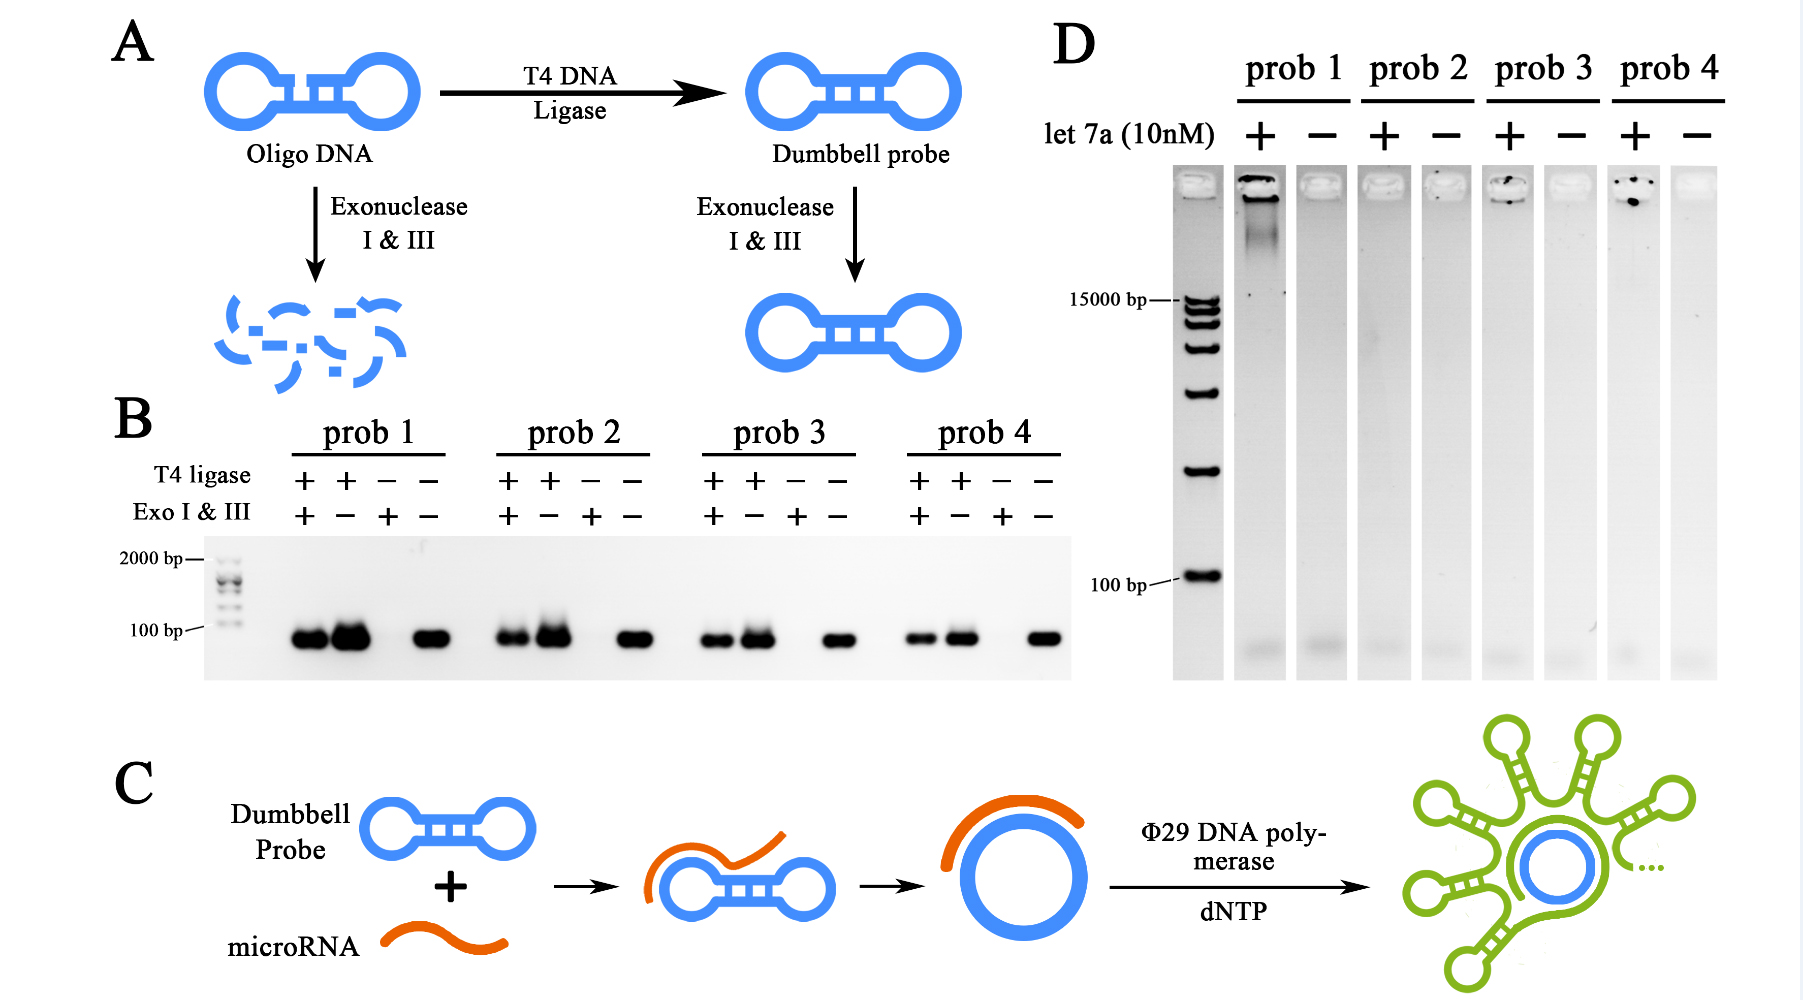
To amplify the initial let-7a input signal, a miRNA initiated rolling circle amplification (RCA) reaction was designed to be performed. Thus requires a functional dumbbell shaped probe for the initial interaction with target miRNAs. For such matters, four dumbbell shaped probes were designed, prepared and then tested as the first steps of our project. To prepare the functional probes, 5’ phosphate oligo DNAs were synthesized by company (Takara), after rehydrated in DEPC-treated water, oligo DNAs were then processed by T4 DNA Ligase to transform the linearized structure into a sealed one. The remaining un-sealed ssDNA and dsDNA were then digested by Exonuclease I and III, thus the sealed and dumbbell shaped probes could be purified (Figure 1A). The ligated and purified product were then verified through 2% agarose gel electrophoresis (Figure 1B). The results showed that Exonuclease treated groups remained strong probe signals similar to Exonuclease untreated ones after ligation. As control, the groups without T4 DNA ligase treatment after exposed to Exonuclease present no DNA signal. Thus indicated a high ligation efficiency of T4 DNA ligase treatment and effective purification capacity of Exonuclease treatment for dumbbell probe formation. Meanwhile, we could conclude that relatively pure dumbbell shaped probes were obtained. Those probes were then implemented into a 2-hour RCA reactions initiated by 10nM let-7a miRNA obtained from in vitro expression (Figure 1C). The result of RCA reaction was then demonstrated through a 0.7% agarose gel electrophoresis (Figure 1D). As is shown in the electrophoresis, RCA productions generated by a 2-hour reaction were too large to move through the agarose gel, which then, shown as being clogged in the well. Gel results also showed that prob1, prob3 and prob4 were all functional for the RCA reaction, among which, prob1 showed the strongest ability for such reaction. Prob1 was then selected as the probe in the further experiment.
Figure 1. Preparation and selection of dumbbell probes.
(A)Schematic representation of the preparation of the probes, the dumbbell structure was formed from synthesized oligo DNA through T7 DNA ligase, the un-ligated ones were digested by Exonuclease I and III to avoid unspecified amplification. (B) Agarose gel electrophoresis showing the preparation results of four different probes. (C) Schematic representation of miRNA initiated Rolling Cycle Amplification (RCA). (D) Agarose gel electrophoresis showing the results of the RCA products from four different probes initiated by miRNA let-7a. The concentration of target miRNA was 10nM. The RCA reactions were performed for 2 hours. All gel images were color-inverted to gain a better contrast.
Verifying and assessing RCA
sensitivity and specificity
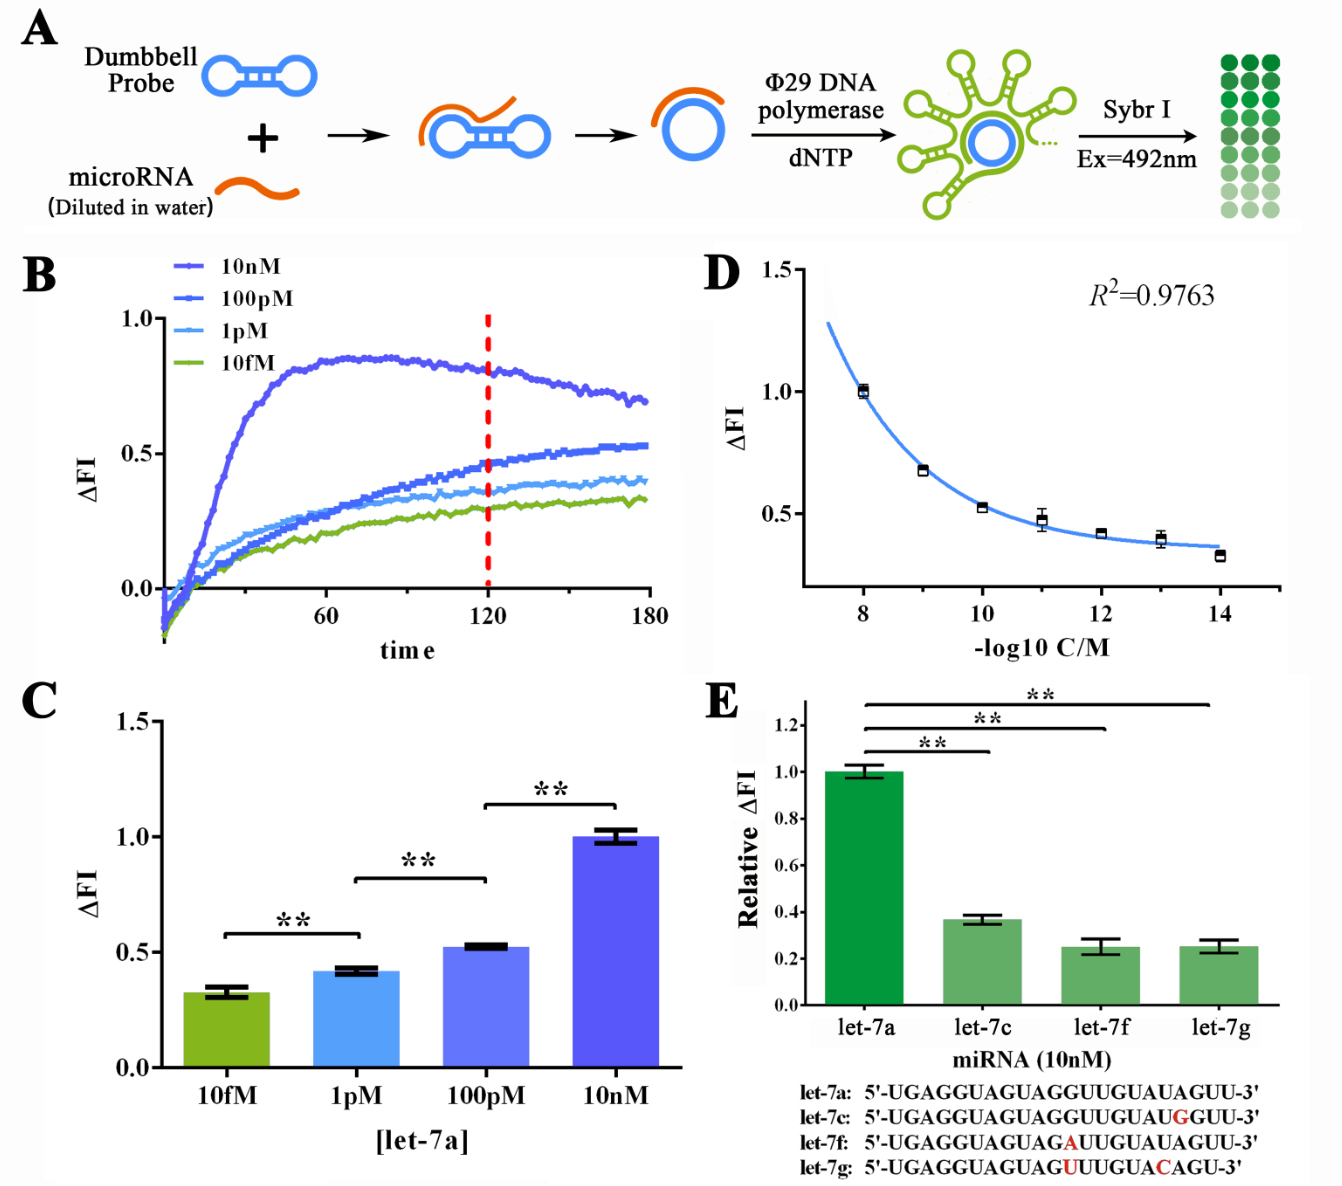
For the primary verification and assessment of the sensitivity and specificity of the miRNA initiated RCA reaction, let-7a, as the target miRNA was DISSOLVED IN DEPC-TREATED WATER for various concentrations to determine the sensitivity of RCA reaction (Figure 2A). The specificity of RCA reaction was assessed through four different miRNAs in let-7 family, namely let-7c (one base mismatch against let-7a), let-7f (one base mismatch), and let-7g (two bases mismatches), and fluorescent dye Sybr I was used to monitor the amount of the dsDNA in the reaction solution. Sybr I can bind specifically with the dsDNA and produce 515nm fluorescent when excited by 485nm light once bound. Thus made the real-time detection of dsDNA concentration in reaction solution possible. Building on this, real-time fluorescent assay was performed to monitor the reaction process under different input concentration of let-7a to determine the best reaction time (Figure 2B). Results showed that under 120-min treatment, significant difference can be shown among 10nM, 100pM, 1pM and 10fM of let-7a while the lowest Fluorescent Intensity Variation (ΔFI) level remained positive (Figure 2C). After that, we then performed RCA reaction under more various concentrations of let-7a to determine the detailed relationship between miRNA concentration and ΔFI. After plotting the ΔFI data against minus logarithm of let-7a concentration, an exponential curve could be fitted with a squared correlation coefficient (R2) of 0.9763. THE SENSITIVITY OF SUCH METHOD WAS ALSO ESTIMATED TO BE UNDER 1FM (3 times higher than the standard division of the blank group). As for the specificity of RCA reaction in water-dissolved samples, a 2-hour RCA reaction was performed under the 10nM input concentration of let-7a, let-7c, let-7f and let-7g solutions. Results showed an at least 5-time difference among let-7a group against other miRNAs (Figure 2D), indicating A BRILLIANT SPECIFICITY OF RCA REACTION.
Figure 2. Evaluation of the sensitivity and specificity of RCA reactions initiated by water-dissolved miRNAs by Sybr I fluorescent assay.
(A) Schematic representation of the Sybr I fluorescent assay for RCA reactions for the RCA reaction initiated by water-dissolved miRNAs. (B) Real-time fluorescent measurements for RCA process, carried out at 10fM, 1pM, 100 pM, and 10nM of let-7a. The results on 120-min time point was labeled as such time duration was used for following experiments. (C) Plot of fluorescent intensity variation against let-7a concentration. (D) Plot of fluorescent intensity variation against negative logarithm of let-7a concentration. (E) Determination of the specificity of RCA reaction initiated by collaboration of designed probe and let-7a, let-7c (single-mismatch), let-7f (single-mismatch) or let-7g (double-mismatch). The bases marked red in the sequences of tested miRNAs displayed below are mismatched bases against let-7a. The concentration used in such assay was 10nM. The excitation wavelength was 495nm, the emission wavelength was 515nm. Fluorescence intensity variation was calculated by subtracting the fluorescent intensity of the blank group. For the calculation of relative fluorescence intensity variation, the let-7a group was set arbitrarily at 1.0, and the levels of the other groups were adjusted correspondingly. All these experiments were run in three parallel reactions, and the error bars were obtained from at least three independent experiments. The squared correlation coefficient (R2) was analyzed by Graphpad Prism 6.0. ** p<0.01.
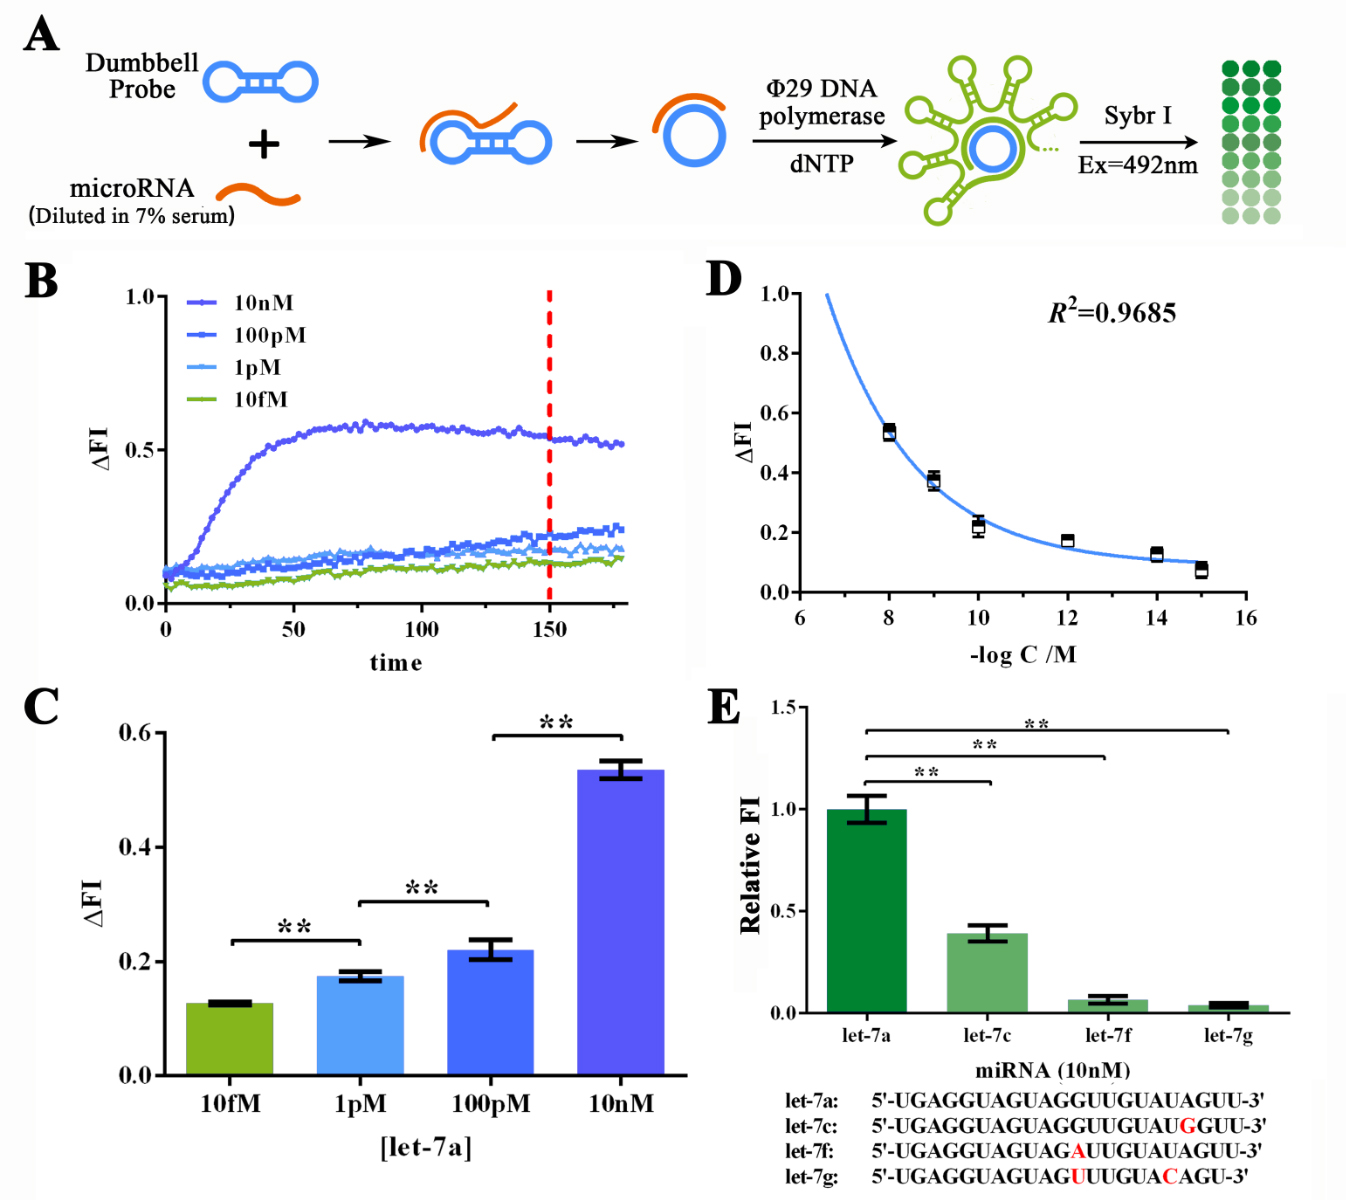
To further determine if such great sensitivity and specificity could be maintained working on MORE COMPLICATED SAMPLES SUCH AS SERUM, we then dissolved let-7a in 7% human serum for various concentrations to determine the sensitivity of RCA reaction under such condition (Figure 3A). The human serum was collected and mixed from serum samples of 50 different healthy volunteers under their consent. Similarly, real-time fluorescence assay was performed and 150-min reaction time was determined to be good enough since the difference among different let-7a concentration was significant enough (Figure 3B and 3C). After expanded into more groups with various let-7a concentrations, data points on ΔFI vs. -log[let-7a] plot could also be fitted by an exponential curve with a R2 of 0.9685 (Figure 3D). Thus the RCA reaction has a HIGH SENSITIVITY to the low concentration of miRNA. Specificity evaluation assay was also performed under similar methods as mentioned above, which then, affirmed the HIGH SPECIFICITY of RCA reaction even under close-to-field input samples.
Figure 3. Evaluation of the sensitivity and specificity of RCA reactions initiated by serum-dissolved miRNAs by Sybr I fluorescent assay.
((A) Schematic representation of the Sybr I fluorescent assay for RCA reactions for the RCA reaction initiated by serum-dissolved miRNAs. (B) Real-time fluorescent measurements for RCA process, carried out at 10fM, 1pM, 100 pM, and 10nM of let-7a. The results on 120-min time point was labeled as such time duration was used for following experiments. (C) Plot of fluorescent intensity variation against let-7a concentration. (D) Plot of fluorescent intensity variation against negative logarithm of let-7a concentration. (E) Determination of the specificity of RCA reaction initiated by collaboration of designed probe and let-7a, let-7c (single-mismatch), let-7f (single-mismatch) or let-7g (double-mismatch). The bases marked red in the sequences of tested miRNAs displayed below are mismatched bases against let-7a. The concentration used in such assay was 10nM. MiRNAs were dissolved and diluted into various concentrations in 7% human serum, which was the mixture of serum samples from 50 healthy volunteers. The excitation wavelength was 495nm, the emission wavelength was 515nm. Fluorescence intensity variation was calculated by subtracting the fluorescent intensity of the blank group. For the calculation of relative fluorescence intensity variation, the let-7a group was set arbitrarily at 1.0, and the levels of the other groups were adjusted correspondingly. All these experiments were run in three parallel reactions, and the error bars were obtained from at least three independent experiments. The squared correlation coefficient (R2) was analyzed by Graphpad Prism 6.0. ** p<0.01.
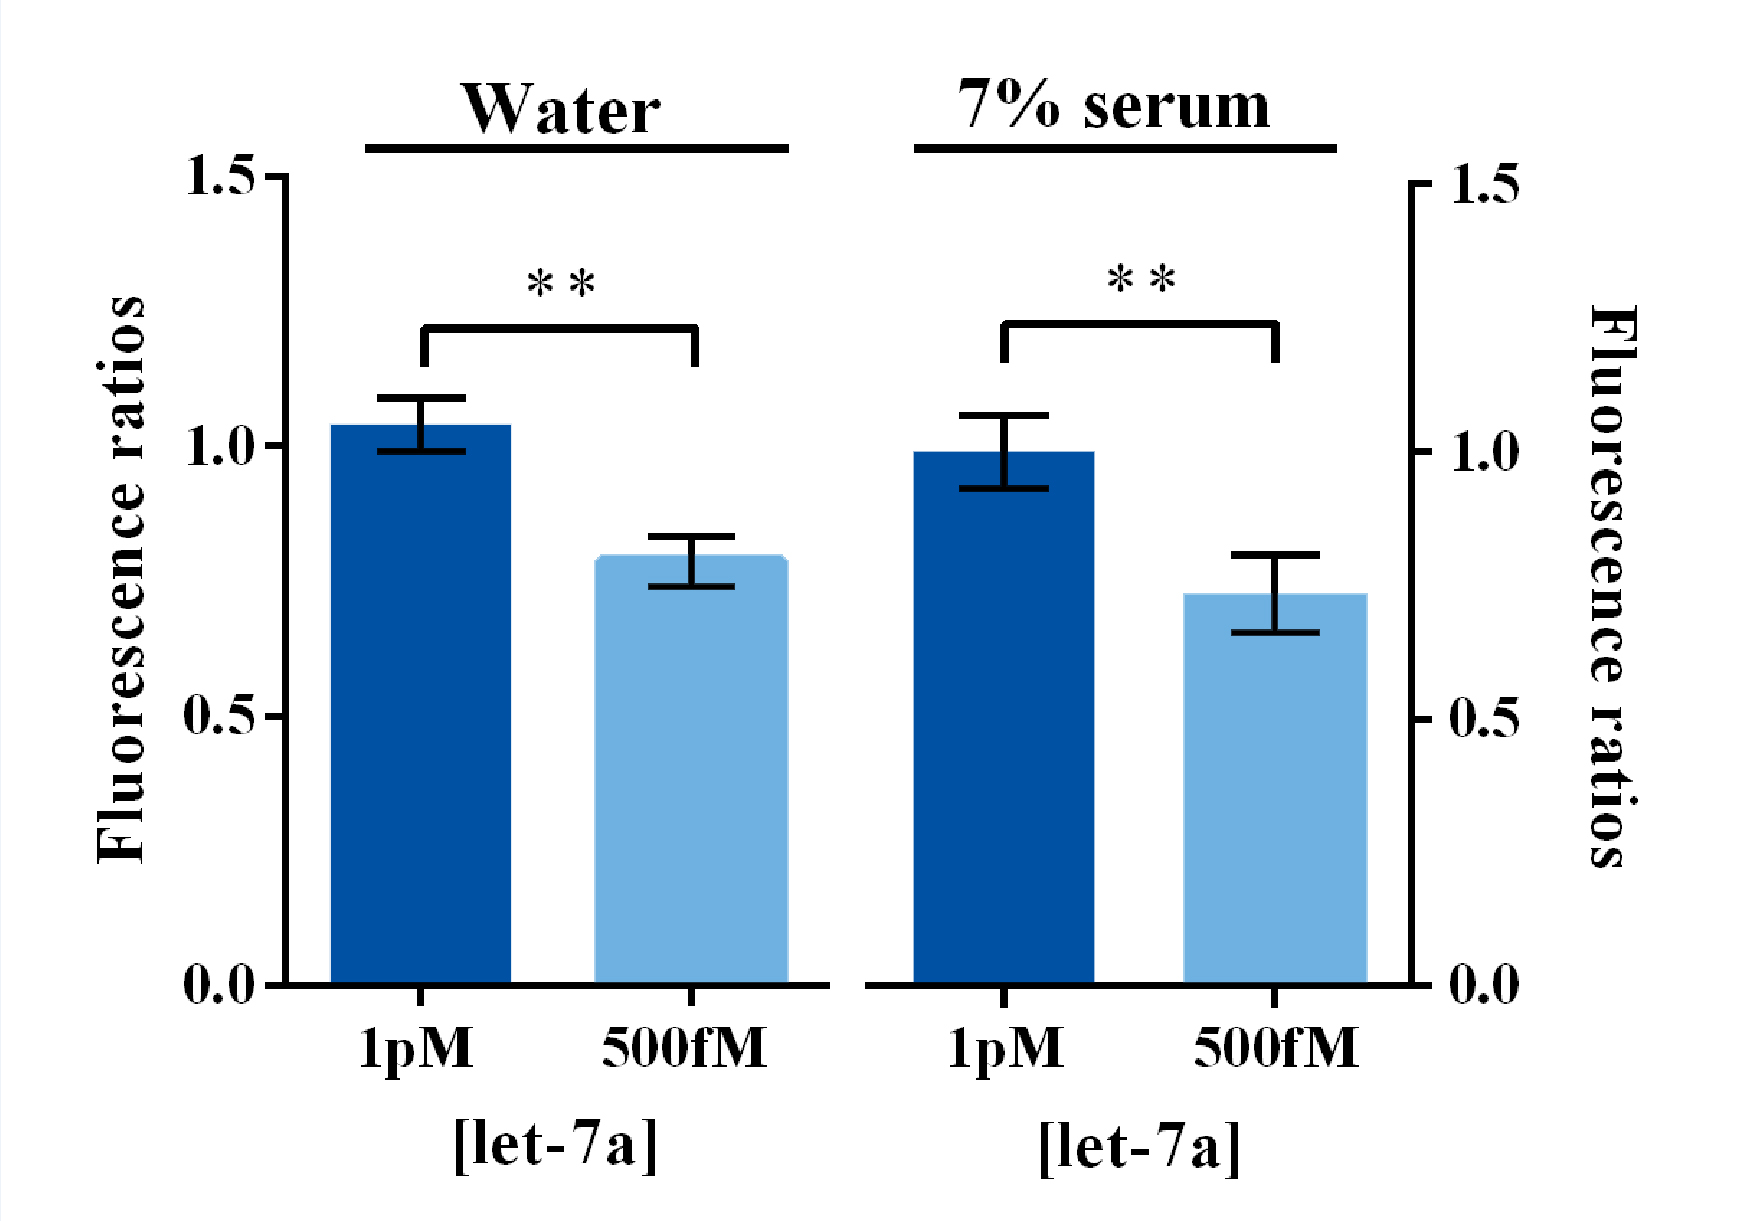
Considering the concentration of let7 family members in serum were around hundred fM levels according to the previous literature1, we analyzed the significance of fluorescence signal divergence between 500 fM and 1 pM of let7a dissolved both in DEPC-treated water and in 7% human serum. Results demonstrated that the fluorescence signal of 1 pM group were significantly higher than that of 500 fM group both in these two dissolved conditions (Figure 4). Therefore, we could believe that this method is capable of monitoring the variation of serum let7a concentration during cancer development.
Figure 4. Evaluation of fluorescence signal divergence significance under clinical concentrations of miRNA dissolved in water and serum by Sybr I fluorescent assay.
In such experiments, 500fM or 1pM of miRNAs were dissolved and diluted into various concentrations in water or 7% human serum, which was the mixture of serum samples from 50 healthy volunteers. Under Sybr I decoration, the amount of dsDNA could be evaluated under the excitation wavelength of 495nm and the emission wavelength of 515nm. Fluorescence intensity variation was calculated by subtracting the fluorescent intensity of the blank group. For the calculation of fluorescence ratio, the 1pM group was set arbitrarily at 1.0, and the levels of the other groups were adjusted correspondingly. All these experiments were run in three parallel reactions, and the error bars were obtained from at least three independent experiments. ** p<0.01.
Moving toward a visualized miRNA
detecting method
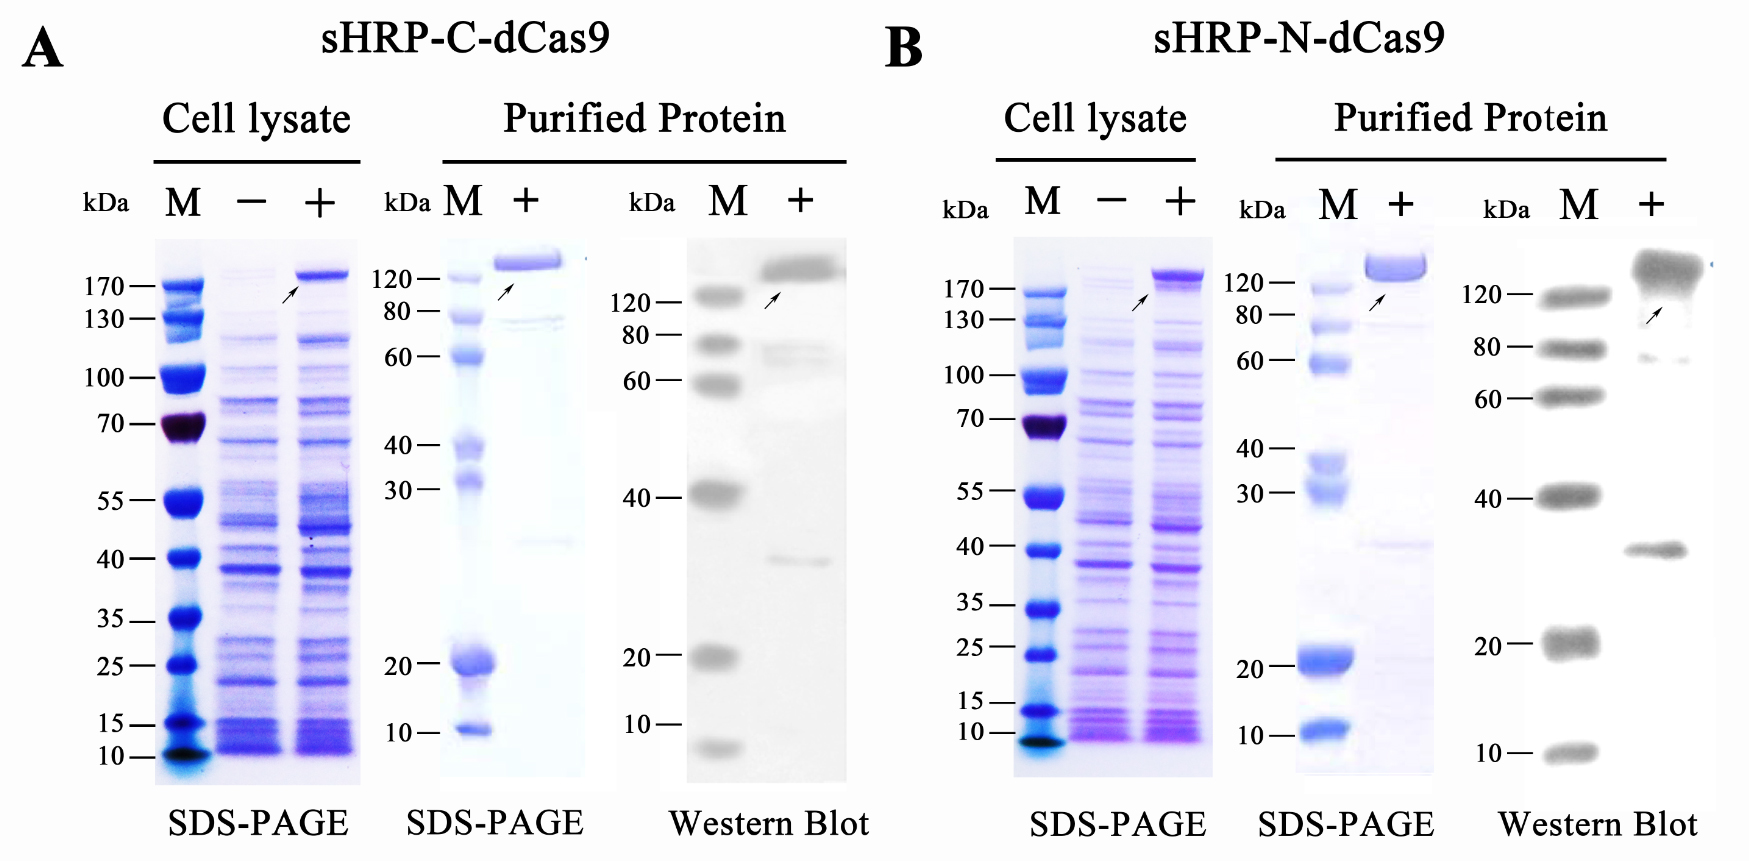
To move our experiments toward conditions with relatively low tech-condition, we mainly focused on the VISUALIZATION and FURTHER AMPLIFICATION of RCA outputs. For such matters, a single guide-RNA mediated CRISPR-Cas9 system and a split-HRP reporting system was then introduced since the proper designed sgRNA-dCas9 system could provide a relatively solid binding among RCA production and dCas9 protein and split-HRP reporter could robustly amplify and visualize the upstream signal. Thus, fusion proteins containing split-HRP fragments and dCas9 protein, namely sHRP-C-dCas9 and sHRP-N-dCas9 were designed and cloned onto expression vector. Then, the plasmid was sequencing verified and transformed into the E.coli BL21 (DE3) competent cells. After a overnight culture with (or without, as control group) 0.5mM IPTG induction, cells were collected and lysed by high pressure homogenizer. Subsequent purification was performed by nickel-nitrilotriacetic acid agarose affinity chromatography according to the standard protocol. As examined by SDS-PAGE and Western blots (probed with an anti-His-tag antibody), both of these proteins were successfully expressed and purified as a high degree of purity up to 90% (Figure 5).
Figure 5. Prokaryotic expression and protein purification of split-HRP-dCas9 fusion proteins.
(A) Expression and purification of sHRP-C-dCas9 protein. (B) Expression and purification of sHRP-C-dCas9 protein. Western blots were probed with an anti-His-tag antibody. “-” represents the un-induced control group, “+” represents the induced group.
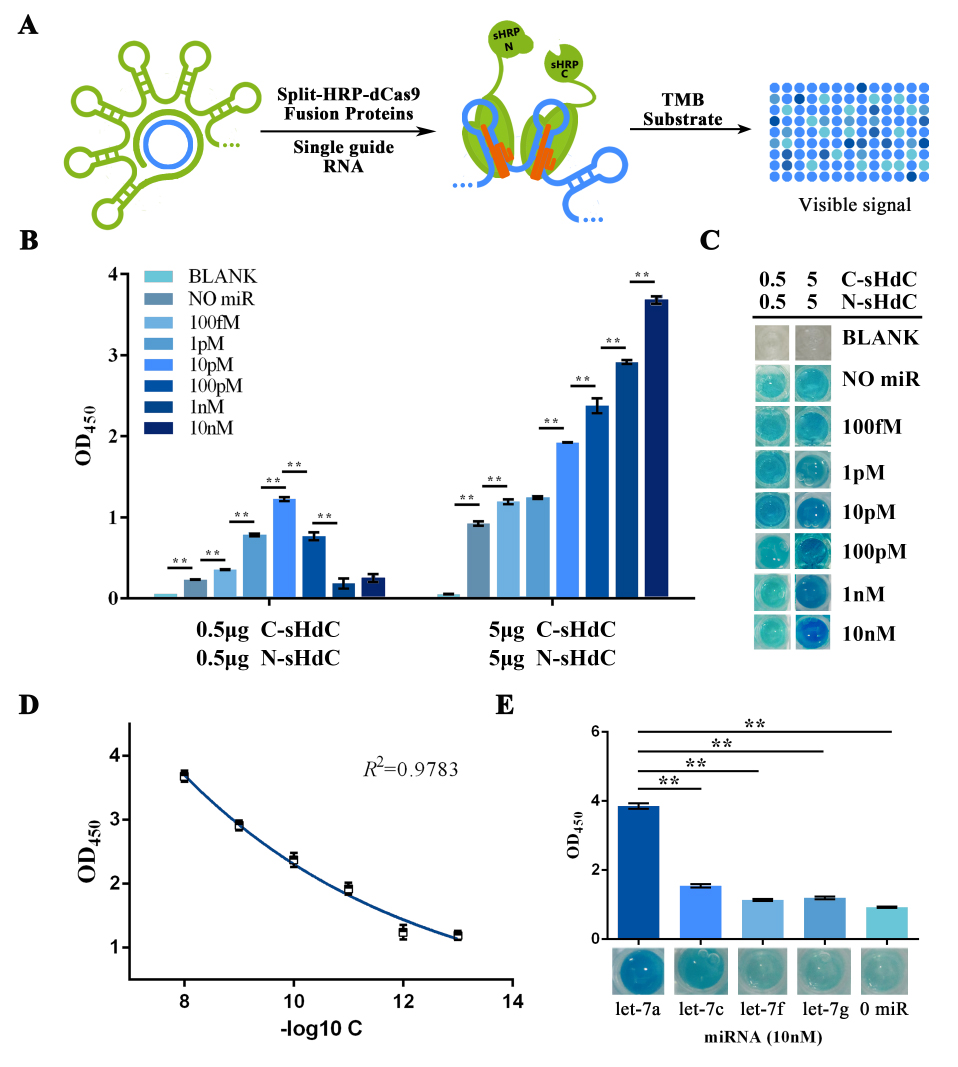
Once gained purified fusion proteins, HRP activity assay was performed trying to visualize and signal-augment previous gained RCA output (Figure 6A). In such assay, TMB was used as substrate to form blue-colored TMB diamine as a visible signal. This reaction was then halted by addition of 0.16M sulfuric acid and turned the solution into yellow with maximum absorbance at 450nm. Also, different concentrations of fusion protein were tested to further improving the system effectiveness.
Similarly, the RCA result collected from the group started with a water-dissolved miRNA input was tested as a proof of concept. The OD450 results showed a significant variation among groups with different protein concentration, whereas the group with 5μg showed an outcome with better significance among groups with different miRNA input concentration (Figure 6B). Images taken right before adding the sulfuric acid also gave a clue that visual difference could be obtained among different amount of input microRNAs under all tested protein concentrations, and 5μg of protein was then proven to be the optimal among two protein concentrations tested. After plotting the ΔOD 450 data against minus logarithm of let-7a concentration, an exponential curve could be fitted with a squared correlation coefficient (R2) of 0.9783 (Figure 6D). At the meantime, results also showed a significant variation among groups with different type of input miRNA (Figure 6E), which implied a great specificity of such scheme.
Figure 6. HRP activity assay evaluating the sensitivity and specificity of the visualization process of RCA-output signal amplified from water dissolved miRNAs.
(A) Schematic representation of the visualization and further amplification of RCA outputs. The split-HRP-dCas9 fusion protein could bind with the RCA product with the assistance of single-guide RNA, thus shorten the distance of split-HRP subunits and reinstate the HRP activity. (B) Plots of OD450 on different concentration of let-7a against various protein concentrations. In such assay, 0.16M sulfuric acid was added into the reaction solution to stop the reaction and forming productions with the maximum absorbance on 450nm. (C) Images showed the visualized signal output through different amount of let-7a and various concentration of fusion protein before adding the sulfuric acid. The abbreviation “[C-sHdC]” represents the sHRP-C-dCas9 fusion protein, and “[N-sHdC]” represents the sHRP-N-dCas9 fusion protein. (D) Plot of OD450 against negative logarithm of let-7a concentration. . (E) Determination of the specificity of the whole workflow under different miRNAs of let-7a, let-7c (single-mismatch), let-7f (single-mismatch) or let-7g (double-mismatch). Images showed below was the visualized output signal of different initial input miRNA respectively before adding the stop solution. All these experiments were run in three parallel reactions, and the error bars were obtained from at least three independent experiments. The 7% human serum used in the experiment was the mixture of serum samples from 50 healthy volunteers. The squared correlation coefficient (R2) was analyzed by Graphpad Prism 6.0. ** p<0.01.
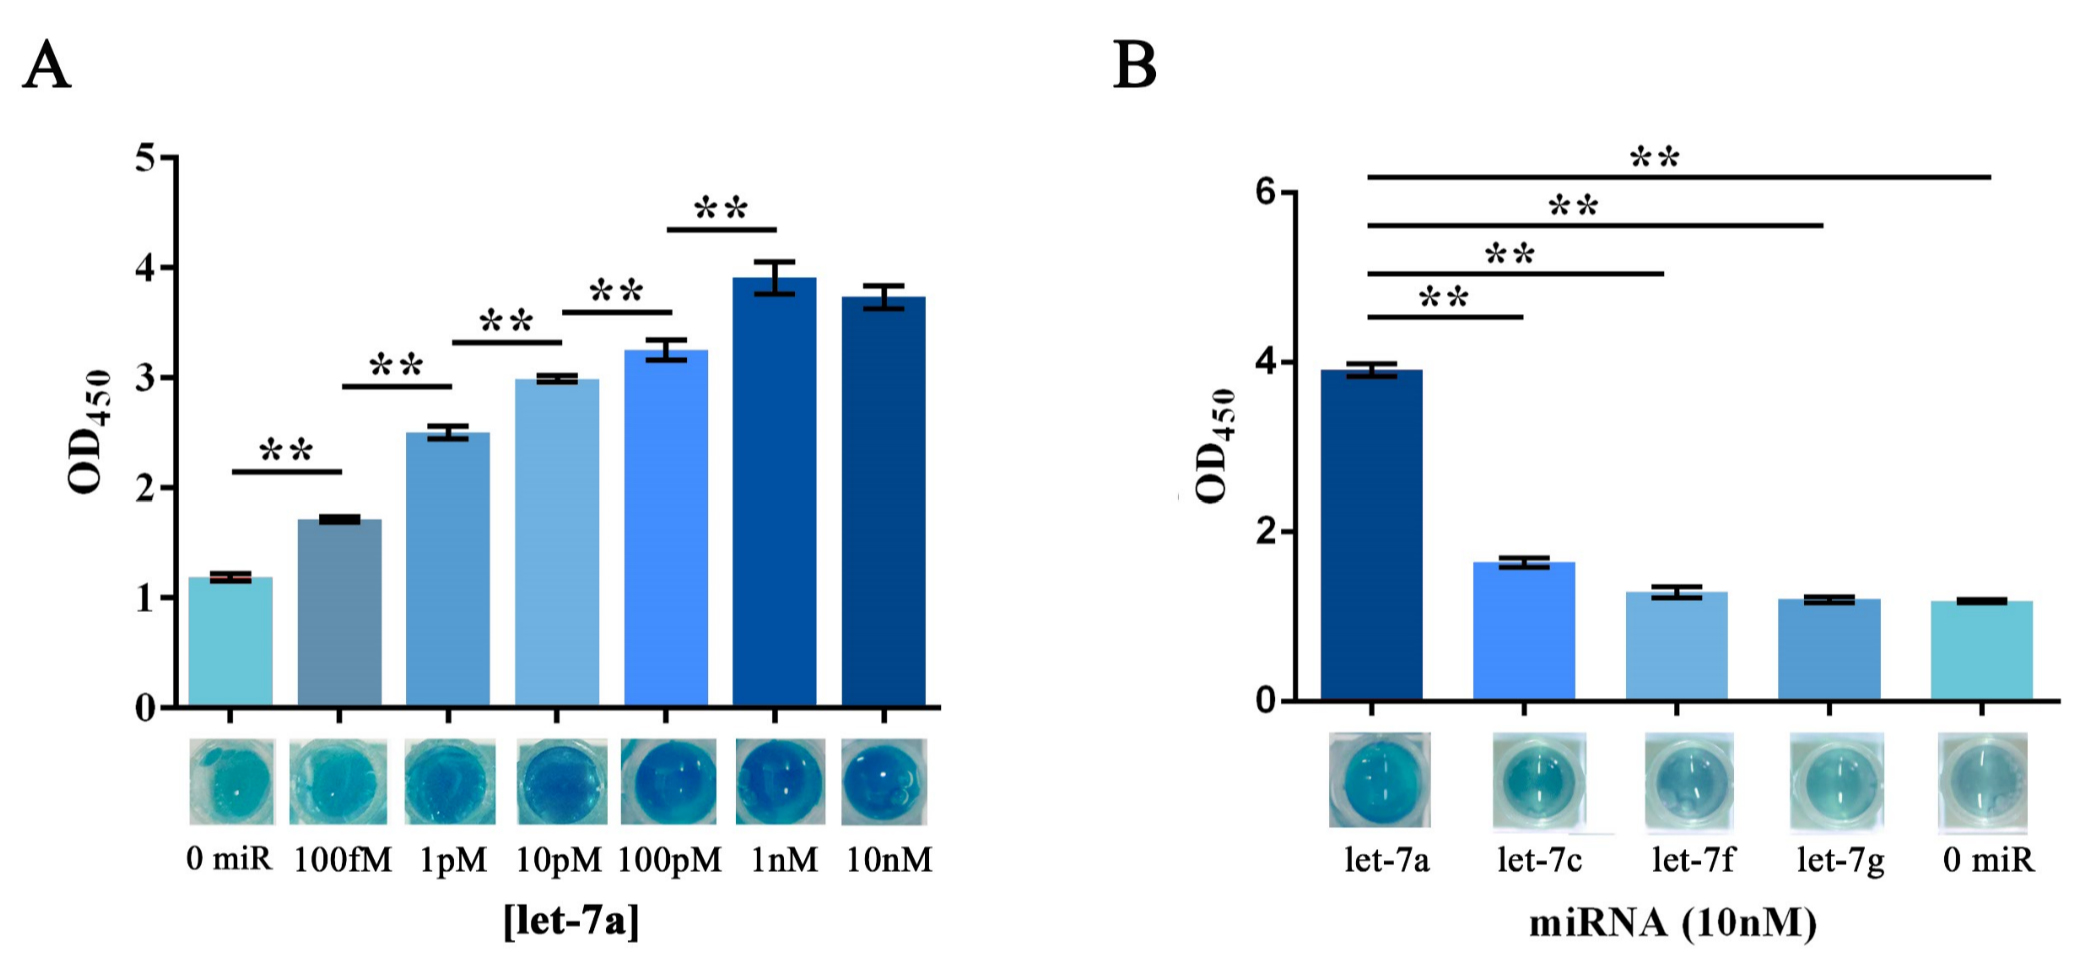
When working with samples collected from the group started with a serum-dissolved miRNA input, similar trends to the water-dissolved ones were shown on OD450 results and visual/imaging analyzation (Figure 7A, B). Which then, indicated that the visualization and further amplification of RCA outputs COULD BE ACHIEVED with a brilliant sensitivity and specificity through the single guide-RNA mediated CRISPR-Cas9 system and a split-HRP reporting system in a CLOSE-TO-FIELD CONDITION.
Figure 7. HRP activity assay evaluating the sensitivity and specificity of the visualization process of RCA-output signal amplified from 7% serum dissolved miRNAs.
(A) Plots of OD450 against different concentration of initial input let-7a. In such assay, 0.16M sulfuric acid was added into the reaction solution to stop the reaction and forming productions with the maximum absorbance on 450nm. Images showed below was the visualized output signal of different concentration of initial input let-7a respectively before adding the stop solution. (B) Determination of the specificity of the whole workflow under different serum dissolved miRNAs of let-7a, let-7c (single-mismatch), let-7f (single-mismatch) or let-7g (double-mismatch). Images showed below was the visualized output signal of different initial input miRNA respectively before adding the stop solution. The 7% human serum used in the experiment was the mixture of serum samples from 50 healthy volunteers. All these experiments were run in three parallel reactions, and the error bars were obtained from at least three independent experiments. ** p<0.01.
Detection workflow validation with samples
from NSCLC patients
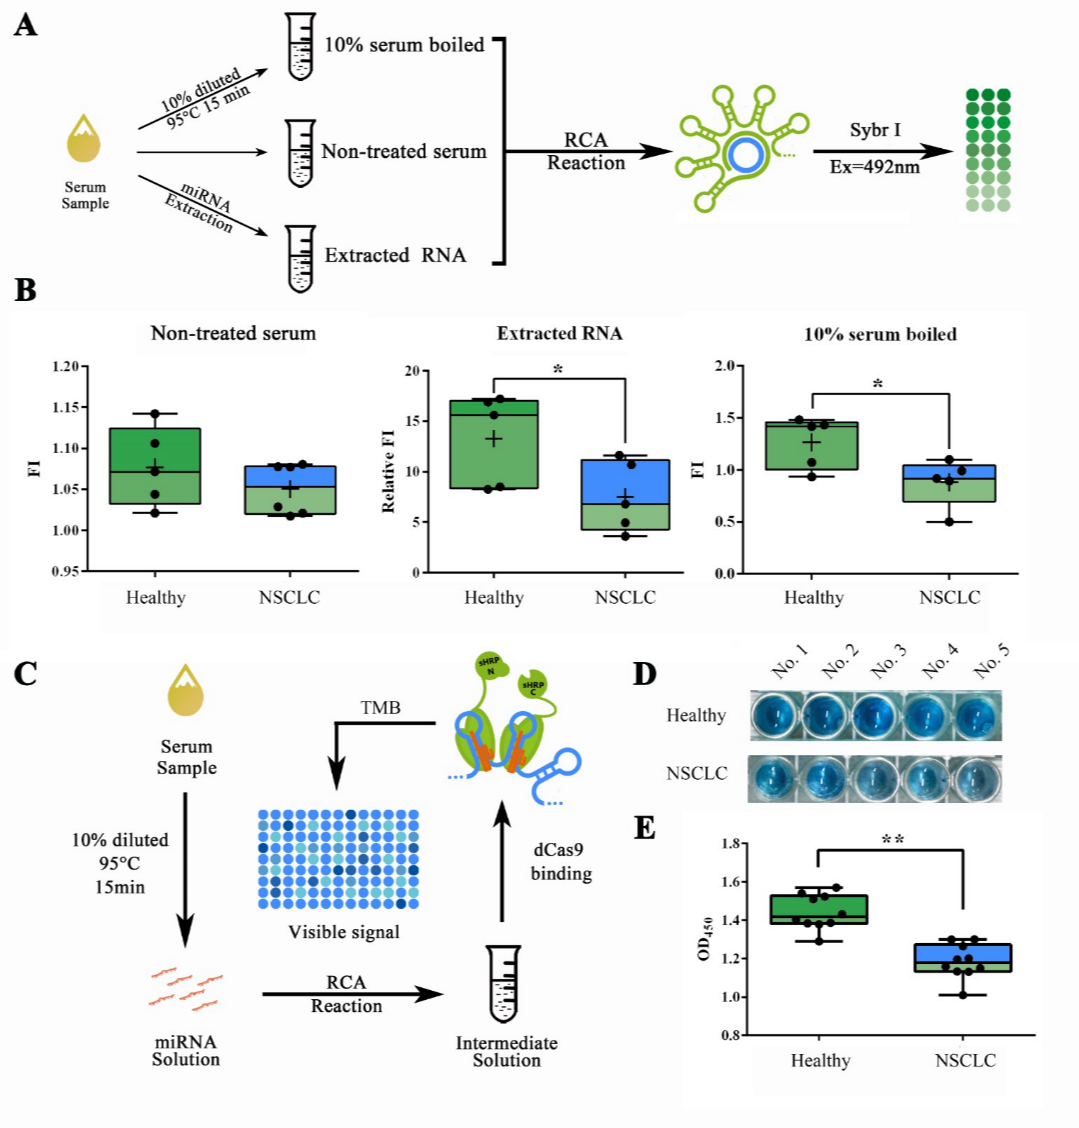
Building on previous experiments, we then sought to test our system in actual samples from patient serum. For such matters, we collected serum samples from 5 healthy volunteers and 5 volunteered non-small cell lung cancer (NSCLC) patients under their consent. Patient group was formed by two phase III patients, two phase IV patients and one phase V patient. To evaluate the optimal explosion effect of the serum miRNAs, which were previously reported to mainly exist as RNA-protein complex or even in exosomes, for further detection, we used different methods for the pre-treatment of serum samples (Figure 8A). RCA reaction followed by a Sybr I fluorescence assay revealed that both the approaches of serum RNA extraction by TRIzol LS and 10% serum boiled in 95℃ for 15 min can show a significantly lower concentration of let-7a in NSCLC patients compared to healthy people, and the latter is more convenient and effective (Figure 8B). Which then, made the low-cost, high efficient RNA extraction possible for field-ready detection of miRNAs in serum sample. The concentration difference of serum let-7a between NSCLC patients and healthy people determined by our method was corroborated to the previous literature reported 20%-60% decrease measured through qRT-PCR2.
Figure 8. Detection workflow validation with samples from NSCLC patients.
(A) Schematic representation of the pre-treatment process. (B) Sybr I fluorescent assay for RCA products amplified from serum samples with different pre-treatment process. Serum samples were collected from healthy volunteers and phase III, IV and V NSCLC patients. (C) Schematic representation of the complete visible detection process from serum sample. (D) Images showed the visualized signal output from samples collected in healthy people and NSCLC patients. (E) Plots of OD450 obtained through the complete detection workflow on samples of 10 healthy volunteers and 10 NSCLC patients. A stop solution containing 0.16M sulfuric acid was added so that the results could be quantified using OD450. All these experiments were run in three parallel reactions. * p<0.05.
Putting all previous mentioned methods together, and expand the sample mumbers into 20 (10 from healthy volunteers and 10 from NSCLC patients), the complete work flow for tube-based serum miRNA detection was tested with previously collected samples from healthy people and NSCLC patients. After a 200-min detection process, containing serum pre-treatment, RCA reaction, dCas9 binding and HRP activity assay (Figure 8C), results showed that observable color difference could be obtained among healthy people and NSCLC patients (Figure 8D). The OD450 result obtained after adding sulfuric acid also showed significant differences among two groups (Figure 8E).
Modeling
Obtaining the relationship
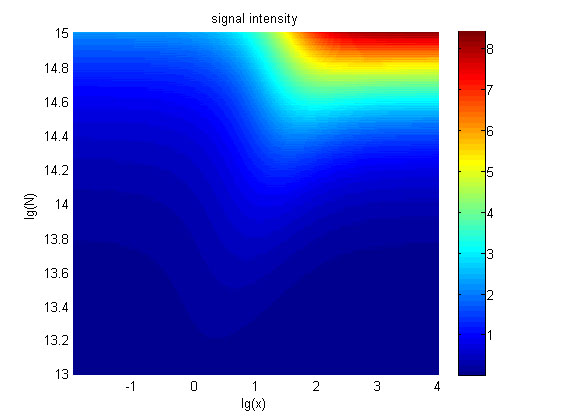
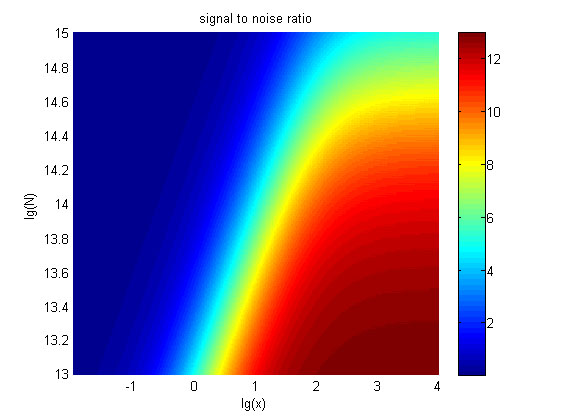
The relationships between the signal to noise ratio (SNR), the signal intensity respectively and the concentration of miRNA under different additional amount of fusion proteins were discussed mainly in this model. For such matter, theoretical calculation and experimental results were well integrated and a brilliant probability model was introduced. The relationships were obtained and shown below.
Figure 9. The signal intensity (OD450) Three-dimensional map of signal intensity (OD450) against miRNA concentration(pM) and additional amount of fusion proteins.
Figure 10. The result of SNR Three-dimensional map of signal to noise ratio against miRNA concentration (pM) and additional amount of fusion proteins.
Testing the model
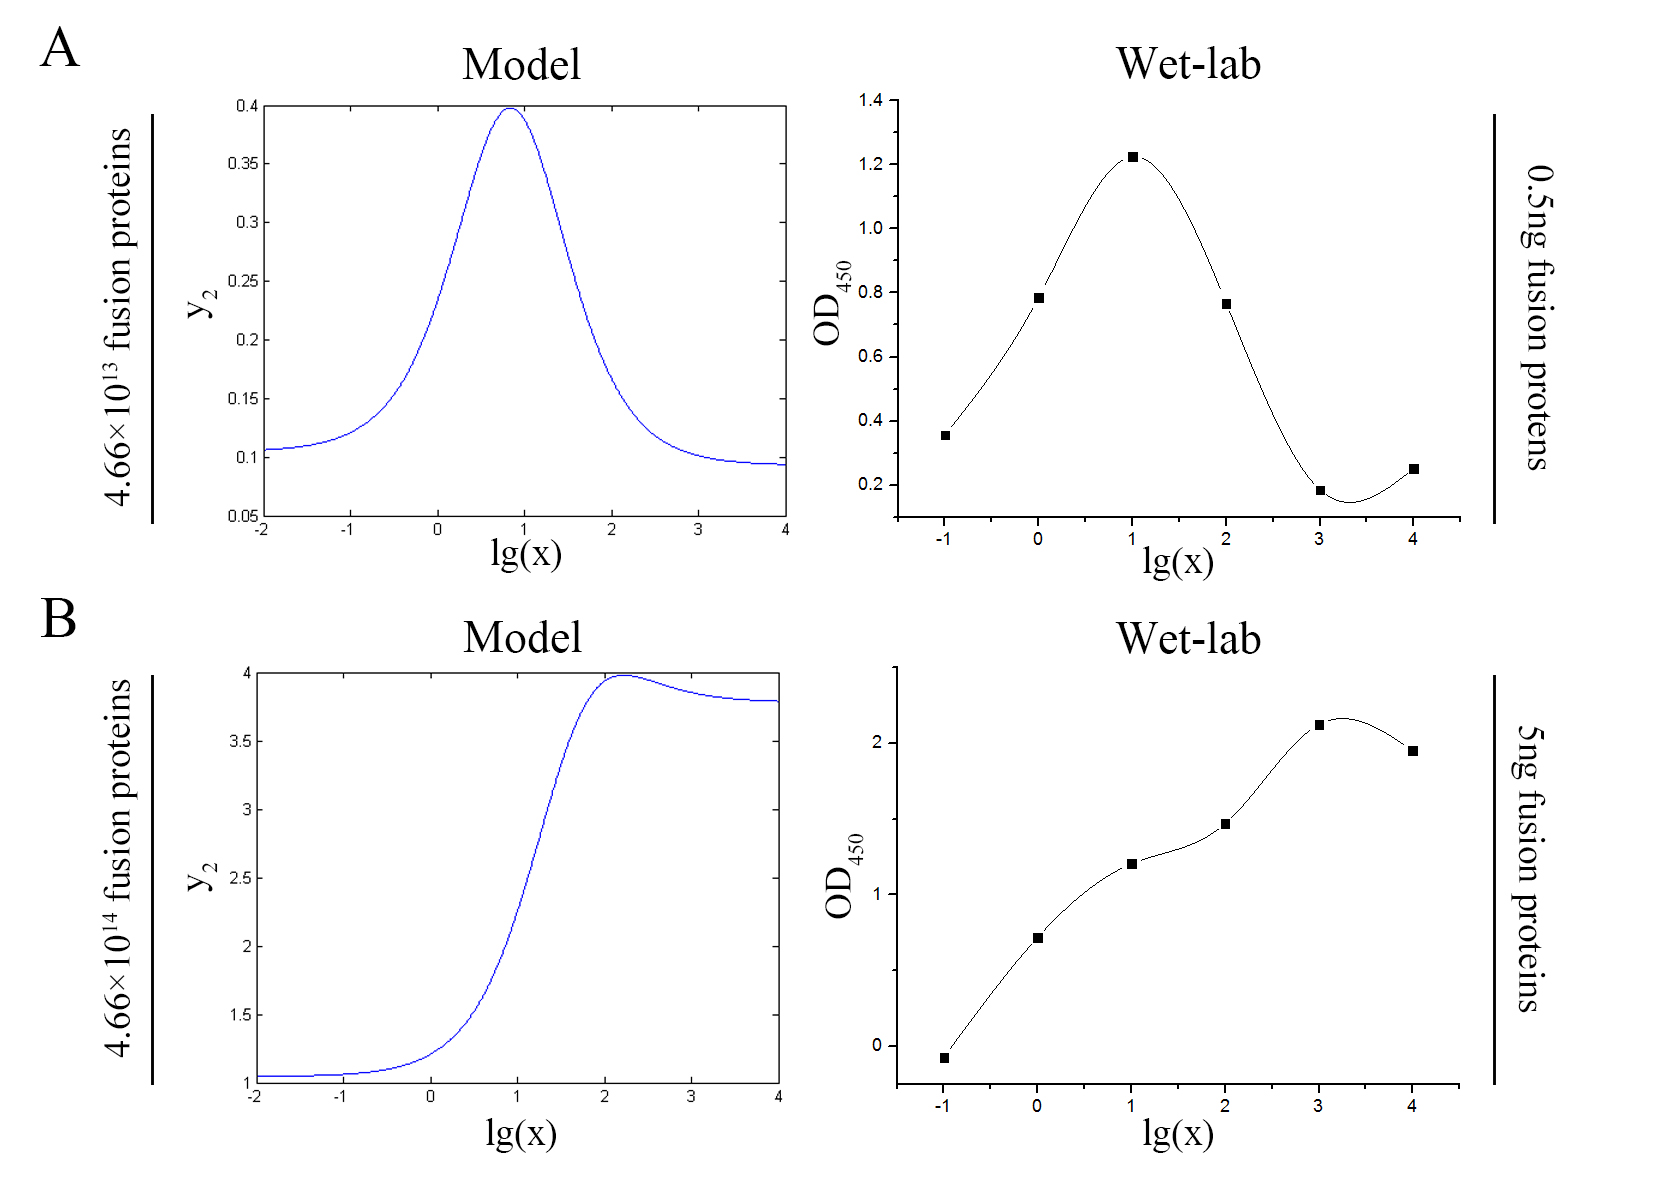
The accuracy of the model was tested by comparing the curves predicted by the model with those obtained from the experiment.
Figure 11. Test of model Plot of the signal intensity (OD450) against miRNA concentration (pM) predicted by the model and experimented by wet-lab. (A) The value of the molecule number of each fusion protein added to the system is set to be 4.66e+13. The mass of each fusion protein added to the system in wet-lab is 0.5 ng. (B) The value of the molecule number of each fusion protein added to the system is set to be 4.66e+14. The mass of each fusion protein added to the system in wet-lab is 5 ng.
The general trend of curves predicted by the model were in good agreement with the experimental results.
Optimizing our wet-lab protocol
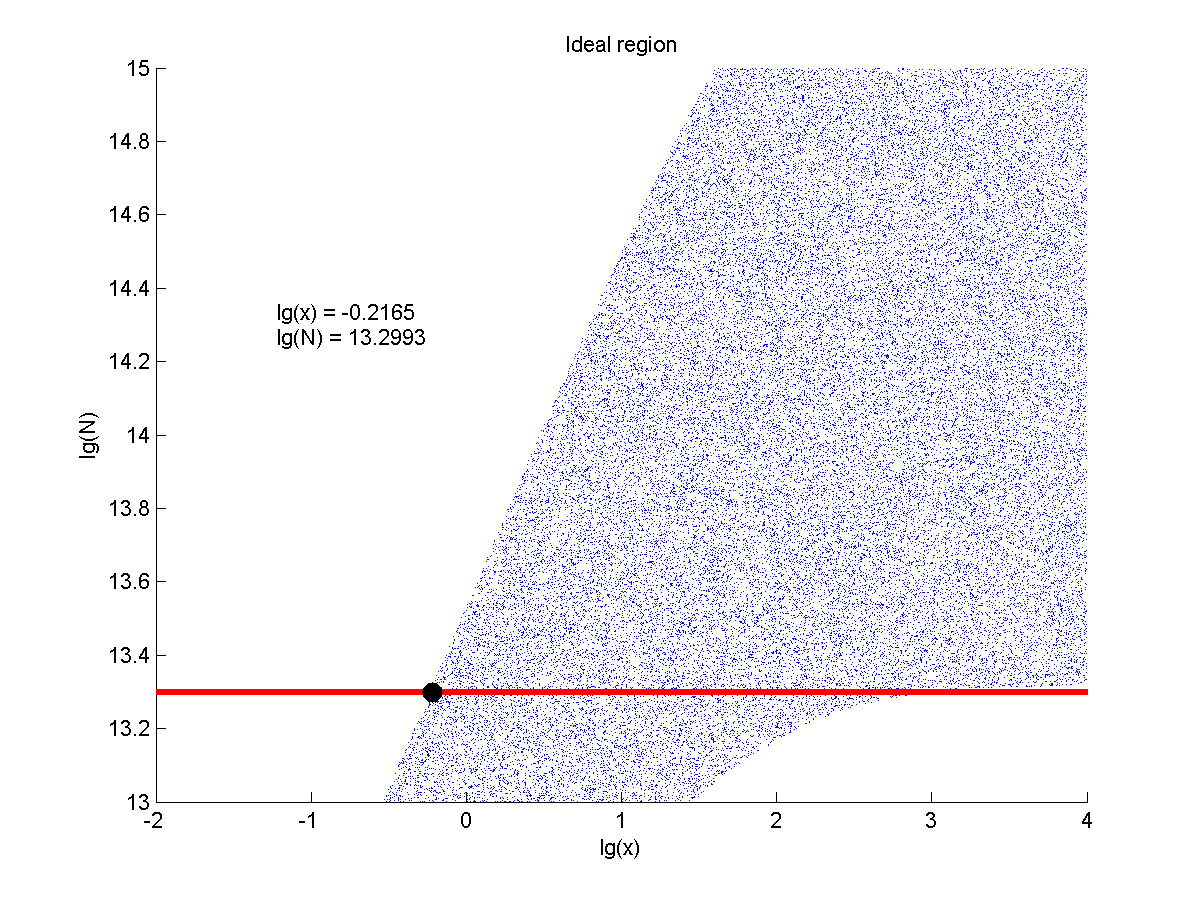
The situation when the value of signal intensity and SNR were both greater than two was considered to be conducive to signal detection. Thus an ideal region was obtained through calculation.
Figure 8. Ideal region Region of qualified logarithm of concentrations of miRNA (pM) and logarithm of the additional amount of fusion proteins.
The concentration range of miRNA that can be detected is maximum when we set the value of the molecule number of the fusion proteins to be e+13.3, building on which, our wet-lab protocol could be optimized in our future work.
Referense
1 Chen, X. et al. A combination of Let-7d, Let-7g and Let-7i serves as a stable reference for normalization of serum microRNAs. PLoS One 8, e79652, doi:10.1371/journal.pone.0079652 (2013).
2 Jeong, H. C. et al. Aberrant expression of let-7a miRNA in the blood of non-small cell lung cancer patients. Mol Med Rep 4, 383-387, doi:10.3892/mmr.2011.430 (2011).
Future Work
Since we have demonstrated the basic concept of our project. For now, most results came out to be optimistic, thus encouraged us to push our project forward in the future. Two main goals have been set for the future development of this project: to optimize the Noise-signal ratio, to enlarge the test scale, to extend its application, and to achieve a PAPER-BASED detection.

