Zhuchushu13 (Talk | contribs) |
Zhuchushu13 (Talk | contribs) |
||
| (26 intermediate revisions by 2 users not shown) | |||
| Line 333: | Line 333: | ||
<span style="line-height:46px;" class="line">Development of A Novel</span></span> | <span style="line-height:46px;" class="line">Development of A Novel</span></span> | ||
<span style="line-height:46px;" class="line-wrap"> | <span style="line-height:46px;" class="line-wrap"> | ||
| − | <span style="line-height:46px;" class="line">Blood-MicroRNA | + | <span style="line-height:46px;" class="line">Blood-MicroRNA Handy Detection System with CRISPR</span></span> |
<!--</a>--></h2> | <!--</a>--></h2> | ||
</div> | </div> | ||
| Line 353: | Line 353: | ||
<div style="text-align:right;"><h5> | <div style="text-align:right;"><h5> | ||
<a style="color:rgb(10,31,84);" href="/Team:NUDT_CHINA">HomePage</a> • | <a style="color:rgb(10,31,84);" href="/Team:NUDT_CHINA">HomePage</a> • | ||
| − | <!-- 修改这里!! --> | + | <!-- 修改这里!! -->AWARDS • |
| − | <a style="color:rgb(10,31,84);" href="/Team:NUDT_CHINA/ | + | <a style="color:rgb(10,31,84);" href="/Team:NUDT_CHINA/Model"><!-- 修改这里!! -->Model</a> |
</h5><hr style="width:40%;margin-left:60%;border-top:1px solid rgb(10,31,84);" /></div> | </h5><hr style="width:40%;margin-left:60%;border-top:1px solid rgb(10,31,84);" /></div> | ||
| Line 377: | Line 377: | ||
| − | + | <!--标题--> | |
<h2> | <h2> | ||
<span><span style="color:#7f1015">Abstract</span></span><hr /> | <span><span style="color:#7f1015">Abstract</span></span><hr /> | ||
| Line 388: | Line 388: | ||
model is created to evaluate the effectiveness of initial design, and offers | model is created to evaluate the effectiveness of initial design, and offers | ||
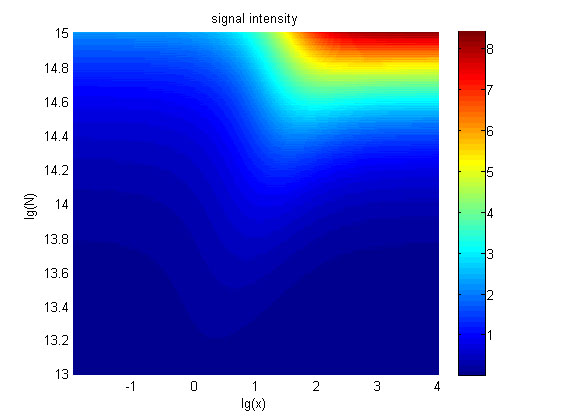
| − | guidelines | + | guidelines on how the system can (or must) be improved. (You can go to <a href="/Team:NUDT_CHINA/Design">PROJECT. page</a> to see more.) The core idea is to simulate the process of producing the signal which can be detected, and draw a conclusion by obtaining the relationship between the signal intensity and the concentration of miRNA. |
| − | + | ||
| − | page to see more.) The core idea is to simulate the process of producing the | + | |
| − | + | ||
| − | signal which can be detected, and draw a conclusion by obtaining the | + | |
| − | + | ||
| − | relationship between the signal intensity and the concentration of miRNA. | + | |
| − | + | ||
</span> | </span> | ||
</p> | </p> | ||
| Line 453: | Line 446: | ||
integrating the two models, we can theoretically predict the impacts of the | integrating the two models, we can theoretically predict the impacts of the | ||
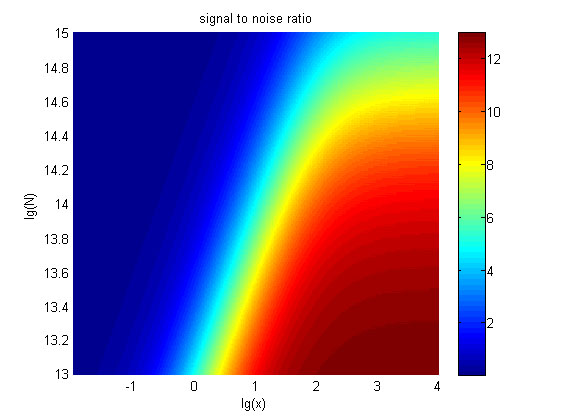
| − | molecule number of proteins on the signal to noise ratio and | + | molecule number of proteins on the signal to noise ratio and explain the trend |
| − | of the signal intensity | + | of the signal intensity variation against the change of the concentration of miRNA in our |
wet-lab work. | wet-lab work. | ||
| Line 472: | Line 465: | ||
<!--标题--> | <!--标题--> | ||
<h3> | <h3> | ||
| − | <span><span style="color:#7f1015"> About model </span></span | + | <span><span style="color:#7f1015"> About model </span></span> |
</h3> | </h3> | ||
| Line 478: | Line 471: | ||
<!--正文--> | <!--正文--> | ||
<p style="text-indent:22pt;"> | <p style="text-indent:22pt;"> | ||
| − | <span style="line-height:2;font-family:Perpetua;font-size:18px;"> | + | <span style="line-height:2;font-family:Perpetua;font-size:18px;">1. MiRNA is not degraded throughout the reaction process.</span> |
| − | + | ||
| − | + | ||
</p> | </p> | ||
</br> | </br> | ||
| Line 487: | Line 478: | ||
<!--正文--> | <!--正文--> | ||
<p style="text-indent:22pt;"> | <p style="text-indent:22pt;"> | ||
| − | <span style="line-height:2;font-family:Perpetua;font-size:18px;"> | + | <span style="line-height:2;font-family:Perpetua;font-size:18px;">2. The two fusion proteins of dCas9 and split-HRP fragments have the |
| − | + | ||
| − | + | ||
same ability to combine with the stem-loop structure, and only when two | same ability to combine with the stem-loop structure, and only when two | ||
| Line 502: | Line 491: | ||
<!--正文--> | <!--正文--> | ||
<p style="text-indent:22pt;"> | <p style="text-indent:22pt;"> | ||
| − | <span style="line-height:2;font-family:Perpetua;font-size:18px;"> | + | <span style="line-height:2;font-family:Perpetua;font-size:18px;">3. The number of stem-loop structures in each RCA product is equal |
| − | + | ||
| − | + | ||
under a certain reaction time. </span> | under a certain reaction time. </span> | ||
| Line 513: | Line 500: | ||
<!--正文--> | <!--正文--> | ||
<p style="text-indent:22pt;"> | <p style="text-indent:22pt;"> | ||
| − | <span style="line-height:2;font-family:Perpetua;font-size:18px;"> | + | <span style="line-height:2;font-family:Perpetua;font-size:18px;">4. The enzymatic activity remains unchanged with time under the premise |
| − | + | ||
| − | + | ||
of excessive amount of enzymes or a short-time reaction.</span> | of excessive amount of enzymes or a short-time reaction.</span> | ||
| Line 525: | Line 510: | ||
<!--标题--> | <!--标题--> | ||
<h3> | <h3> | ||
| − | <span><span style="color:#7f1015"> About the data </span></span | + | <span><span style="color:#7f1015"> About the data </span></span> |
| − | + | ||
| − | + | ||
</h3> | </h3> | ||
| Line 533: | Line 516: | ||
<!--正文--> | <!--正文--> | ||
<p style="text-indent:22pt;"> | <p style="text-indent:22pt;"> | ||
| − | <span style="line-height:2;font-family:Perpetua;font-size:18px;"> | + | <span style="line-height:2;font-family:Perpetua;font-size:18px;">1. The data we obtain from wet-lab experiment are reliable.</span> |
| − | + | ||
| − | + | ||
</p> | </p> | ||
</br> | </br> | ||
| Line 542: | Line 523: | ||
<!--正文--> | <!--正文--> | ||
<p style="text-indent:22pt;"> | <p style="text-indent:22pt;"> | ||
| − | <span style="line-height:2;font-family:Perpetua;font-size:18px;"> | + | <span style="line-height:2;font-family:Perpetua;font-size:18px;">2. All the results are trustworthy in the process of statistical |
| − | + | ||
| − | + | ||
processing and data calculation.</span> | processing and data calculation.</span> | ||
| Line 558: | Line 537: | ||
<!--标题--> | <!--标题--> | ||
<h3> | <h3> | ||
| − | <span><span style="color:#7f1015">Notations </span></span | + | <span><span style="color:#7f1015">Notations </span></span> |
</h3> | </h3> | ||
| Line 564: | Line 543: | ||
<!--表格--> | <!--表格--> | ||
| − | <table class="MsoTableGrid" border="1" cellspacing="0" cellpadding="0" | + | <p> |
| − | + | <table class="MsoTableGrid" border="1" cellspacing="0" cellpadding="0" style="border:none;"> | |
| − | style="border:none;"> | + | <tbody> |
| − | + | <tr> | |
| − | + | <td width="66" valign="top" style="border:solid windowtext 1.0pt;"> | |
| − | + | <p class="MsoNormal"> | |
| − | + | <span style="font-family:"">Symbol </span> | |
| − | windowtext 1.0pt;"> | + | </p> |
| − | + | </td> | |
| − | + | <td width="487" valign="top" style="border:solid windowtext 1.0pt;"> | |
| − | + | <p class="MsoNormal"> | |
| − | + | <span style="font-family:"">Definition </span> | |
| − | + | </p> | |
| − | + | </td> | |
| − | windowtext 1.0pt;"> | + | </tr> |
| − | + | <tr> | |
| − | + | <td width="66" valign="top" style="border:solid windowtext 1.0pt;"> | |
| − | + | <p class="MsoNormal"> | |
| − | + | <i><span style="font-family:"">x</span></i> | |
| − | + | </p> | |
| − | + | </td> | |
| − | + | <td width="487" valign="top" style="border:solid windowtext 1.0pt;"> | |
| − | + | <p class="MsoNormal"> | |
| − | windowtext 1.0pt;"> | + | <a name="OLE_LINK7"></a><a name="OLE_LINK6"></a><span style="font-family:"">The |
| − | + | concentration of</span><span style="font-family:""> miRNA (pM)</span> | |
| − | + | </p> | |
| − | + | </td> | |
| − | + | </tr> | |
| − | + | <tr> | |
| − | + | <td width="66" valign="top" style="border:solid windowtext 1.0pt;"> | |
| − | windowtext 1.0pt;"> | + | <p class="MsoNormal"> |
| − | + | <i><span style="font-family:"">C<sub>1</sub></span></i> | |
| − | + | </p> | |
| − | + | </td> | |
| − | name="OLE_LINK6"></a><span>The concentration of</span><span> miRNA (pM)</span> | + | <td width="487" valign="top" style="border:solid windowtext 1.0pt;"> |
| − | + | <p class="MsoNormal"> | |
| − | + | <span style="font-family:"">The | |
| − | + | concentration of initiated probe (Abbreviated to iprobe)</span> | |
| − | + | </p> | |
| − | + | </td> | |
| − | + | </tr> | |
| − | windowtext 1.0pt;"> | + | <tr> |
| − | + | <td width="66" valign="top" style="border:solid windowtext 1.0pt;"> | |
| − | + | <p class="MsoNormal"> | |
| − | + | <i><span style="font-family:"">k<sub>1</sub></span></i> | |
| − | + | </p> | |
| − | + | </td> | |
| − | + | <td width="487" valign="top" style="border:solid windowtext 1.0pt;"> | |
| − | windowtext 1.0pt;"> | + | <p class="MsoNormal"> |
| − | + | <a name="OLE_LINK8"></a><span style="font-family:"">A constant representing the scale factor</span><span style="font-family:""></span> | |
| − | + | </p> | |
| − | + | </td> | |
| − | probe (Abbreviated | + | </tr> |
| − | + | <tr> | |
| − | + | <td width="66" valign="top" style="border:solid windowtext 1.0pt;"> | |
| − | + | <p class="MsoNormal"> | |
| − | + | <i><span style="font-family:"">K<sub>m </sub></span></i> | |
| − | + | </p> | |
| − | + | </td> | |
| − | + | <td width="487" valign="top" style="border:solid windowtext 1.0pt;"> | |
| − | windowtext 1.0pt;"> | + | <p class="MsoNormal"> |
| − | + | <span style="font-family:"">One | |
| − | + | of the characteristic constants of phi29 DNA polymerase</span> | |
| − | + | </p> | |
| − | + | </td> | |
| − | + | </tr> | |
| − | + | <tr> | |
| − | windowtext 1.0pt;"> | + | <td width="66" valign="top" style="border:solid windowtext 1.0pt;"> |
| − | + | <p class="MsoNormal"> | |
| − | + | <i><span style="font-family:"">V<sub>max</sub></span></i> | |
| − | + | </p> | |
| − | representing | + | </td> |
| − | + | <td width="487" valign="top" style="border:solid windowtext 1.0pt;"> | |
| − | + | <p class="MsoNormal"> | |
| − | + | <span style="font-family:"">One | |
| − | + | of the characteristic constants of phi29 DNA polymerase</span> | |
| − | + | </p> | |
| − | + | </td> | |
| − | + | </tr> | |
| − | windowtext 1.0pt;"> | + | <tr> |
| − | + | <td width="66" valign="top" style="border:solid windowtext 1.0pt;"> | |
| − | + | <p class="MsoNormal"> | |
| − | + | <i><span style="font-family:"">k<sub>2</sub></span></i> | |
| − | + | </p> | |
| − | + | </td> | |
| − | + | <td width="487" valign="top" style="border:solid windowtext 1.0pt;"> | |
| − | windowtext 1.0pt;"> | + | <p class="MsoNormal"> |
| − | + | <span style="font-family:"">A | |
| − | + | constant representing the scale factor</span> | |
| − | + | </p> | |
| − | constants of | + | </td> |
| − | + | </tr> | |
| − | + | <tr> | |
| − | + | <td width="66" valign="top" style="border:solid windowtext 1.0pt;"> | |
| − | + | <p class="MsoNormal"> | |
| − | + | <i><span style="font-family:"">V</span></i> | |
| − | + | </p> | |
| − | + | </td> | |
| − | windowtext 1.0pt;"> | + | <td width="487" valign="top" style="border:solid windowtext 1.0pt;"> |
| − | + | <p class="MsoNormal"> | |
| − | + | <span style="font-family:"">The initial | |
| − | + | speed of RCA </span> | |
| − | + | </p> | |
| − | + | </td> | |
| − | + | </tr> | |
| − | windowtext 1.0pt;"> | + | <tr> |
| − | + | <td width="66" valign="top" style="border:solid windowtext 1.0pt;"> | |
| − | + | <p class="MsoNormal"> | |
| − | + | <a name="OLE_LINK9"></a><i><span style="font-family:"">n<sub>1</sub></span></i><i><sub><span style="font-family:""></span></sub></i> | |
| − | constants of phi29 | + | </p> |
| − | + | </td> | |
| − | + | <td width="487" valign="top" style="border:solid windowtext 1.0pt;"> | |
| − | + | <p class="MsoNormal"> | |
| − | + | <span style="font-family:"">The | |
| − | + | moles of RCA product</span> | |
| − | + | </p> | |
| − | + | </td> | |
| − | windowtext 1.0pt;"> | + | </tr> |
| − | + | <tr> | |
| − | + | <td width="66" valign="top" style="border:solid windowtext 1.0pt;"> | |
| − | + | <p class="MsoNormal"> | |
| − | + | <i><span style="font-family:"">n<sub>2</sub></span></i> | |
| − | + | </p> | |
| − | + | </td> | |
| − | windowtext 1.0pt;"> | + | <td width="487" valign="top" style="border:solid windowtext 1.0pt;"> |
| − | + | <p class="MsoNormal"> | |
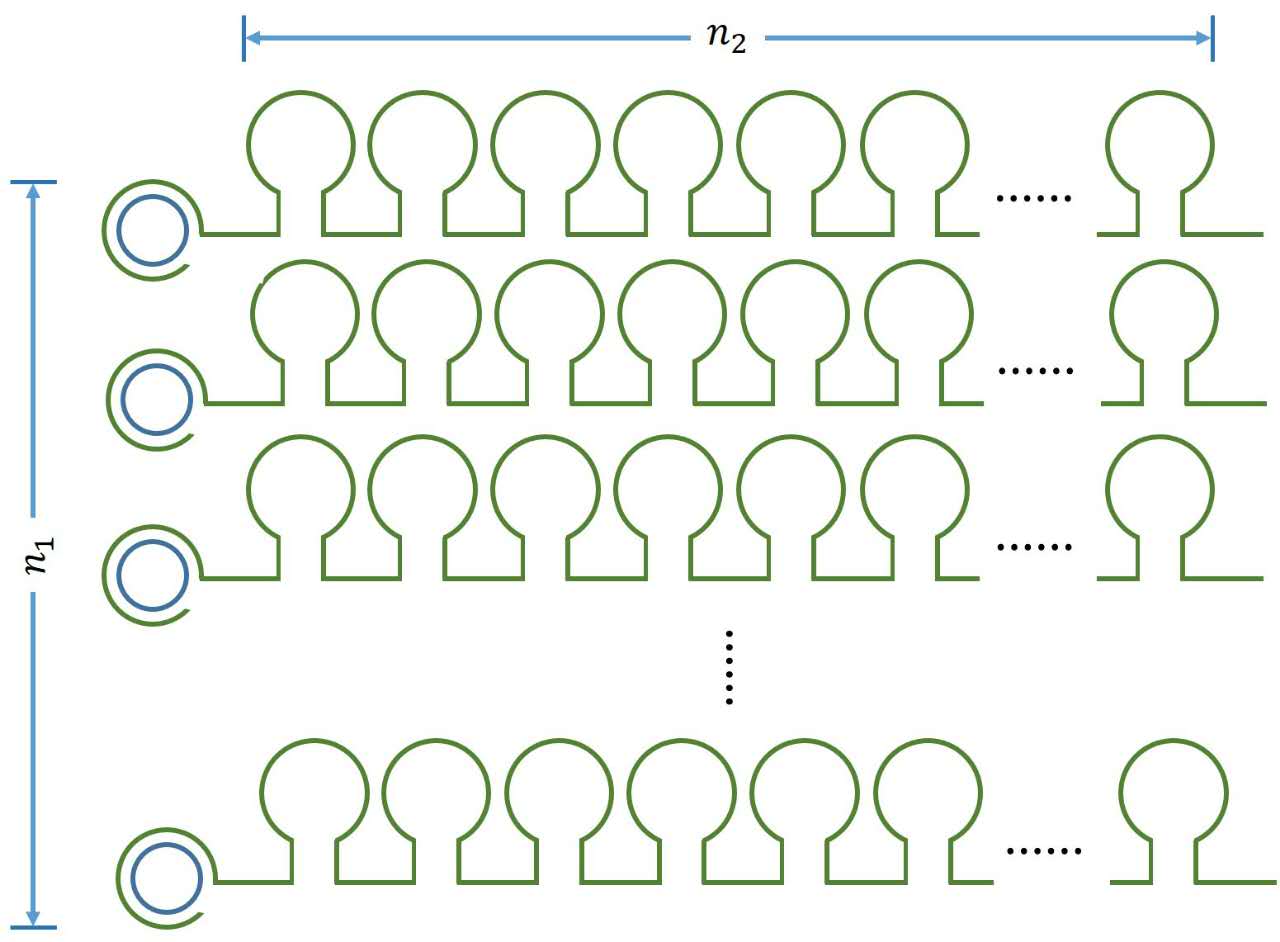
| − | + | <a name="OLE_LINK10"></a><span style="font-family:"">The number of stem-loop structures in each RCA product</span><span style="font-family:""></span> | |
| − | + | </p> | |
| − | factor</span> | + | </td> |
| − | + | </tr> | |
| − | + | <tr> | |
| − | + | <td width="66" valign="top" style="border:solid windowtext 1.0pt;"> | |
| − | + | <p class="MsoNormal"> | |
| − | + | <i><span style="font-family:"">n</span></i> | |
| − | + | </p> | |
| − | windowtext 1.0pt;"> | + | </td> |
| − | + | <td width="487" valign="top" style="border:solid windowtext 1.0pt;"> | |
| − | + | <p class="MsoNormal"> | |
| − | + | <span style="font-family:"">The total | |
| − | + | amount of <a name="OLE_LINK23"></a><a name="OLE_LINK22"></a>stem-loop structures</span> | |
| − | + | </p> | |
| − | + | </td> | |
| − | windowtext 1.0pt;"> | + | </tr> |
| − | + | <tr> | |
| − | + | <td width="66" valign="top" style="border:solid windowtext 1.0pt;"> | |
| − | + | <p class="MsoNormal"> | |
| − | + | <i><span style="font-family:"">N</span></i> | |
| − | + | </p> | |
| − | + | </td> | |
| − | + | <td width="487" valign="top" style="border:solid windowtext 1.0pt;"> | |
| − | + | <p class="MsoNormal"> | |
| − | windowtext 1.0pt;"> | + | <a name="OLE_LINK41"></a><a name="OLE_LINK16"></a><span style="font-family:"">The |
| − | + | molecule number of the fusion protein of dCas9 and split-HRP fragments</span><span style="font-family:""></span> | |
| − | + | </p> | |
| − | + | </td> | |
| − | name="OLE_LINK9"></a><i><span>n<sub>1</sub></span></i><i><sub><span></span></sub | + | </tr> |
| − | + | <tr> | |
| − | ></i> | + | <td width="66" valign="top" style="border:solid windowtext 1.0pt;"> |
| − | + | <p class="MsoNormal"> | |
| − | + | <i><span style="font-family:"">k<sub>3</sub></span></i> | |
| − | + | </p> | |
| − | + | </td> | |
| − | windowtext 1.0pt;"> | + | <td width="487" valign="top" style="border:solid windowtext 1.0pt;"> |
| − | + | <p class="MsoNormal"> | |
| − | + | <span style="font-family:"">A | |
| − | + | constant representing the scale factor</span> | |
| − | + | </p> | |
| − | + | </td> | |
| − | + | </tr> | |
| − | + | <tr> | |
| − | + | <td width="66" valign="top" style="border:solid windowtext 1.0pt;"> | |
| − | windowtext 1.0pt;"> | + | <p class="MsoNormal"> |
| − | + | <i><span style="font-family:"">y<sub>1</sub></span></i> | |
| − | + | </p> | |
| − | + | </td> | |
| − | + | <td width="487" valign="top" style="border:solid windowtext 1.0pt;"> | |
| − | + | <p class="MsoNormal"> | |
| − | + | <span style="font-family:"">The fluorescence | |
| − | windowtext 1.0pt;"> | + | intensity of DNA-dye-complex (RFU)</span> |
| − | + | </p> | |
| − | + | </td> | |
| − | + | </tr> | |
| − | number of | + | <tr> |
| − | + | <td width="66" valign="top" style="border:solid windowtext 1.0pt;"> | |
| − | + | <p class="MsoNormal"> | |
| − | + | <i><span style="font-family:"">N<sub>1</sub></span></i> | |
| − | + | </p> | |
| − | + | </td> | |
| − | + | <td width="487" valign="top" style="border:solid windowtext 1.0pt;"> | |
| − | + | <p class="MsoNormal"> | |
| − | windowtext 1.0pt;"> | + | <span style="font-family:"">The |
| − | + | molecule number of the fusion protein of dCas9 and split-HRP fragments in the | |
| − | + | solution</span> | |
| − | + | </p> | |
| − | + | </td> | |
| − | + | </tr> | |
| − | + | <tr> | |
| − | windowtext 1.0pt;"> | + | <td width="66" valign="top" style="border:solid windowtext 1.0pt;"> |
| − | + | <p class="MsoNormal"> | |
| − | + | <i><span style="font-family:"">N<sub>2</sub></span></i> | |
| − | + | </p> | |
| − | name="OLE_LINK23"></a><a name="OLE_LINK22"></a>stem-loop structures</span> | + | </td> |
| − | + | <td width="487" valign="top" style="border:solid windowtext 1.0pt;"> | |
| − | + | <p class="MsoNormal"> | |
| − | + | <a name="OLE_LINK45"></a><span style="font-family:"">The molecule number of the fusion protein of dCas9 and | |
| − | + | split-HRP fragments binding with stem-loop structure</span><span style="font-family:""></span> | |
| − | + | </p> | |
| − | + | </td> | |
| − | windowtext 1.0pt;"> | + | </tr> |
| − | + | <tr> | |
| − | + | <td width="66" valign="top" style="border:solid windowtext 1.0pt;"> | |
| − | + | <p class="MsoNormal"> | |
| − | + | <i><span style="font-family:"">k<sub>4</sub></span></i> | |
| − | + | </p> | |
| − | + | </td> | |
| − | windowtext 1.0pt;"> | + | <td width="487" valign="top" style="border:solid windowtext 1.0pt;"> |
| − | + | <p class="MsoNormal"> | |
| − | + | <span style="font-family:"">A | |
| − | + | constant representing the scale factor</span> | |
| − | name="OLE_LINK16"></a><span>The molecule number of the | + | </p> |
| − | + | </td> | |
| − | + | </tr> | |
| − | + | <tr> | |
| − | + | <td width="66" valign="top" style="border:solid windowtext 1.0pt;"> | |
| − | + | <p class="MsoNormal"> | |
| − | + | <i><span style="font-family:"">k<sub>5</sub></span></i> | |
| − | + | </p> | |
| − | windowtext 1.0pt;"> | + | </td> |
| − | + | <td width="487" valign="top" style="border:solid windowtext 1.0pt;"> | |
| − | + | <p class="MsoNormal"> | |
| − | + | <span style="font-family:"">A | |
| − | + | constant representing the scale factor</span> | |
| − | + | </p> | |
| − | + | </td> | |
| − | windowtext 1.0pt;"> | + | </tr> |
| − | + | <tr> | |
| − | + | <td width="66" valign="top" style="border:solid windowtext 1.0pt;"> | |
| − | + | <p class="MsoNormal"> | |
| − | factor</span> | + | <i><span style="font-family:"">ρ</span></i><i><span style="font-family:""></span></i> |
| − | + | </p> | |
| − | + | </td> | |
| − | + | <td width="487" valign="top" style="border:solid windowtext 1.0pt;"> | |
| − | + | <p class="MsoNormal"> | |
| − | + | <span style="font-family:"">Signal | |
| − | + | to noise ratio(Abbreviated to SNR)</span> | |
| − | windowtext 1.0pt;"> | + | </p> |
| − | + | </td> | |
| − | + | </tr> | |
| − | + | <tr> | |
| − | + | <td width="66" valign="top" style="border:solid windowtext 1.0pt;"> | |
| − | + | <p class="MsoNormal"> | |
| − | + | <i><span style="font-family:"">I</span></i> | |
| − | windowtext 1.0pt;"> | + | </p> |
| − | + | </td> | |
| − | + | <td width="487" valign="top" style="border:solid windowtext 1.0pt;"> | |
| − | DNA-dye-complex (RFU)</span> | + | <p class="MsoNormal"> |
| − | + | <span style="font-family:"">The | |
| − | + | molecule number of formed intact HRP proteins </span> | |
| − | + | </p> | |
| − | + | </td> | |
| − | + | </tr> | |
| − | + | <tr> | |
| − | windowtext 1.0pt;"> | + | <td width="66" valign="top" style="border:solid windowtext 1.0pt;"> |
| − | + | <p class="MsoNormal"> | |
| − | + | <i><span style="font-family:"">I<sub>1</sub></span></i> | |
| − | + | </p> | |
| − | + | </td> | |
| − | + | <td width="487" valign="top" style="border:solid windowtext 1.0pt;"> | |
| − | + | <p class="MsoNormal"> | |
| − | windowtext 1.0pt;"> | + | <span style="font-family:"">The |
| − | + | molecule number of formed intact HRP proteins in the solution</span> | |
| − | + | </p> | |
| − | + | </td> | |
| − | protein | + | </tr> |
| − | + | <tr> | |
| − | + | <td width="66" valign="top" style="border:solid windowtext 1.0pt;"> | |
| − | + | <p class="MsoNormal"> | |
| − | + | <i><span style="font-family:"">I<sub>2</sub></span></i> | |
| − | + | </p> | |
| − | + | </td> | |
| − | + | <td width="487" valign="top" style="border:solid windowtext 1.0pt;"> | |
| − | windowtext 1.0pt;"> | + | <p class="MsoNormal"> |
| − | + | <a name="OLE_LINK43"></a><span style="font-family:"">The molecule number of formed intact HRP proteins through | |
| − | + | binding with stem-loop structure</span><span style="font-family:""></span> | |
| − | + | </p> | |
| − | + | </td> | |
| − | + | </tr> | |
| − | + | <tr> | |
| − | windowtext 1.0pt;"> | + | <td width="66" valign="top" style="border:solid windowtext 1.0pt;"> |
| − | + | <p class="MsoNormal"> | |
| − | + | <i><span style="font-family:"">t</span></i> | |
| − | + | </p> | |
| − | molecule number | + | </td> |
| − | + | <td width="487" valign="top" style="border:solid windowtext 1.0pt;"> | |
| − | + | <p class="MsoNormal"> | |
| − | + | <span style="font-family:"">Reaction | |
| − | + | time</span> | |
| − | + | </p> | |
| − | + | </td> | |
| − | + | </tr> | |
| − | + | <tr> | |
| − | windowtext 1.0pt;"> | + | <td width="66" valign="top" style="border:solid windowtext 1.0pt;"> |
| − | + | <p class="MsoNormal"> | |
| − | + | <i><span style="font-family:"">y<sub>2</sub></span></i> | |
| − | + | </p> | |
| − | + | </td> | |
| − | + | <td width="487" valign="top" style="border:solid windowtext 1.0pt;"> | |
| − | + | <p class="MsoNormal"> | |
| − | windowtext 1.0pt;"> | + | <span style="font-family:"">The |
| − | + | signal intensity (OD<sub>450</sub>)</span> | |
| − | + | </p> | |
| − | + | </td> | |
| − | factor</span> | + | </tr> |
| − | + | </tbody> | |
| − | + | </table> | |
| − | + | </p> | |
| − | + | ||
| − | + | ||
| − | + | ||
| − | windowtext 1.0pt;"> | + | |
| − | + | ||
| − | + | ||
| − | + | ||
| − | + | ||
| − | + | ||
| − | + | ||
| − | windowtext 1.0pt;"> | + | |
| − | + | ||
| − | + | ||
| − | + | ||
| − | factor</span> | + | |
| − | + | ||
| − | + | ||
| − | + | ||
| − | + | ||
| − | + | ||
| − | + | ||
| − | windowtext 1.0pt;"> | + | |
| − | + | ||
| − | + | ||
| − | + | ||
| − | + | ||
| − | + | ||
| − | + | ||
| − | + | ||
| − | + | ||
| − | windowtext 1.0pt;"> | + | |
| − | + | ||
| − | + | ||
| − | + | ||
| − | to SNR)</span> | + | |
| − | + | ||
| − | + | ||
| − | + | ||
| − | + | ||
| − | + | ||
| − | + | ||
| − | windowtext 1.0pt;"> | + | |
| − | + | ||
| − | + | ||
| − | + | ||
| − | + | ||
| − | + | ||
| − | + | ||
| − | + | ||
| − | + | ||
| − | windowtext 1.0pt;"> | + | |
| − | + | ||
| − | + | ||
| − | + | ||
| − | intact HRP | + | |
| − | + | ||
| − | + | ||
| − | + | ||
| − | + | ||
| − | + | ||
| − | + | ||
| − | + | ||
| − | windowtext 1.0pt;"> | + | |
| − | + | ||
| − | + | ||
| − | + | ||
| − | + | ||
| − | + | ||
| − | + | ||
| − | + | ||
| − | + | ||
| − | windowtext 1.0pt;"> | + | |
| − | + | ||
| − | + | ||
| − | + | ||
| − | molecule number | + | |
| − | + | ||
| − | + | ||
| − | + | ||
| − | + | ||
| − | + | ||
| − | + | ||
| − | + | ||
| − | windowtext 1.0pt;"> | + | |
| − | + | ||
| − | + | ||
| − | + | ||
| − | + | ||
| − | + | ||
| − | + | ||
| − | + | ||
| − | + | ||
| − | windowtext 1.0pt;"> | + | |
| − | + | ||
| − | + | ||
| − | + | ||
| − | + | ||
| − | + | ||
| − | + | ||
| − | + | ||
| − | + | ||
| − | windowtext 1.0pt;"> | + | |
| − | + | ||
| − | + | ||
| − | + | ||
| − | + | ||
| − | + | ||
| − | + | ||
| − | + | ||
| − | + | ||
| − | windowtext 1.0pt;"> | + | |
| − | + | ||
| − | + | ||
| − | + | ||
| − | (OD<sub>450</sub>)</span> | + | |
| − | + | ||
| − | + | ||
| − | + | ||
| − | + | ||
| − | </table> | + | |
| − | + | ||
| Line 1,027: | Line 864: | ||
<!--标题--> | <!--标题--> | ||
<h3> | <h3> | ||
| − | <span><span style="color:#7f1015"> The RCA model </span></span | + | <span><span style="color:#7f1015"> The RCA model </span></span> |
| − | + | ||
| − | + | ||
</h3> | </h3> | ||
| Line 1,036: | Line 871: | ||
<!--正文--> | <!--正文--> | ||
<p style="text-indent:22pt;"> | <p style="text-indent:22pt;"> | ||
| − | <span style="line-height:2;font-family:Perpetua;font-size:18px;">Firstly, we assume that there is a linear relationship between the | + | <span style="line-height:2;font-family:Perpetua;font-size:18px;">Firstly, we |
| + | |||
| + | assume that there is a linear relationship between the | ||
concentration of the initiated probes and miRNA as the combination reaction | concentration of the initiated probes and miRNA as the combination reaction | ||
| Line 1,200: | Line 1,037: | ||
<span><span style="color:#7f1015"> The signal detection model | <span><span style="color:#7f1015"> The signal detection model | ||
| − | </span></span | + | </span></span> |
</h3> | </h3> | ||
<!--正文--> | <!--正文--> | ||
<p style="text-indent:22pt;"> | <p style="text-indent:22pt;"> | ||
| − | <span style="line-height:2;font-family:Perpetua;font-size:18px;">Firstly, it is obvious that there is a linear relationship between | + | <span style="line-height:2;font-family:Perpetua;font-size:18px;">Firstly, it is |
| + | |||
| + | obvious that there is a linear relationship between | ||
the molecule number of formed intact HRP proteins in the solution (consider as | the molecule number of formed intact HRP proteins in the solution (consider as | ||
| Line 1,349: | Line 1,188: | ||
<!--正文--> | <!--正文--> | ||
<p style="text-indent:22pt;"> | <p style="text-indent:22pt;"> | ||
| − | <span style="line-height:2;font-family:Perpetua;font-size:18px;">Notably, under the premise of excessive substrates, | + | <span style="line-height:2;font-family:Perpetua;font-size:18px;">Notably, under |
| + | |||
| + | the premise of excessive substrates, | ||
it is a linear relationship between the reaction rate and the concentration of | it is a linear relationship between the reaction rate and the concentration of | ||
enzymes when we assume that the enzymatic activity remain unchanged with time, | enzymes when we assume that the enzymatic activity remain unchanged with time, | ||
| Line 1,418: | Line 1,259: | ||
<span><span style="color:#7f1015"> The calculation of the constants | <span><span style="color:#7f1015"> The calculation of the constants | ||
| − | </span></span | + | </span></span> |
</h3> | </h3> | ||
| Line 1,454: | Line 1,295: | ||
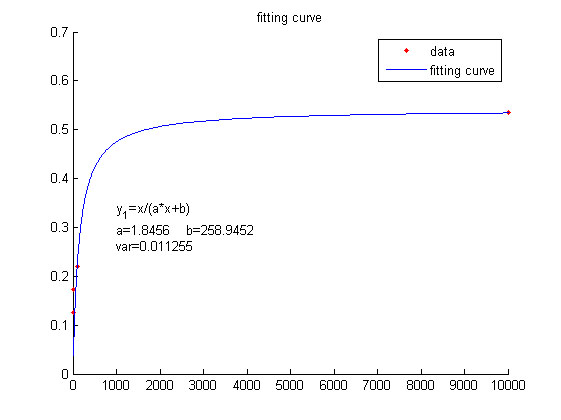
<span style="line-height:2;font-family:Perpetua;font-size:18px;">We use | <span style="line-height:2;font-family:Perpetua;font-size:18px;">We use | ||
| − | this equation to fit the data points obtained through experiments. (Figure | + | this equation to fit the data points obtained through experiments. (Figure 2. |
| − | the | + | (D)in the <a href="/Team:NUDT_CHINA/Results">RESULTS.page</a>) The fitting |
| + | |||
| + | curve is shown below.</span> | ||
</p> | </p> | ||
</br> | </br> | ||
| Line 1,500: | Line 1,343: | ||
<span><span style="color:#7f1015"> Results and Analysis | <span><span style="color:#7f1015"> Results and Analysis | ||
| − | </span></span | + | </span></span> |
</h3> | </h3> | ||
| Line 1,559: | Line 1,402: | ||
</br> | </br> | ||
| − | |||
| − | |||
| − | |||
| − | |||
| − | |||
| − | |||
| − | |||
| − | |||
| − | |||
| − | |||
| − | |||
| − | |||
| Line 1,601: | Line 1,432: | ||
</br> | </br> | ||
| + | |||
| + | <!--标题--> | ||
| + | <h3> | ||
| + | <span><span style="color:#7f1015"> Test of model | ||
| + | |||
| + | </span></span> | ||
| + | </h3> | ||
<!--正文--> | <!--正文--> | ||
<p style="text-indent:22pt;"> | <p style="text-indent:22pt;"> | ||
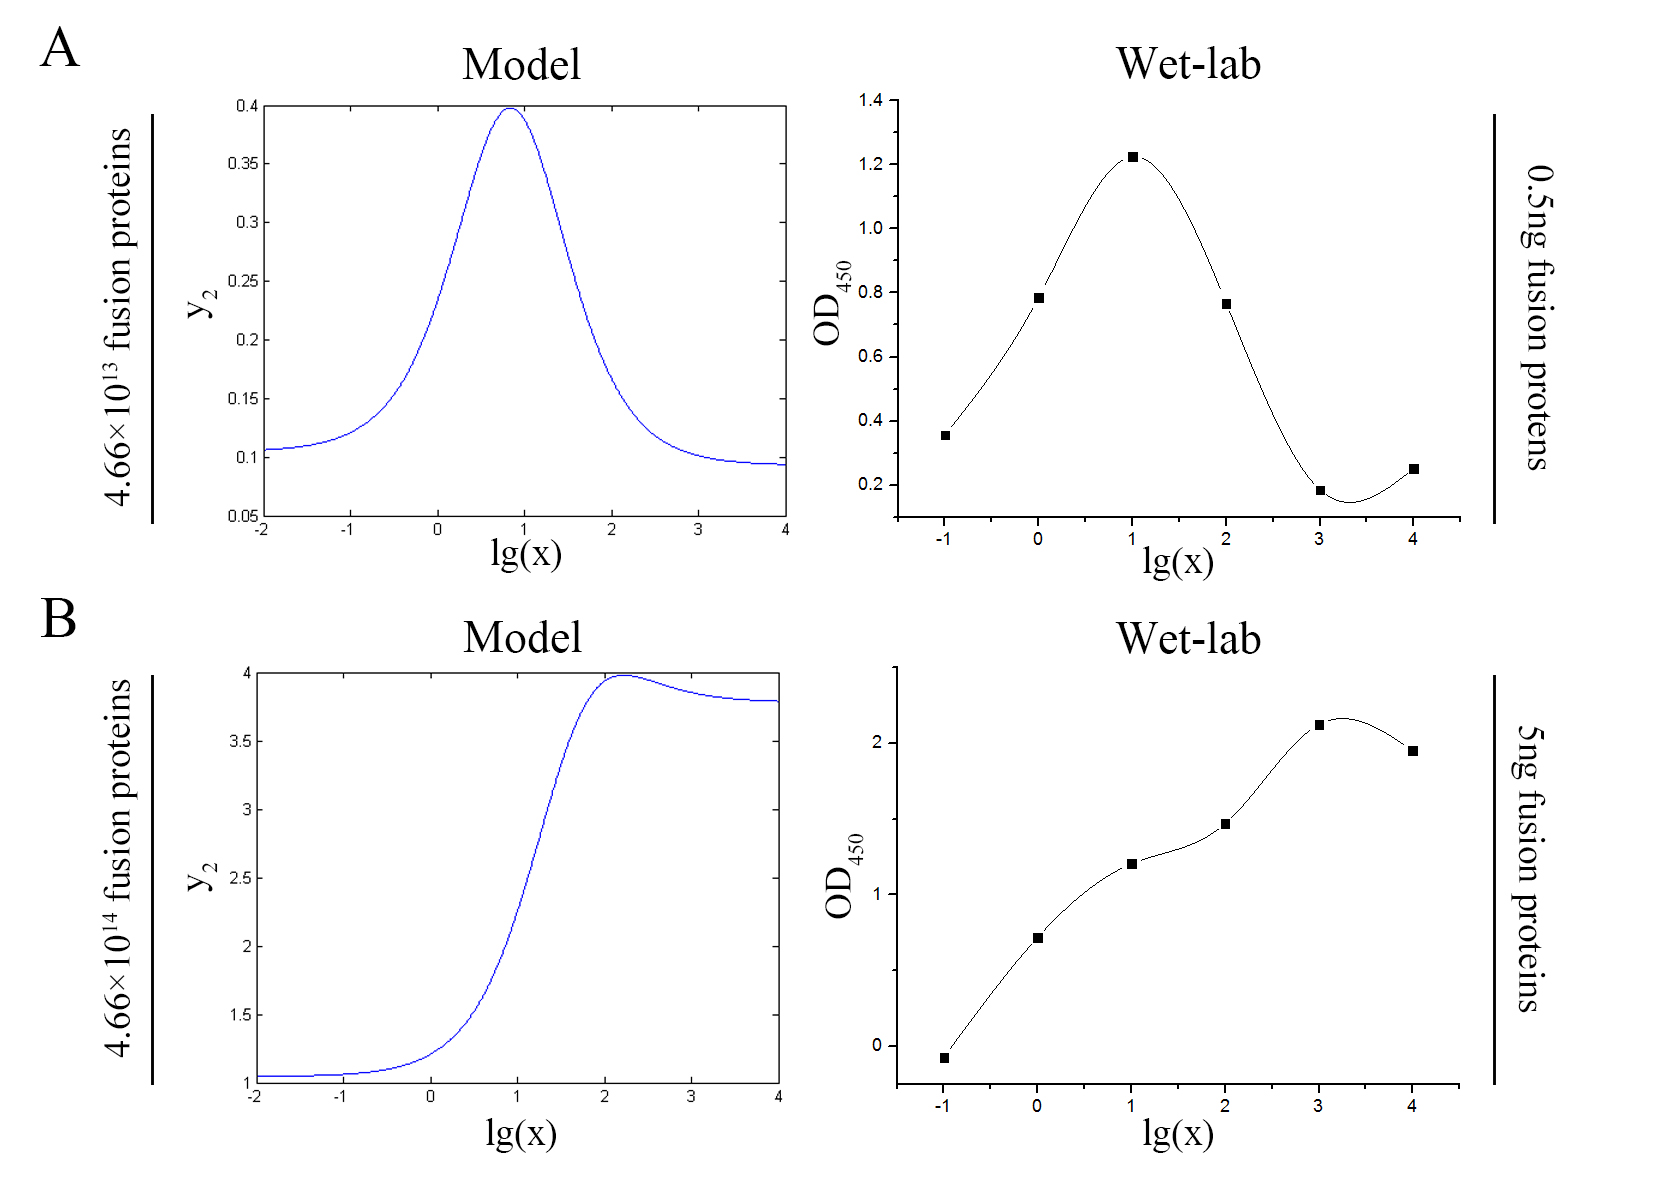
| − | <span style="line-height:2;font-family:Perpetua;font-size:18px;"> | + | <span style="line-height:2;font-family:Perpetua;font-size:18px;">Our |
| − | + | model predicts the relationship between the signal intensity and the | |
| − | + | concentration of miRNA under the premise of adding a certain amount of the | |
| − | below. </span> | + | fusion proteins of dCas9 and split-HRP fragments. So we can test if our model is |
| + | |||
| + | reasonable by comparing the curves predicted by the model with those obtained | ||
| + | |||
| + | from the experiment. The results are shown below. | ||
| + | </span> | ||
| + | </p> | ||
| + | </br> | ||
| + | |||
| + | |||
| + | |||
| + | <!--图和图注--> | ||
| + | </br> | ||
| + | </html> | ||
| + | [[File:T--NUDT_CHINA--modelfig7-2.jpg|700px|center]] | ||
| + | <html> | ||
| + | </br> | ||
| + | <p> | ||
| + | <span style="line-height:2;font-family:Perpetua;font- | ||
| + | |||
| + | size:18px;"><b>Figure 7. Test of model</b> Plot of the signal intensity (OD<sub>450</sub>) against miRNA concentration (pM) predicted by the model and experimented by wet-lab. (A) The value of the molecule number of each fusion protein added to the system is set to be 4.66e+13. The mass of each fusion protein added to the system in wet-lab is 0.5 ng. (B) The value of the molecule number of each fusion protein added to the system is set to be 4.66e+14. The mass of each fusion protein added to the system in wet-lab is 5 ng.</span> | ||
| + | </p> | ||
| + | |||
| + | </br> | ||
| + | |||
| + | |||
| + | |||
| + | <!--正文--> | ||
| + | <p style="text-indent:22pt;"> | ||
| + | <span style="line-height:2;font-family:Perpetua;font-size:18px;">We can learn | ||
| + | |||
| + | from the figure above that the general trend of curves predicted by the model agree well with the experimental results. </span> | ||
| + | </p> | ||
| + | </br> | ||
| + | |||
| + | |||
| + | |||
| + | <!--标题--> | ||
| + | <h3> | ||
| + | <span><span style="color:#7f1015"> Model extension | ||
| + | |||
| + | </span></span> | ||
| + | </h3> | ||
| + | |||
| + | <!--正文--> | ||
| + | <p style="text-indent:22pt;"> | ||
| + | <span style="line-height:2;font-family:Perpetua;font-size:18px;">Furthermore, we | ||
| + | |||
| + | consider that it is conducive to signal detection when the value of signal | ||
| + | |||
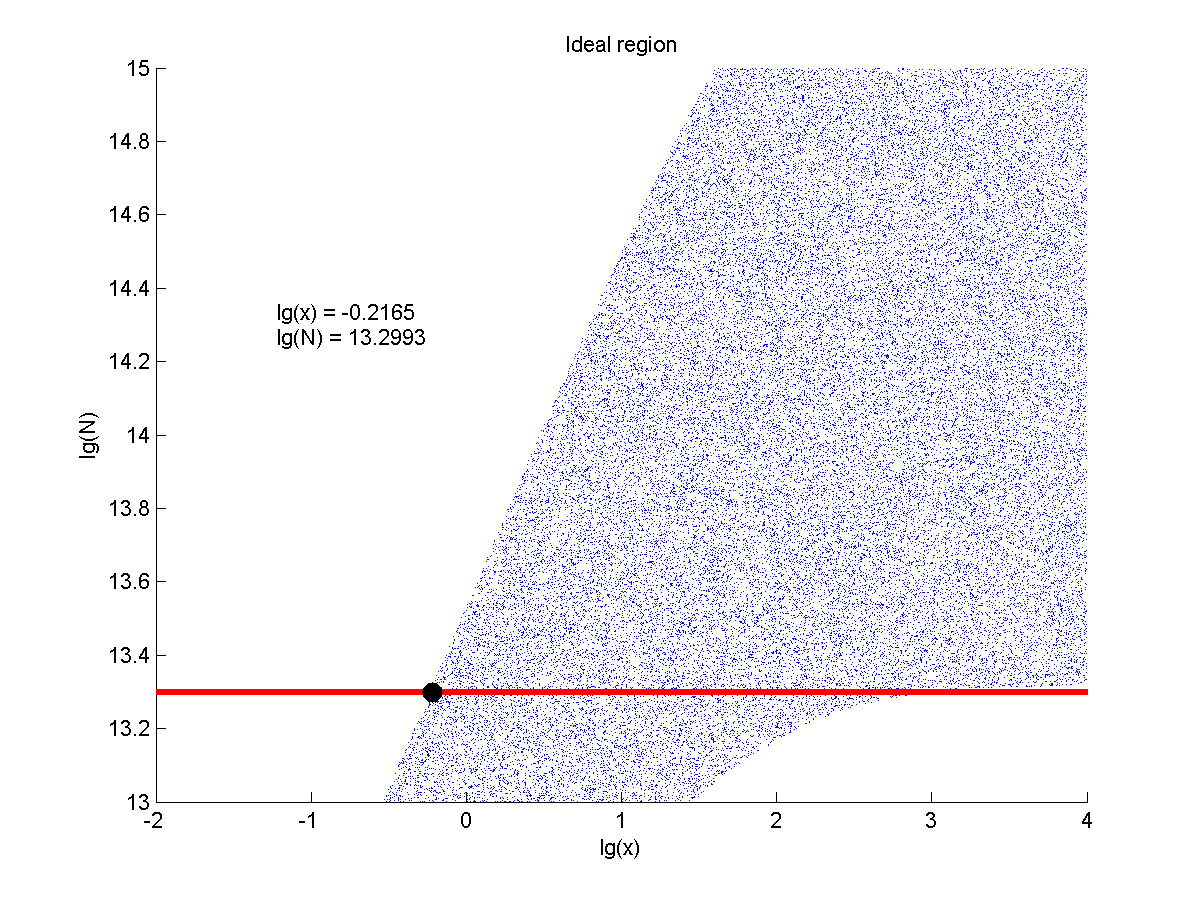
| + | intensity and SNR are both greater than two. We obtain the ideal region through | ||
| + | |||
| + | calculation, which is shown as below. </span> | ||
</p> | </p> | ||
</br> | </br> | ||
| Line 1,625: | Line 1,515: | ||
<span style="line-height:2;font-family:Perpetua;font- | <span style="line-height:2;font-family:Perpetua;font- | ||
| − | size:18px;"><b>Figure | + | size:18px;"><b>Figure 8. Ideal region</b> Region of qualified logarithm of |
concentrations of miRNA (pM) and logarithm of the additional amount of fusion | concentrations of miRNA (pM) and logarithm of the additional amount of fusion | ||
| Line 1,640: | Line 1,530: | ||
<span style="line-height:2;font-family:Perpetua;font-size:18px;">When | <span style="line-height:2;font-family:Perpetua;font-size:18px;">When | ||
| − | the value of N is | + | the value of N is set to e+13.3, the range of the value of x contained in the |
| − | set to | + | |
| − | + | ideal region is a maximum, which means when the value of the molecule number of | |
| − | + | ||
| − | number of the fusion proteins is | + | the fusion proteins is e+13.3, the concentration range of miRNA that can be |
| − | + | ||
| + | detected is maximum. </span> | ||
</p> | </p> | ||
</br> | </br> | ||
| Line 1,667: | Line 1,557: | ||
<!--正文--> | <!--正文--> | ||
<p style="text-indent:22pt;"> | <p style="text-indent:22pt;"> | ||
| − | <span style="line-height:2;font-family:Perpetua;font-size:18px;">The | + | <span style="line-height:2;font-family:Perpetua;font-size:18px;">The general trend of curves predicted by the model are in good agreement with the experimental |
| − | + | ||
| − | + | ||
| − | + | ||
| − | + | ||
| − | + | results, thus indicating that our model is reasonable.</span> | |
</p> | </p> | ||
</br> | </br> | ||
| Line 1,681: | Line 1,567: | ||
<span style="line-height:2;font-family:Perpetua;font-size:18px;">The | <span style="line-height:2;font-family:Perpetua;font-size:18px;">The | ||
| − | value of the molecule number of fusion protein of dCas9 and split-HRP | + | value of the molecule number of the fusion protein of dCas9 and split-HRP |
| − | not only affects the signal-to-noise ratio, but also the signal | + | fragments not only affects the signal-to-noise ratio, but also the signal |
| − | need to weigh its impact on both to select the optimal solution.</span> | + | intensity. So we need to weigh its impact on both to select the optimal |
| + | |||
| + | solution.</span> | ||
</p> | </p> | ||
</br> | </br> | ||
| Line 1,694: | Line 1,582: | ||
<span style="line-height:2;font-family:Perpetua;font-size:18px;">The | <span style="line-height:2;font-family:Perpetua;font-size:18px;">The | ||
| − | concentration range | + | concentration range of miRNA that can be detected is a maximum when we set the |
| − | of miRNA | + | |
| − | the molecule number of the fusion proteins to be | + | value of the molecule number of the fusion proteins to be e+13.3, building on |
| − | + | ||
| − | + | which, our wet-lab protocol could be optimized in our future work.</span> | |
</p> | </p> | ||
</br> | </br> | ||
| Line 1,710: | Line 1,598: | ||
<!--正文--> | <!--正文--> | ||
<p > | <p > | ||
| − | <span style="line-height:2;font-family:Perpetua;font-size:18px;">1 Deng, R. <i>et al</i>. | + | <span style="line-height:2;font-family:Perpetua;font-size:18px;">1 Deng, R. <i>et al</i>.Toehold-initiated rolling circleamplification for visualizing individual microRNAs in situ in single cells. <i>Angew Chem Int Ed Engl </i>53, 2389-2393,doi:10.1002/anie.201309388 (2014).</span> |
| − | + | ||
| − | Toehold-initiated rolling | + | |
| − | + | ||
| − | + | ||
| − | <i>Angew Chem Int Ed Engl </i>53, 2389-2393, | + | |
| − | doi:10.1002/anie.201309388 (2014).</span> | + | |
</p> | </p> | ||
</br> | </br> | ||
| + | |||
| + | |||
Latest revision as of 13:34, 19 October 2016
TOP


