Difference between revisions of "Team:ZJU-China/Model/first"
| (22 intermediate revisions by 3 users not shown) | |||
| Line 48: | Line 48: | ||
padding: 40px 200px; | padding: 40px 200px; | ||
} | } | ||
| − | + | .dcpt3{ | |
text-align: justify; | text-align: justify; | ||
| − | margin:- | + | margin:0px -1% 1px; |
| − | background-color: # | + | background-color: #e5e5e5; |
| − | + | padding: 40px 10%; | |
| + | |||
} | } | ||
.dcpt4{ | .dcpt4{ | ||
text-align: justify; | text-align: justify; | ||
| − | margin:- | + | margin:0px -1% 1px; |
background-color: #fffae6; | background-color: #fffae6; | ||
| − | + | padding: 40px 10%; | |
} | } | ||
.content3{ | .content3{ | ||
| Line 106: | Line 107: | ||
} | } | ||
.dcpt3{ | .dcpt3{ | ||
| − | margin: auto | + | margin: auto 5%; |
| − | padding: auto | + | padding: auto 5%; |
} | } | ||
.dcpt4{ | .dcpt4{ | ||
| − | margin: auto | + | margin: auto 5%; |
| − | padding: auto | + | padding: auto 5%; |
} | } | ||
| − | |||
| − | |||
| − | |||
| − | |||
| − | |||
| − | |||
| − | |||
| − | |||
| − | |||
| − | |||
| − | |||
| − | |||
| − | |||
| − | |||
| − | |||
| − | |||
| − | |||
| − | |||
| − | |||
} | } | ||
.color3{ | .color3{ | ||
| Line 146: | Line 128: | ||
} | } | ||
.subtitle{ | .subtitle{ | ||
| − | font-size: | + | font-size:20px; |
font-family: 'spr'; | font-family: 'spr'; | ||
text-align:center; | text-align:center; | ||
| Line 154: | Line 136: | ||
<body> | <body> | ||
| − | <div class="container" style="margin-top: | + | <div class="container" style="margin-top:50px"> |
| + | |||
<div class="row"> | <div class="row"> | ||
| Line 172: | Line 155: | ||
</div> | </div> | ||
| − | |||
| − | |||
| − | |||
| − | |||
</br> | </br> | ||
| + | |||
<div class="dcpt3" style="font-size:20px;line-height:1.5;font-family: 'spr';"> | <div class="dcpt3" style="font-size:20px;line-height:1.5;font-family: 'spr';"> | ||
| − | + | <div align="left" style="font-family: 'spr';font-size:40px;border-bottom:2px solid #584b4f;">Overview</div> | |
| + | </br> | ||
As our design presents, our simple cipher machine includes a light-input and light-output system. According to the reference, we have found that the intensity of GFP/RFP fluorescence is related to the intensity of the input red/green light(Ig,Ir ) the concentration of the induce substance, which is directly related to the GFP output fluorescence.</br> | As our design presents, our simple cipher machine includes a light-input and light-output system. According to the reference, we have found that the intensity of GFP/RFP fluorescence is related to the intensity of the input red/green light(Ig,Ir ) the concentration of the induce substance, which is directly related to the GFP output fluorescence.</br> | ||
Therefore, we attempt to explore the quantitative relationship between them.</br> | Therefore, we attempt to explore the quantitative relationship between them.</br> | ||
According to our design, we have combined our light-input system CcaS/R and logic AND gate system, one of whose input is a type of induces substance while the other one is controlled by light. With the change of our code book, different input substances and output substances are applied. Thus, to simplify the problem, we divide the whole model into to correlated parts, light-input and AND logic gate and build the model for only one condition, which is shown as following. | According to our design, we have combined our light-input system CcaS/R and logic AND gate system, one of whose input is a type of induces substance while the other one is controlled by light. With the change of our code book, different input substances and output substances are applied. Thus, to simplify the problem, we divide the whole model into to correlated parts, light-input and AND logic gate and build the model for only one condition, which is shown as following. | ||
| − | |||
</br> | </br> | ||
| − | <div align="center"><img src="https://static.igem.org/mediawiki/2016/ | + | </br> |
| + | <div align="center"><img src="https://static.igem.org/mediawiki/2016/4/42/ZJUDPD4.jpg" width="85%" height="80%"></div> | ||
</div> | </div> | ||
| + | <div class="subtitle" style="margin-top:-30px;"> Pic 1 The Modeling system </div> | ||
</br> | </br> | ||
</br> | </br> | ||
</br> | </br> | ||
| − | + | ||
| − | + | ||
| − | + | ||
<div class="dcpt4" style="font-size:20px;line-height:1.5;font-family: 'spr';text-align:justify;"> | <div class="dcpt4" style="font-size:20px;line-height:1.5;font-family: 'spr';text-align:justify;"> | ||
| − | <div align="left" style="font-family: 'spr';font-size:40px;"> | + | <div align="left" style="font-family: 'spr';font-size:40px;border-bottom:2px solid #584b4f;">Light-Controlled Model</div> |
In our light-input part, we tried to find the relationship between the previous light intensity and the output of the Ccas/R system. According to the reference, we’ve got the following equations: | In our light-input part, we tried to find the relationship between the previous light intensity and the output of the Ccas/R system. According to the reference, we’ve got the following equations: | ||
<div align="center"><img src="https://static.igem.org/mediawiki/2016/1/13/Light1-3.png" width="30%"></div> | <div align="center"><img src="https://static.igem.org/mediawiki/2016/1/13/Light1-3.png" width="30%"></div> | ||
| Line 206: | Line 186: | ||
<div></br> Therefore, to simplify the problem, we choose to simulate the steady-state, where Ig<I0 = 0.169W/(m^2). According to our reference, if Ig>I0, the value of <strong>c</strong> will never get steady.</div> | <div></br> Therefore, to simplify the problem, we choose to simulate the steady-state, where Ig<I0 = 0.169W/(m^2). According to our reference, if Ig>I0, the value of <strong>c</strong> will never get steady.</div> | ||
| − | <div></br> After applying some specific values of parameter, we test three groups of (p0, c), we can get three figures. Specifically, three groups of inputs are (17,80) | + | <div></br> After applying some specific values of parameter, we test three groups of (p0, c), we can get three figures. Specifically, three groups of inputs are (17,80) and (90, 60)</div> |
<div class="row" style="margin-top:20px;"> | <div class="row" style="margin-top:20px;"> | ||
<div class="col-md-6"> | <div class="col-md-6"> | ||
| − | <div align="center" style="padding-right:85px"><img src="https://static.igem.org/mediawiki/2016/c/c4/Light1.jpeg" width=" | + | <div align="center" style="padding-right:85px"><img src="https://static.igem.org/mediawiki/2016/c/c4/Light1.jpeg" width="100%"></div> |
</div> | </div> | ||
<div class="col-md-6"> | <div class="col-md-6"> | ||
| − | <div align="center" style="padding-right:85px"><img src="https://static.igem.org/mediawiki/2016/b/b7/Light3.jpeg" width=" | + | <div align="center" style="padding-right:85px"><img src="https://static.igem.org/mediawiki/2016/b/b7/Light3.jpeg" width="100%"></div> |
</div> | </div> | ||
</div> | </div> | ||
| − | <div> In the figure, blue line represents the p(t), while the red line represents g(t).</br> From the figure above we can clearly find that with time going by, both p(t) and g(t) will reach the maximum level and keep | + | <br /> |
| + | <div class="subtitle"> Pic 2 Predicted p(t) and g(t) result </div> | ||
| + | <br /> | ||
| + | <br /> | ||
| + | <div> In the figure, blue line represents the p(t), while the red line represents g(t).</br> From the figure above we can clearly find that with time going by, both p(t) and g(t) will reach the maximum level and keep steady. Besides, the maximum value is <strong>c</strong>. The result is crucial to the derivation of the integrated model of light-input model and AND logic gate model.</div> | ||
</div> | </div> | ||
| Line 223: | Line 207: | ||
</br> | </br> | ||
<div class="dcpt3" style="font-size:20px;line-height:1.5;font-family: 'spr'; text-align:justify;"> | <div class="dcpt3" style="font-size:20px;line-height:1.5;font-family: 'spr'; text-align:justify;"> | ||
| − | <div align="left" style="font-family: 'spr';font-size:40px;"> | + | <div align="left" style="font-family: 'spr';font-size:40px;border-bottom:2px solid #584b4f;">AND Logic Gate Model</div> |
According to the genetic circuit of AND logic gate together with the derivation of the original reference, we have proposed the following equation by the law of mass action and Michaelis-Menten Equation. We mainly focus on the process of the output part, the production of T7 and GFP. | According to the genetic circuit of AND logic gate together with the derivation of the original reference, we have proposed the following equation by the law of mass action and Michaelis-Menten Equation. We mainly focus on the process of the output part, the production of T7 and GFP. | ||
<div align="center"><img src="https://static.igem.org/mediawiki/2016/3/34/Light2-1.png" width="25%"></div> | <div align="center"><img src="https://static.igem.org/mediawiki/2016/3/34/Light2-1.png" width="25%"></div> | ||
| Line 234: | Line 218: | ||
<div class="dcpt4" style="font-size:20px;line-height:1.5;font-family: 'spr';text-align:justify;"> | <div class="dcpt4" style="font-size:20px;line-height:1.5;font-family: 'spr';text-align:justify;"> | ||
| − | <div align="left" style="font-family: 'spr';font-size:40px;"> | + | <div align="left" style="font-family: 'spr';font-size:40px;border-bottom:2px solid #584b4f;">Integrated Model</div> |
In the integrated model, we have constructed the system as Pic1 shows. For the reason that the light-input system we used, DPD-induced system has the same mechanism of CcaS/R system, so we use two crucial assumptions:</br> | In the integrated model, we have constructed the system as Pic1 shows. For the reason that the light-input system we used, DPD-induced system has the same mechanism of CcaS/R system, so we use two crucial assumptions:</br> | ||
(1) The expression of the sfGFP, which is the output substance of the first gene circuit, was equal to the concentration of the input substance of the AND logic gate. That is, I1(t)=g(t) .</br> | (1) The expression of the sfGFP, which is the output substance of the first gene circuit, was equal to the concentration of the input substance of the AND logic gate. That is, I1(t)=g(t) .</br> | ||
| − | (2) The maximum value of g(t) is c(p0), and we get the function after the enough long time. That is, we take when we calculate the steady state of y, which is the concentration of GFP as mentioned above.</br> | + | (2) The maximum value of g(t) is c(p0), and we get the function after the enough long time. That is, we take <img src="https://static.igem.org/mediawiki/2016/2/29/Light3-4.png" width="60px;">when we calculate the steady state of y, which is the concentration of GFP as mentioned above.</br> |
| − | Therefore, based on the equation , we can derive the following | + | Therefore, based on the equation , we can derive the following equation: |
</br> | </br> | ||
<div align="center"> | <div align="center"> | ||
| Line 247: | Line 231: | ||
where I1(t)=g(t), and K1, K2 is coefficient derived from the equation (). Because the intensity of GFP fluorescence is proportional to the concentration of GFP protein, y , we try to get the function as y=F(I1,I2,t) . However, y changes with time going by, which greatly increases the difficulty of presenting the results.</br> | where I1(t)=g(t), and K1, K2 is coefficient derived from the equation (). Because the intensity of GFP fluorescence is proportional to the concentration of GFP protein, y , we try to get the function as y=F(I1,I2,t) . However, y changes with time going by, which greatly increases the difficulty of presenting the results.</br> | ||
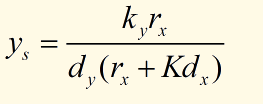
| − | Therefore, we try to simplify the equation. We find that when t get larger , y would get closer to a steady state value, which is defined as ys , and the function can be simplified as ys=f(I1,I2) . We have demonstrated that , but I2 is still difficult to measure, so we simplify the function using the concentration of DPD. Thus, we have constructed the relationship between the two inputs (DPD and green light) and one output (GFP).</br> | + | Therefore, we try to simplify the equation. We find that when t get larger , y would get closer to a steady state value, which is defined as ys , and the function can be simplified as <i>ys=f(I1,I2)</i> . We have demonstrated that , but I2 is still difficult to measure, so we simplify the function using the concentration of DPD. Thus, we have constructed the relationship between the two inputs (DPD and green light) and one output (GFP).</br> |
Suppose <img src="https://static.igem.org/mediawiki/2016/d/de/Light3-5.png" width="60px"> , we can get the steady-state solution that</br> | Suppose <img src="https://static.igem.org/mediawiki/2016/d/de/Light3-5.png" width="60px"> , we can get the steady-state solution that</br> | ||
<div align="center"> | <div align="center"> | ||
<img src="https://static.igem.org/mediawiki/2016/1/1a/Light3-3.png" width="30%"> | <img src="https://static.igem.org/mediawiki/2016/1/1a/Light3-3.png" width="30%"> | ||
</div> | </div> | ||
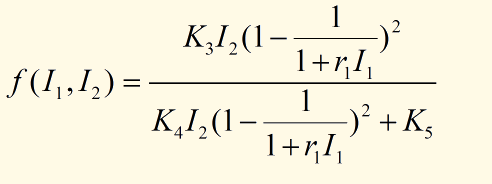
| − | Here, K3, K4, K5 are the coefficients that are related to rx, d, etc. Using MATLAB, we can get the three-dimensional figure: ( Shown in Pic3) | + | Here, K3, K4, K5 are the coefficients that are related to rx, d, etc. Using MATLAB and taking different values of the coefficients, we can get the three-dimensional figure: ( Shown in Pic3) |
<div align="center"> | <div align="center"> | ||
<img src="https://static.igem.org/mediawiki/2016/b/bd/Integrated_Model.jpeg" width="60%"> | <img src="https://static.igem.org/mediawiki/2016/b/bd/Integrated_Model.jpeg" width="60%"> | ||
</div> | </div> | ||
| + | <br /> | ||
<div class="subtitle"> | <div class="subtitle"> | ||
Pic 3 Predicted GFP abundance of Integrated Model | Pic 3 Predicted GFP abundance of Integrated Model | ||
</div> | </div> | ||
| + | <br /> | ||
| + | <br /> | ||
From the integrated model we can conclude that our model successfully simulates the results of our light-controlled and AND logic gate experiment. Besides, Pic3 also shows the character of AND logic gate, where the system is only ON when all of the inputs are ON. | From the integrated model we can conclude that our model successfully simulates the results of our light-controlled and AND logic gate experiment. Besides, Pic3 also shows the character of AND logic gate, where the system is only ON when all of the inputs are ON. | ||
</div> | </div> | ||
</body> | </body> | ||
| − | <div class="color3"> | + | <div class="color3" style="margin-left:-15px;"> |
<address> | <address> | ||
<strong>Twitter, Inc.</strong><br> | <strong>Twitter, Inc.</strong><br> | ||
| Line 273: | Line 260: | ||
<address> | <address> | ||
<strong>Full Name</strong><br> | <strong>Full Name</strong><br> | ||
| − | <a href="mailto:#"> | + | <a href="mailto:#">igem_zjuchina_2016@outlook.com</a> |
</address> | </address> | ||
Latest revision as of 13:56, 19 October 2016

Light&Logic Gate Model
Overview
As our design presents, our simple cipher machine includes a light-input and light-output system. According to the reference, we have found that the intensity of GFP/RFP fluorescence is related to the intensity of the input red/green light(Ig,Ir ) the concentration of the induce substance, which is directly related to the GFP output fluorescence.
Therefore, we attempt to explore the quantitative relationship between them.
According to our design, we have combined our light-input system CcaS/R and logic AND gate system, one of whose input is a type of induces substance while the other one is controlled by light. With the change of our code book, different input substances and output substances are applied. Thus, to simplify the problem, we divide the whole model into to correlated parts, light-input and AND logic gate and build the model for only one condition, which is shown as following.
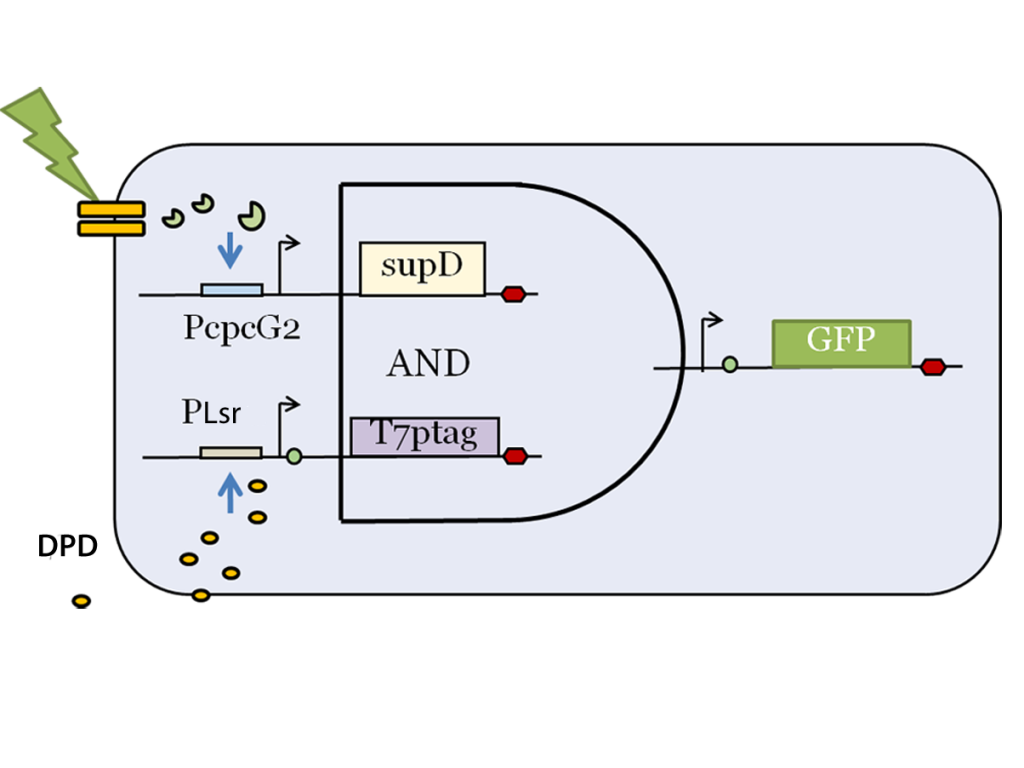
Pic 1 The Modeling system
Light-Controlled Model
In our light-input part, we tried to find the relationship between the previous light intensity and the output of the Ccas/R system. According to the reference, we’ve got the following equations:
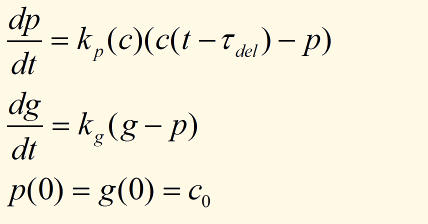
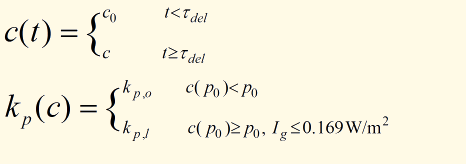
Therefore, to simplify the problem, we choose to simulate the steady-state, where Ig<I0 = 0.169W/(m^2). According to our reference, if Ig>I0, the value of c will never get steady.
After applying some specific values of parameter, we test three groups of (p0, c), we can get three figures. Specifically, three groups of inputs are (17,80) and (90, 60)
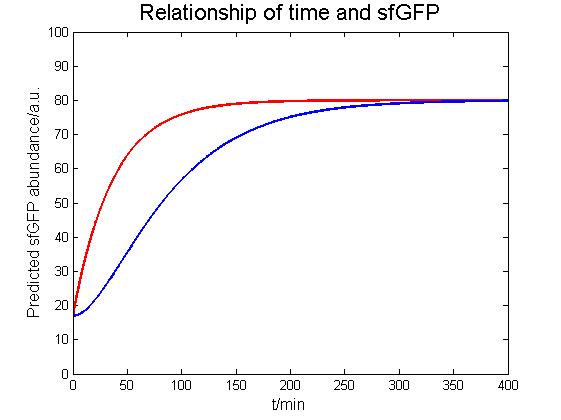
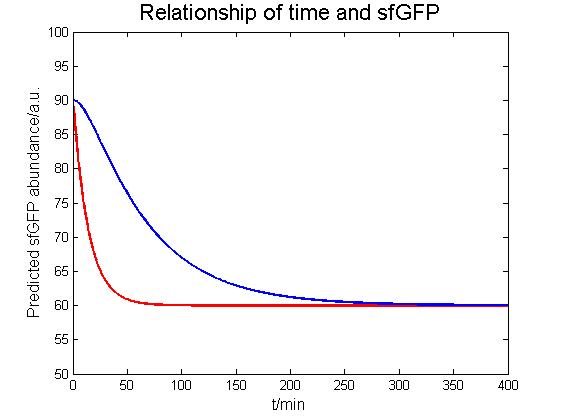
Pic 2 Predicted p(t) and g(t) result
In the figure, blue line represents the p(t), while the red line represents g(t). From the figure above we can clearly find that with time going by, both p(t) and g(t) will reach the maximum level and keep steady. Besides, the maximum value is c. The result is crucial to the derivation of the integrated model of light-input model and AND logic gate model.
AND Logic Gate Model
According to the genetic circuit of AND logic gate together with the derivation of the original reference, we have proposed the following equation by the law of mass action and Michaelis-Menten Equation. We mainly focus on the process of the output part, the production of T7 and GFP.
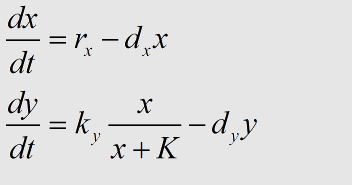
Here, x(t) represents the concentration of T7 RNA polymerase, y(t) represents the concentration of GFP. rx represents the rate of production of activator protein. After our derivation, we can prove that
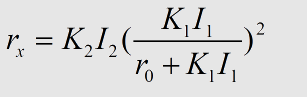
where K1, K2 are the coefficient related with the concentration of T7 mRNA, I1, I2 is relative to the concentration of two input substances(In our system, Arbc.), and r0 the rate of termination of the translation.
Integrated Model
In the integrated model, we have constructed the system as Pic1 shows. For the reason that the light-input system we used, DPD-induced system has the same mechanism of CcaS/R system, so we use two crucial assumptions:
(1) The expression of the sfGFP, which is the output substance of the first gene circuit, was equal to the concentration of the input substance of the AND logic gate. That is, I1(t)=g(t) .
(2) The maximum value of g(t) is c(p0), and we get the function after the enough long time. That is, we take 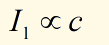 when we calculate the steady state of y, which is the concentration of GFP as mentioned above.
Therefore, based on the equation , we can derive the following equation:
when we calculate the steady state of y, which is the concentration of GFP as mentioned above.
Therefore, based on the equation , we can derive the following equation:
 , we can get the steady-state solution that
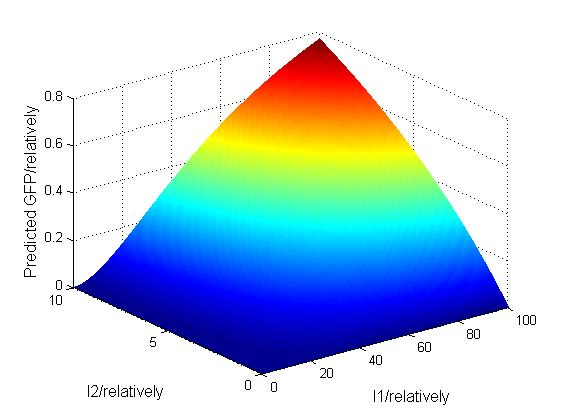
Pic 3 Predicted GFP abundance of Integrated Model
From the integrated model we can conclude that our model successfully simulates the results of our light-controlled and AND logic gate experiment. Besides, Pic3 also shows the character of AND logic gate, where the system is only ON when all of the inputs are ON.
Twitter, Inc.
795 Folsom Ave, Suite 600
San Francisco, CA 94107
Phone: (123) 456-7890 Full Name
igem_zjuchina_2016@outlook.com
795 Folsom Ave, Suite 600
San Francisco, CA 94107
Phone: (123) 456-7890 Full Name
igem_zjuchina_2016@outlook.com