Qiuxinyuan12 (Talk | contribs) |
Qiuxinyuan12 (Talk | contribs) |
||
| Line 478: | Line 478: | ||
</br> | </br> | ||
</html> | </html> | ||
| − | [[File:T--NUDT CHINA-- | + | [[File:T--NUDT CHINA--designfig2.jpg|700px|center]] |
<html> | <html> | ||
</br> | </br> | ||
| Line 545: | Line 545: | ||
T7 promoter. The complete zinc finger protein was to stimulate a PPI positive | T7 promoter. The complete zinc finger protein was to stimulate a PPI positive | ||
situation, while the split one was to stimulate a PPI negative situation | situation, while the split one was to stimulate a PPI negative situation | ||
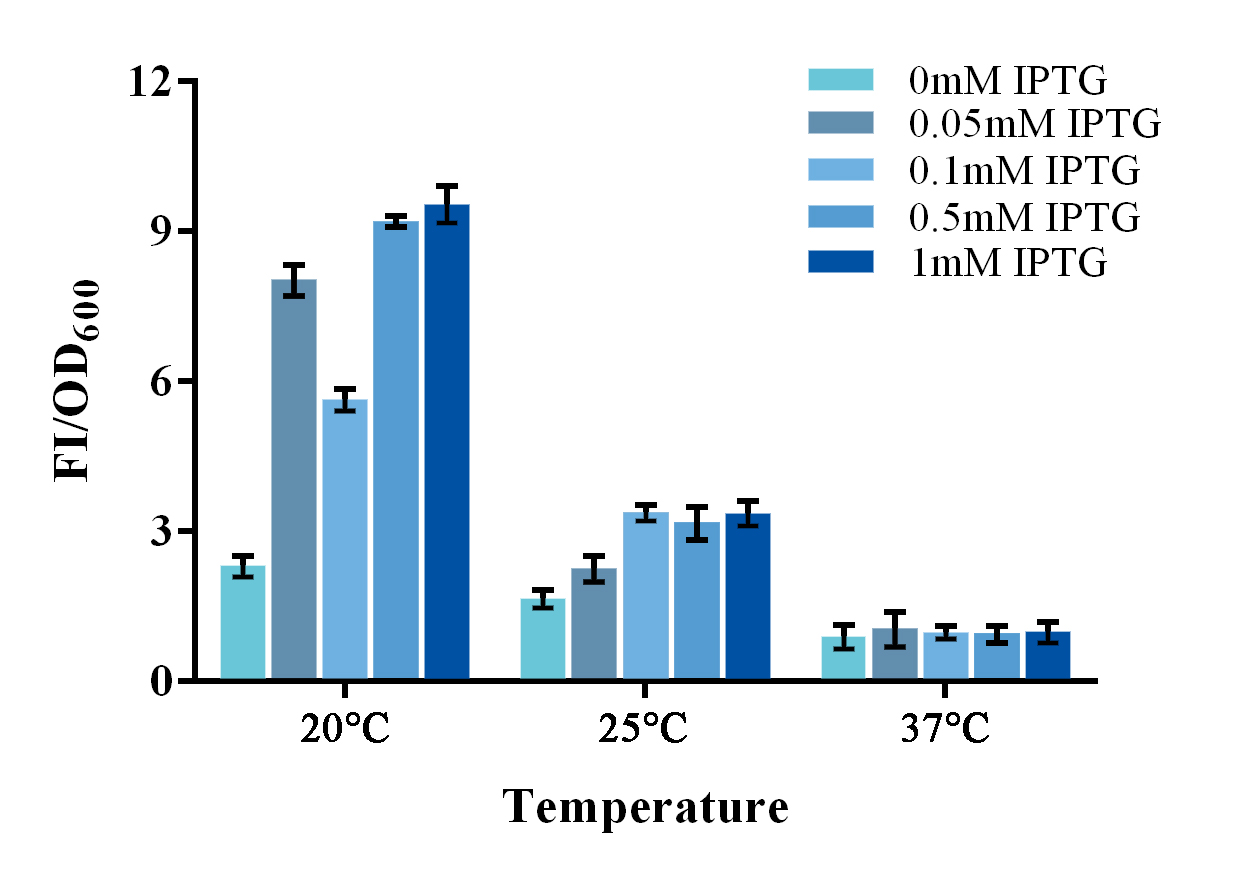
| − | + | . Fluorescence signal was detected by a microplate reader after an | |
overnight culture under various conditions.</span><span style="line-height:2;font-family:Perpetua;font-size:18px;"> </span><span style="line-height:2;font-family:Perpetua;font-size:18px;">Relative fluorescence intensity was then calculated with normalization | overnight culture under various conditions.</span><span style="line-height:2;font-family:Perpetua;font-size:18px;"> </span><span style="line-height:2;font-family:Perpetua;font-size:18px;">Relative fluorescence intensity was then calculated with normalization | ||
of OD</span><sub><span style="line-height:2;font-family:Perpetua;font-size:18px;">600</span></sub><span style="line-height:2;font-family:Perpetua;font-size:18px;"> value. The relative fluorescence intensity of each control | of OD</span><sub><span style="line-height:2;font-family:Perpetua;font-size:18px;">600</span></sub><span style="line-height:2;font-family:Perpetua;font-size:18px;"> value. The relative fluorescence intensity of each control | ||
group was set arbitrarily at 1.0 (data not shown), and the levels of the other | group was set arbitrarily at 1.0 (data not shown), and the levels of the other | ||
| − | groups were adjusted correspondingly. Results shown a better SNR under 20</span><span style="line-height:2;font-family:Perpetua;font-size:18px;">℃</span><span style="line-height:2;font-family:Perpetua;font-size:18px;"> and 0.5mM IPTG induction (Figure | + | groups were adjusted correspondingly. Results shown a better SNR under 20</span><span style="line-height:2;font-family:Perpetua;font-size:18px;">℃</span><span style="line-height:2;font-family:Perpetua;font-size:18px;"> and 0.5mM IPTG induction (Figure 3). Thus indicating that better performance |
of such system could be expected under lower culturing temperature.</span> | of such system could be expected under lower culturing temperature.</span> | ||
</p> | </p> | ||
| Line 555: | Line 555: | ||
<span style="line-height:2;font-family:Perpetua;font-size:18px;"> </span> | <span style="line-height:2;font-family:Perpetua;font-size:18px;"> </span> | ||
</p> | </p> | ||
| + | |||
| + | </br> | ||
| + | </html> | ||
| + | [[File:T--NUDT CHINA--introfig3.jpg|700px|center]] | ||
| + | <html> | ||
| + | </br> | ||
<p> | <p> | ||
| − | <b><span style="line-height:2;font-family:Perpetua;font-size:18px;">Figure | + | <b><span style="line-height:2;font-family:Perpetua;font-size:18px;">Figure 3. Evaluation of the split-GFP system under different expression condition. </span></b> |
| − | 3 | + | |
| − | + | ||
| − | condition. </span></b> | + | |
</p> | </p> | ||
<p> | <p> | ||
| − | <span style="line-height:2;font-family:Perpetua;font-size: | + | <span style="line-height:2;font-family:Perpetua;font-size:16px;">Relative fluorescence intensity was calculated with normalization of the OD600 value. The relative fluorescence intensity of each control group was set arbitrarily at 1.0 (data not shown), and the levels of the other groups were adjusted correspondingly. Green fluorescence was measured under 488nm of excitation and 538nm of emission. This experiment was run in three parallel reactions, and the data represent results obtained from at least three independent experiments. *p<0.05, **p<0.01.</span> |
| − | calculated with normalization of the OD600 value. The relative fluorescence | + | |
| − | intensity of each control group was set arbitrarily at 1.0 (data not shown), | + | |
| − | and the levels of the other groups were adjusted correspondingly. This | + | |
| − | experiment was run in three parallel reactions, and the data represent results | + | |
| − | obtained from at least three independent experiments. *p | + | |
| − | + | ||
| − | + | ||
| − | + | ||
| − | + | ||
| − | + | ||
| − | + | ||
</p> | </p> | ||
| + | </br> | ||
| + | |||
<p style="text-indent:6.5pt;"> | <p style="text-indent:6.5pt;"> | ||
<span style="line-height:2;font-family:Perpetua;font-size:18px;">2.</span><span style="line-height:2;font-family:Perpetua;font-size:18px;"> </span><span style="line-height:2;font-family:Perpetua;font-size:18px;">To | <span style="line-height:2;font-family:Perpetua;font-size:18px;">2.</span><span style="line-height:2;font-family:Perpetua;font-size:18px;"> </span><span style="line-height:2;font-family:Perpetua;font-size:18px;">To | ||
| Line 587: | Line 581: | ||
<span style="line-height:2;font-family:Perpetua;font-size:18px;"> </span> | <span style="line-height:2;font-family:Perpetua;font-size:18px;"> </span> | ||
</p> | </p> | ||
| − | < | + | |
| − | <b><span style="line-height:2;font-family:Perpetua;font-size:18px;"> | + | |
| − | 4 | + | |
| + | </br> | ||
| + | </html> | ||
| + | [[File:T--NUDT CHINA--introfig4.jpg|900px|center]] | ||
| + | <html> | ||
| + | </br> | ||
| + | <p> | ||
| + | <b><span style="line-height:2;font-family:Perpetua;font-size:18px;">Figure 4 Evaluation of two different split-GFP systems.</span></b> | ||
</p> | </p> | ||
| + | <p> | ||
| + | <span style="line-height:2;font-family:Perpetua;font-size:16px;">Relative fluorescence intensity was calculated with normalization of the OD600 value. For Relative FI ratios, relative fluorescence intensity of each control group was set arbitrarily at 1.0, and the levels of the other groups were adjusted correspondingly. This experiment was run in three parallel reactions, and the data represent results obtained from at least three independent experiments. *p<0.05, **p<0.01.</span> | ||
| + | </p> | ||
| + | </br> | ||
| + | |||
| + | |||
| + | |||
<p style="text-indent:22pt;"> | <p style="text-indent:22pt;"> | ||
<span style="line-height:2;font-family:Perpetua;font-size:18px;"> </span> | <span style="line-height:2;font-family:Perpetua;font-size:18px;"> </span> | ||
| Line 681: | Line 689: | ||
<span style="line-height:2;font-family:Perpetua;font-size:18px;"> </span> | <span style="line-height:2;font-family:Perpetua;font-size:18px;"> </span> | ||
</p> | </p> | ||
| − | |||
| − | |||
Revision as of 13:14, 16 October 2016


