m (Add model link) |
|||
| Line 28: | Line 28: | ||
<p> When glucose is added, some related compound will decrease during the reaction chain, and finally the concentration of activated CRP will also decrease, which means the CRP inhibited promoter Pl can express more following gene with the addition of glucose.</p> | <p> When glucose is added, some related compound will decrease during the reaction chain, and finally the concentration of activated CRP will also decrease, which means the CRP inhibited promoter Pl can express more following gene with the addition of glucose.</p> | ||
<p>Obviously, the concentration of adding glucose and the activated CRP have negative correlation. But if we want to assay the concentration of inputted glucose numerically, we have to derive a formula base on these chemical pathways.</p> | <p>Obviously, the concentration of adding glucose and the activated CRP have negative correlation. But if we want to assay the concentration of inputted glucose numerically, we have to derive a formula base on these chemical pathways.</p> | ||
| − | <p>(<a href="">Read more...</a>)</p> | + | <p>(<a href="/Team:NCKU_Tainan/Model_Fitting_Theory">Read more...</a>)</p> |
<div class="title-line" id="statistics">Statistics Analysis</div> | <div class="title-line" id="statistics">Statistics Analysis</div> | ||
| Line 46: | Line 46: | ||
<p>First, we prove that there has difference between 0.1mM/L and 5mM/L (120mM/L) in the paired-difference T test part. And, we use the regression and prediction intervals to distinguish exceeding 120mM/L and 5mM/L from exceeding 0.1mM/L. From the result, 5mM/L can be distinguished from 0.1mM/L after 101 minutes, and 120mM/L can be distinguished from 0.1mM/L after 88 minutes.</p> | <p>First, we prove that there has difference between 0.1mM/L and 5mM/L (120mM/L) in the paired-difference T test part. And, we use the regression and prediction intervals to distinguish exceeding 120mM/L and 5mM/L from exceeding 0.1mM/L. From the result, 5mM/L can be distinguished from 0.1mM/L after 101 minutes, and 120mM/L can be distinguished from 0.1mM/L after 88 minutes.</p> | ||
| − | <p>(<a href="">Read more...</a>)</p> | + | <p>(<a href="/Team:NCKU_Tainan/Model_Statistics_Analysis">Read more...</a>)</p> |
</div> | </div> | ||
<div class="col-md-3"> | <div class="col-md-3"> | ||
Revision as of 07:45, 9 October 2016
U.coli uses promoter Pl, which can be inhibited by CRP and indirectly induced by glucose, to produce fluorescent protein. Because the process that glucose induces the promoter is not a direct process, there are a lot of compound involve in it and form a network.
This network is composed of two main systems: glucose digest system and CRP activation system, which are competitive to each other.
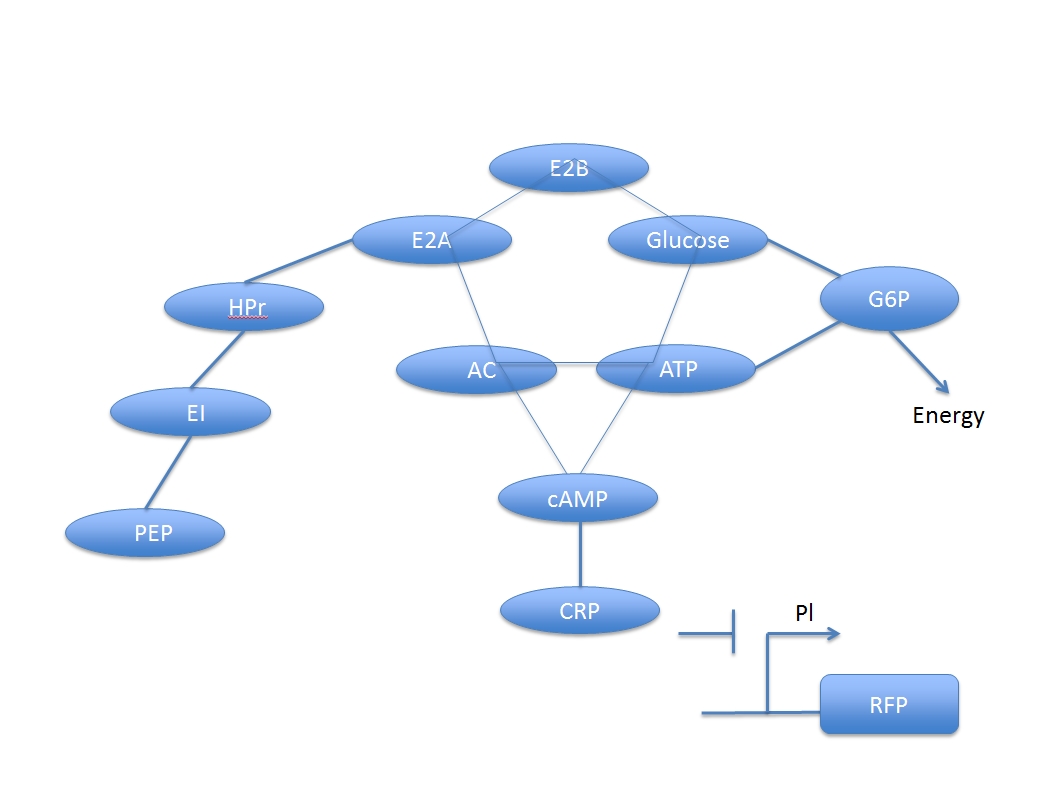
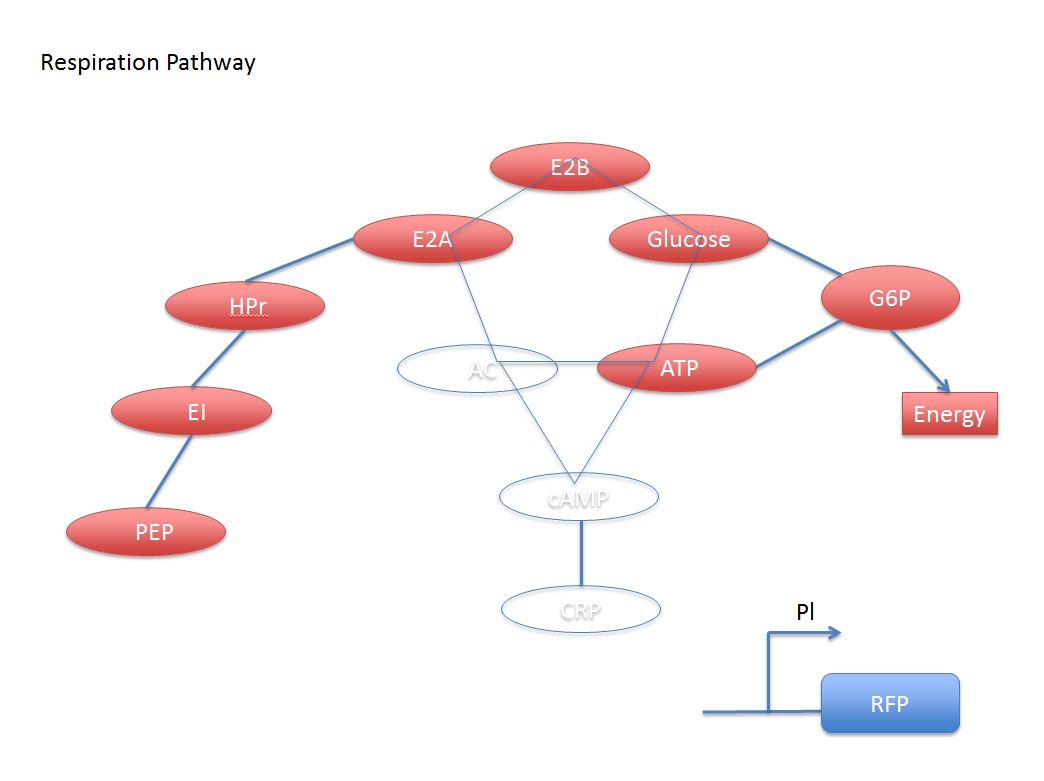
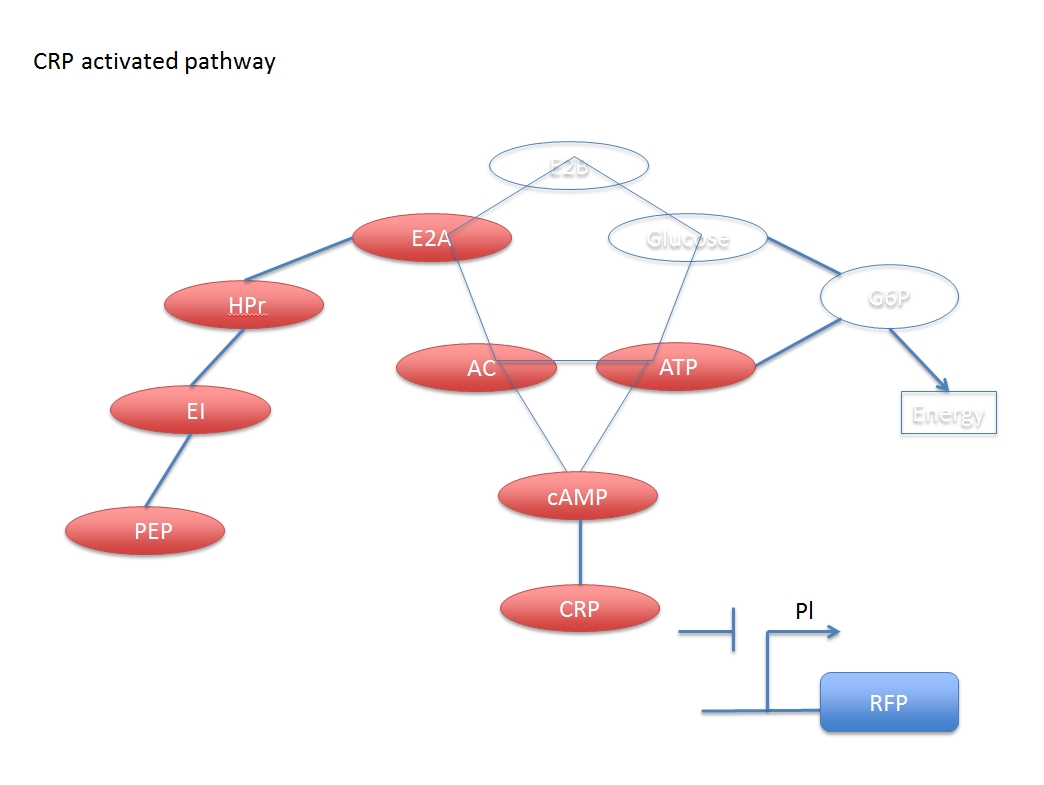
When glucose is added, some related compound will decrease during the reaction chain, and finally the concentration of activated CRP will also decrease, which means the CRP inhibited promoter Pl can express more following gene with the addition of glucose.
Obviously, the concentration of adding glucose and the activated CRP have negative correlation. But if we want to assay the concentration of inputted glucose numerically, we have to derive a formula base on these chemical pathways.
In medicine, the blood glucose exceeding 5mM/L implies having diabetes, and it exceeding 120mM/L implies being a severe patient. Finding the person whose glucose concentration is over 5mM/L or 120mM/L is our target.
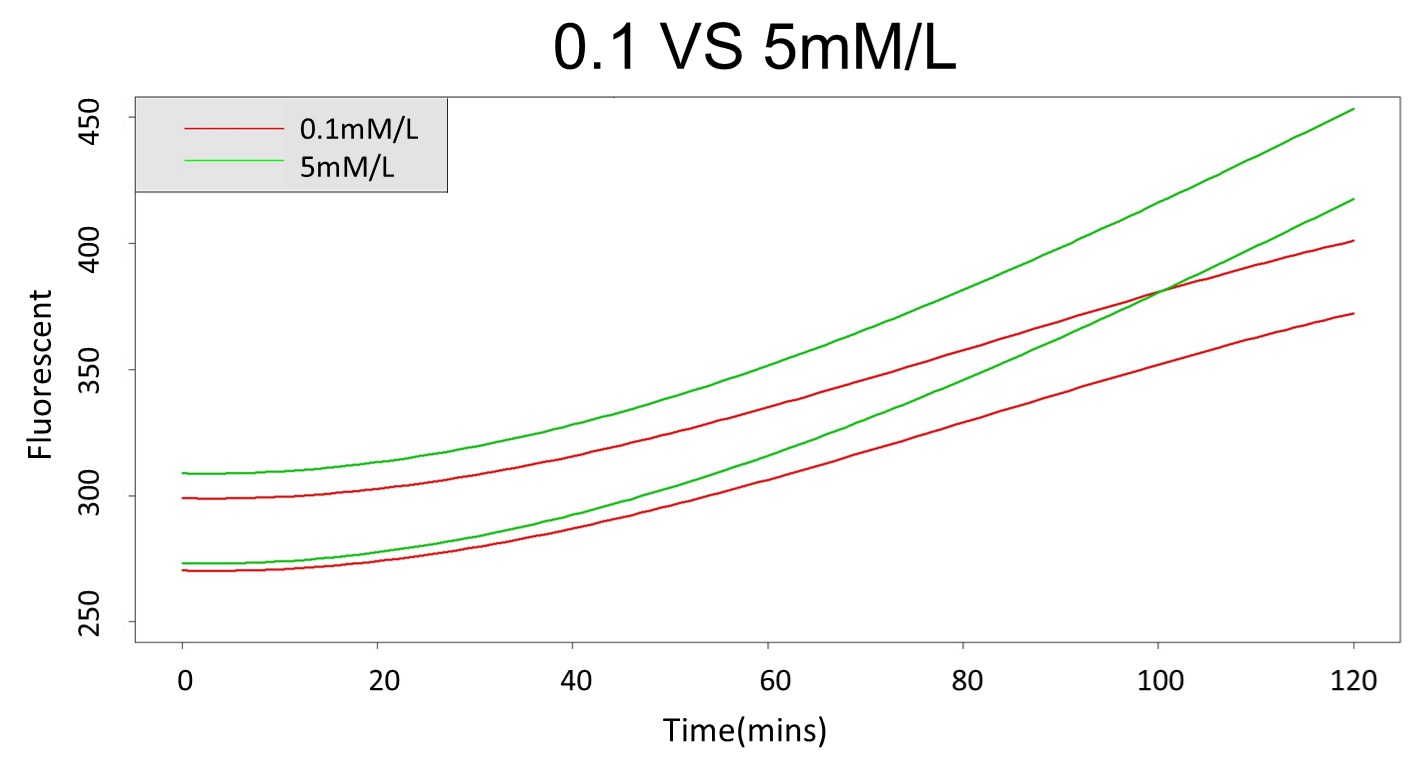

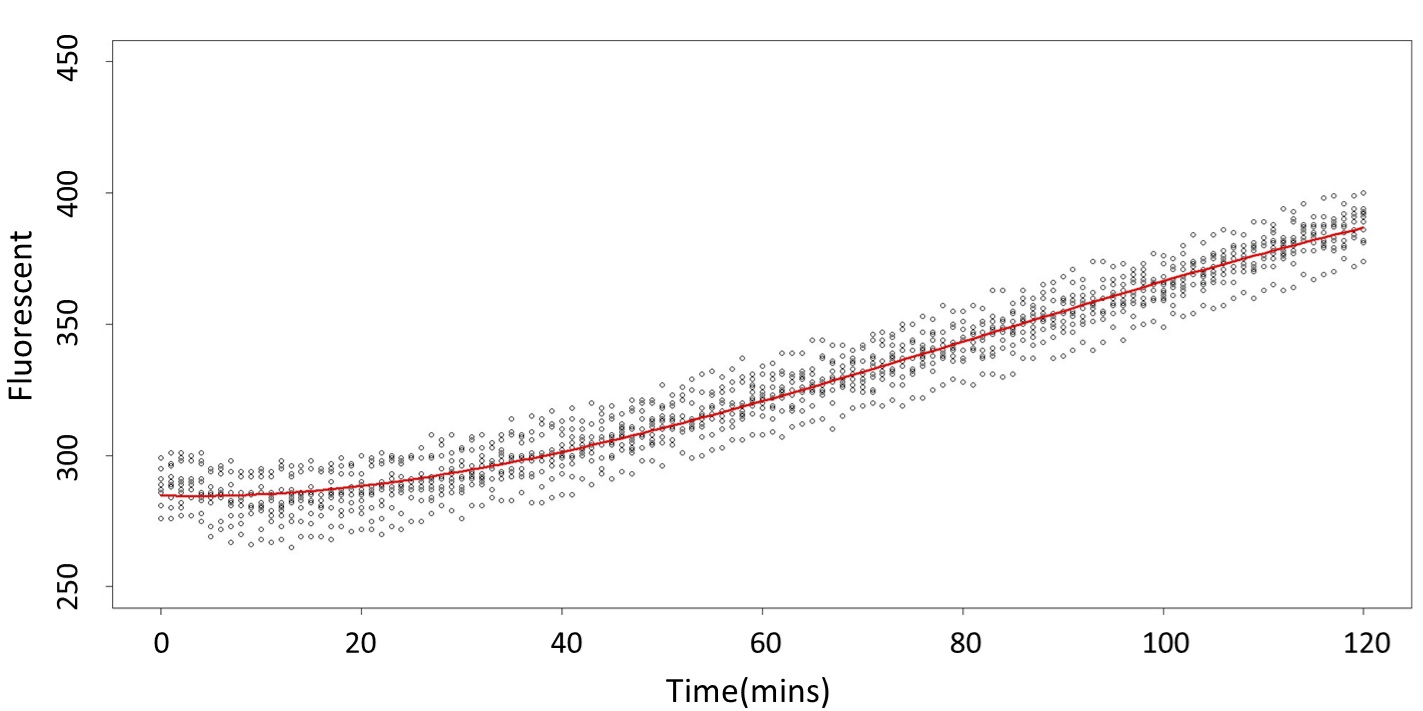
First, we prove that there has difference between 0.1mM/L and 5mM/L (120mM/L) in the paired-difference T test part. And, we use the regression and prediction intervals to distinguish exceeding 120mM/L and 5mM/L from exceeding 0.1mM/L. From the result, 5mM/L can be distinguished from 0.1mM/L after 101 minutes, and 120mM/L can be distinguished from 0.1mM/L after 88 minutes.

