Team:NCKU Tainan/Model
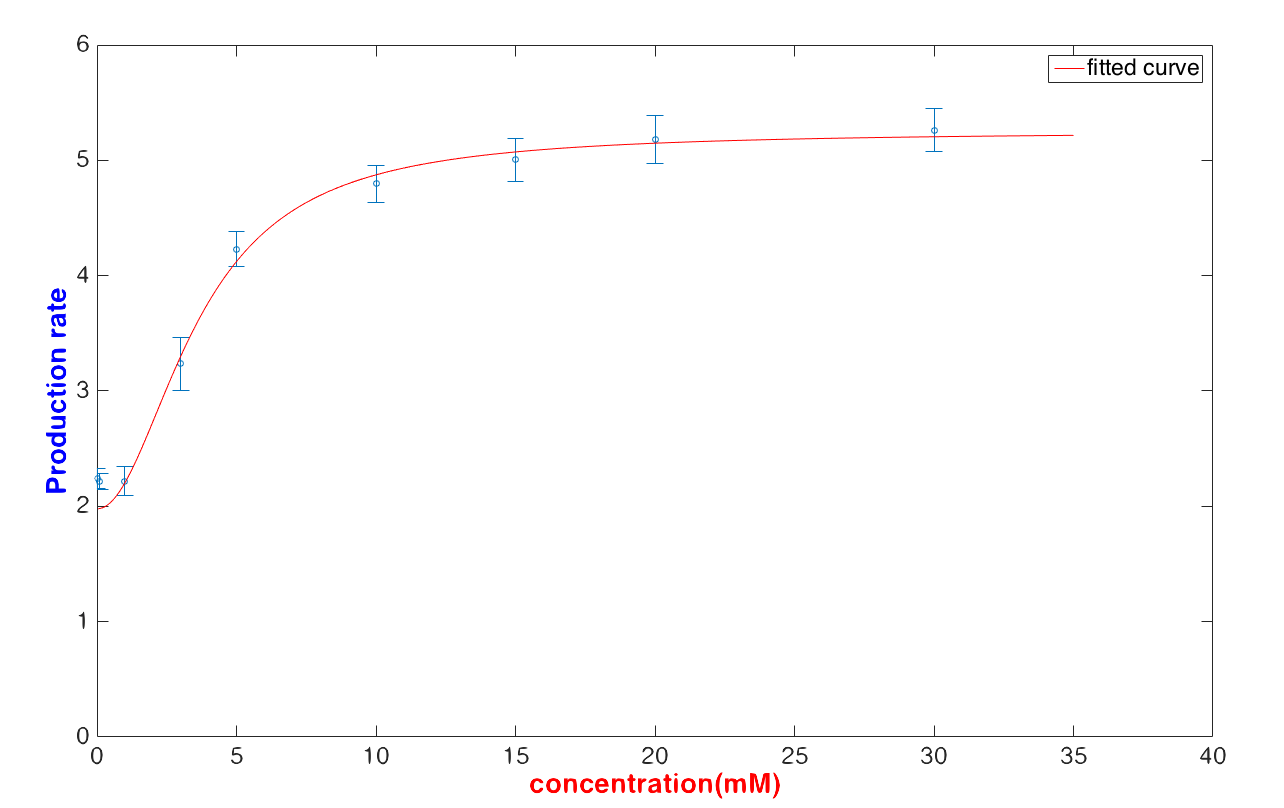
When all compounds reach its steady concentration, the production rate of protein should be a constant and be in form as the following equation:
[Protein]dt=c1[Glucose]+c2[Glucose]+c3
And the fitting result also show its accuracy and limitation:
In medicine, when the presence of urine glucose exceeds 5 mM, it implies pre-diabetes or diabetes. However, we refer to people whose urine glucose exceeds 120 mM as sever diabetic patients. Consequently, finding the person whose urine glucose concentration is over 5 mM or 120 mM is our target for prevention and early detection.
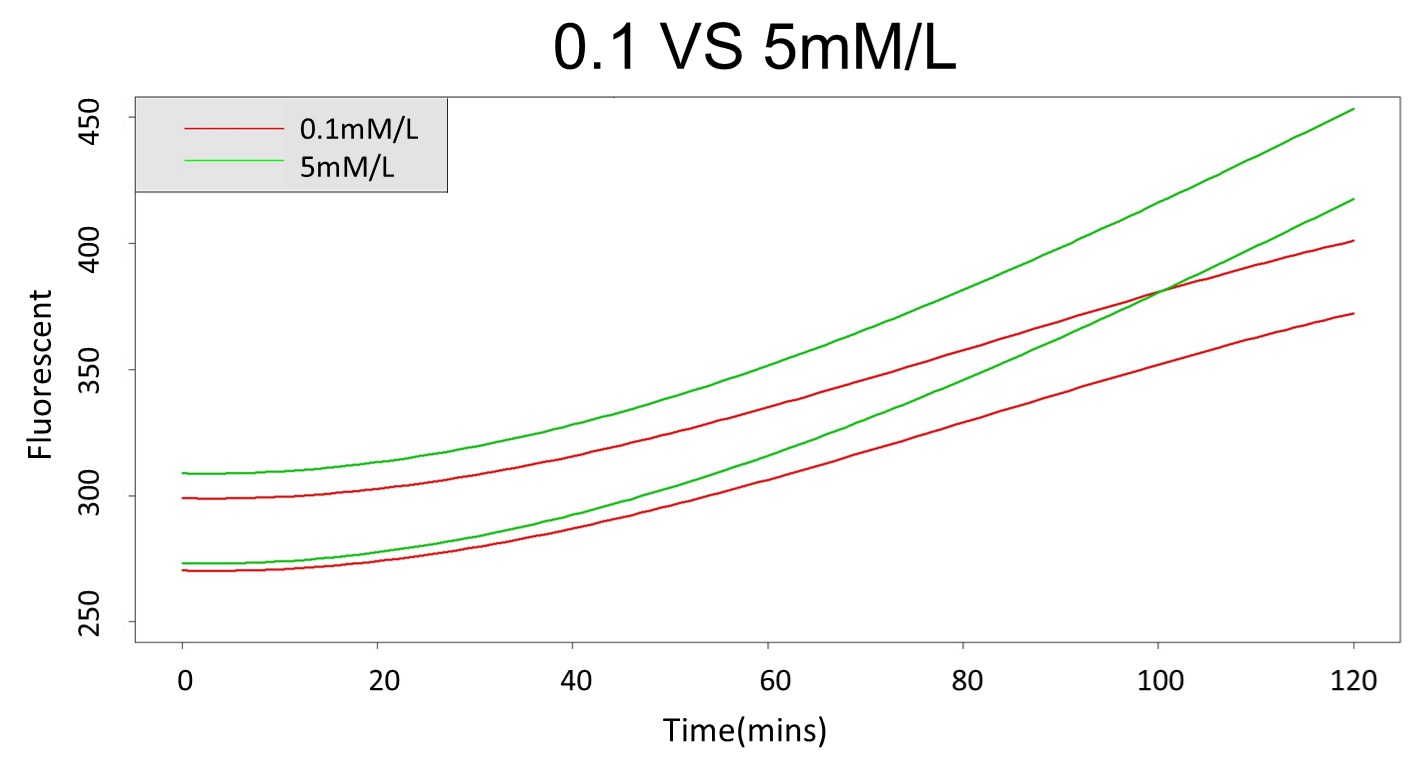
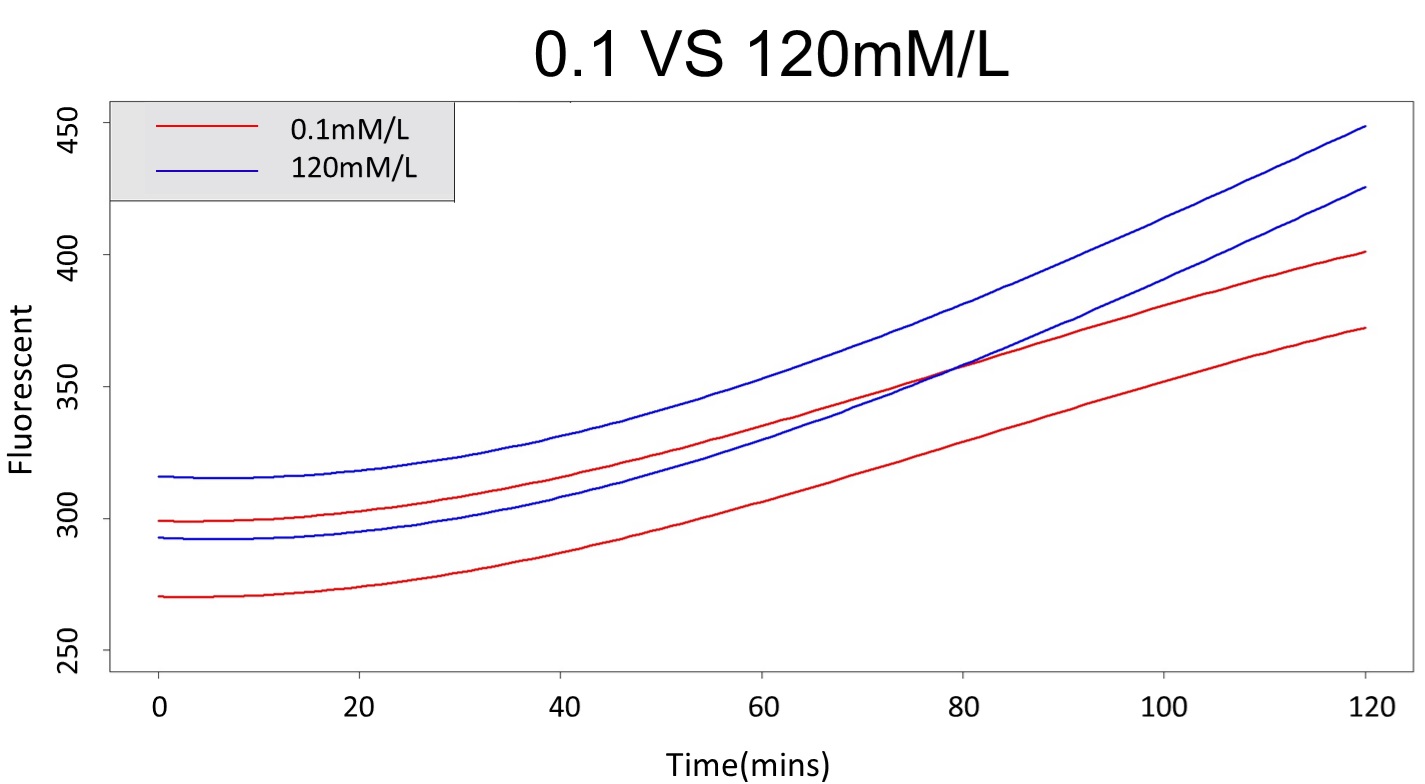
First, we prove that there is a difference between 0.1 mM and 5 mM (120 mM) in the paired-difference T test part. And, we use the regression and prediction intervals to distinguish exceeding 120 mM and 5 mM from exceeding 0.1 mM. From the result, 5 mM can be distinguished from 0.1 mM after 101 minutes, and 120 mM can be distinguished from 0.1 mM after 88 minutes.