Team:NCKU Tainan/Model Fitting Theory
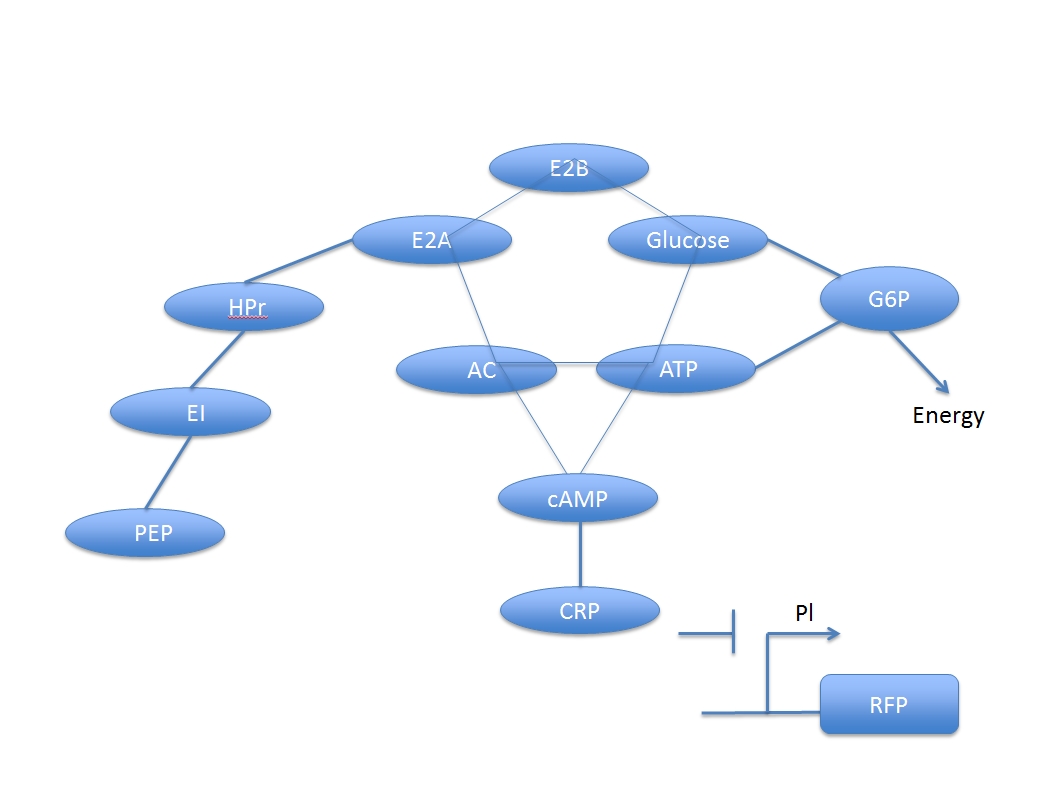
U. coli uses promoter Pl, inhibited by CRP and indirectly induced by glucose, to produce fluorescent protein. Because the process for this glucose-induced promoter is not a direct process, there are a lot of compounds involving and to form a network.
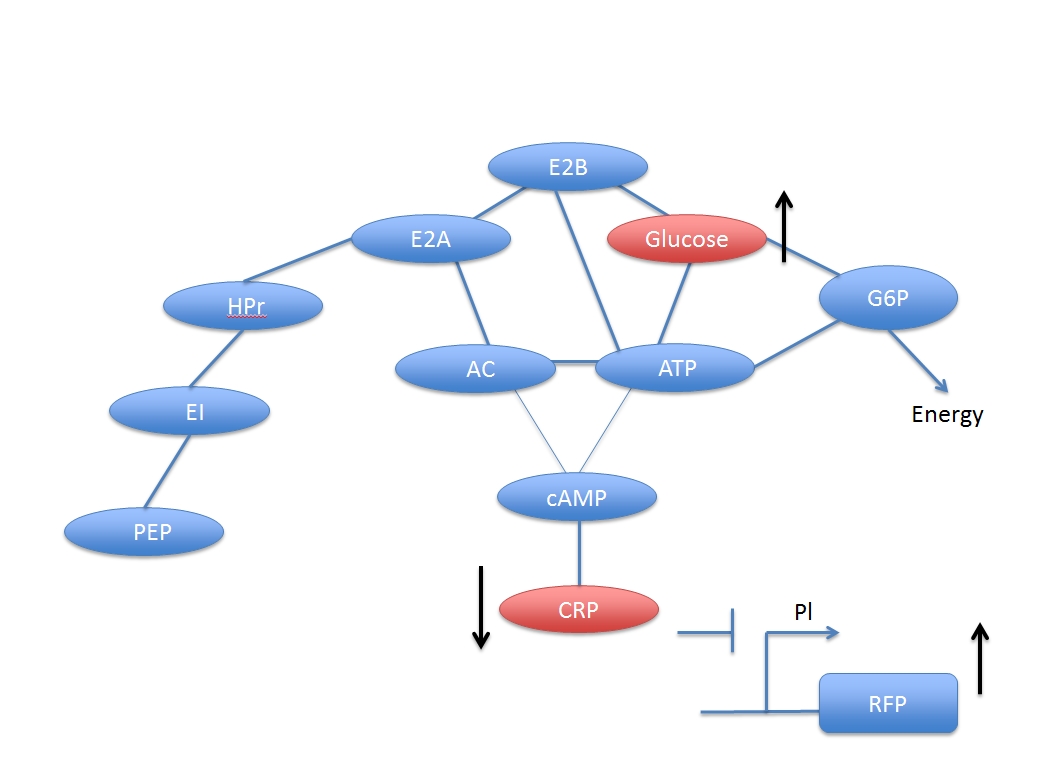
There are two main system in this process: glucose digest system and CRP activation system. The two are competitive to each other.
When glucose is added, some related compounds decrease in the reaction chain which reduce the concentration of activated CRP. Then, the promoter PI inhibited by CRP initiates the transcription of the gene and enhances the gene’s expression.
The downstream genes can be expressed more explicitly by PI, the CRP inhibited promoter.
In other words, the increased concentration by adding glucose and the activated CRP have a negative response. But if we want to assay the concentration of the added glucose numerically, we have to derive a formula based on the two networks.
According to reference (1), we can list the following reaction to simply represent the reaction chain involve in the whole process.
$$(PEP-Pi)+E1\leftrightarrow PEP+(E1-Pi)$$
$$(E_1-Pi)+HPr\leftrightarrow E_1+(HPr-Pi)$$
$$(HPr-Pi)+E2A\leftrightarrow (E2A-Pi)+HPr$$
when glucose is added:
$$(E2A-Pi)+E2B\leftrightarrow E2A+(E2B-Pi)\ \ \ \ \ \ \ \ ---(A)$$
$$(E2B-Pi)+Glucose\overset{E2C}{\rightarrow} E2B+G6P\ \ \ \ \ \ \ \ ---(B)$$
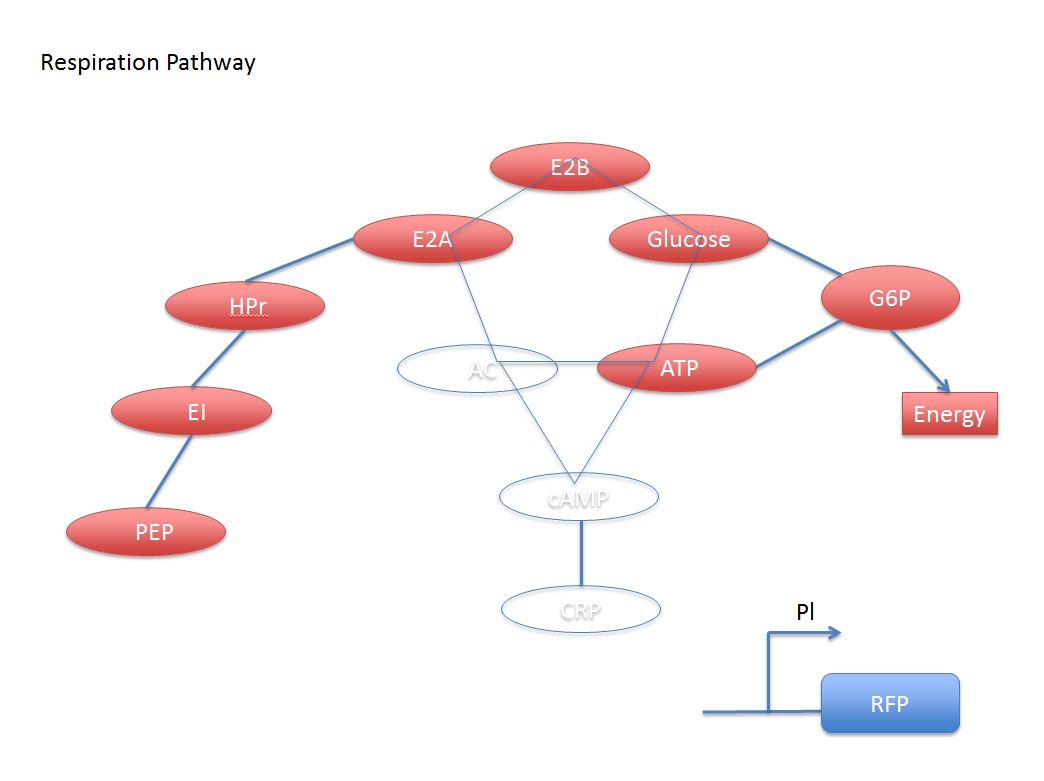
$$G6P\underset{Respiration}{\rightarrow}Energy\ \ \ \ \ \ \ \ ---(C)$$
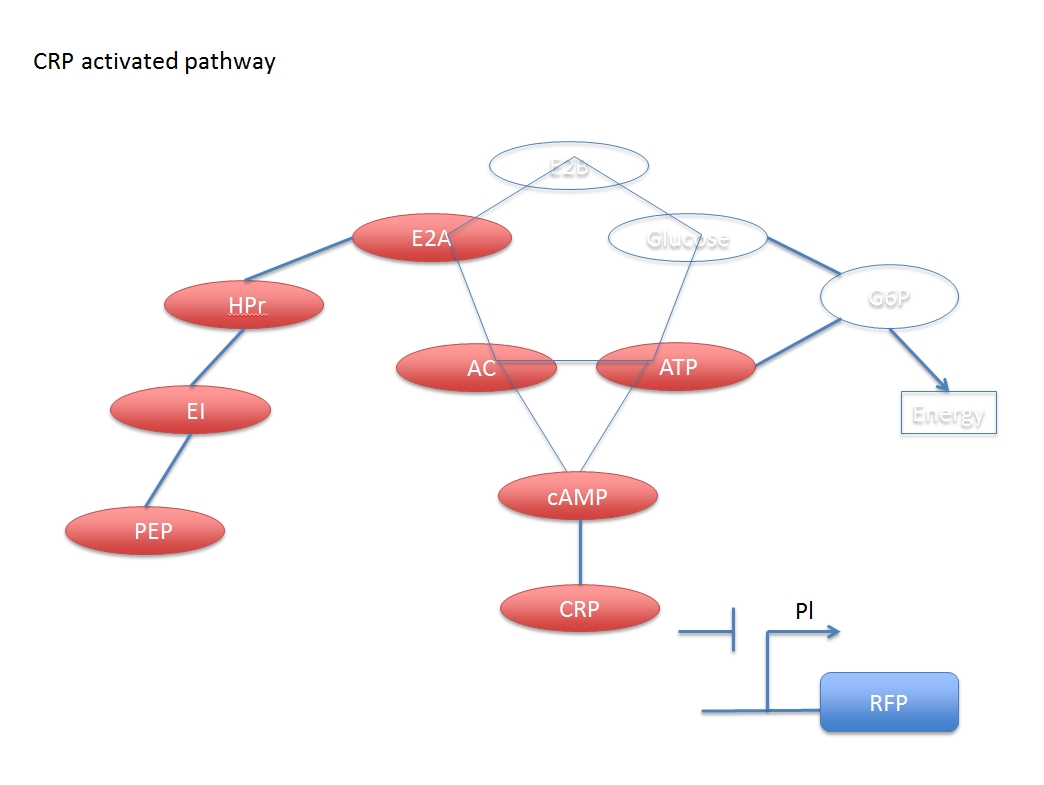
The CRP inhibiting pathway:
$$(E2A-Pi)+AC\leftrightarrow E2A+(AC-Pi)\ \ \ \ \ \ \ \ ---(D)$$
$$ATP\overset{(AC-Pi)}{\rightarrow} cAMP\ \ \ \ \ \ \ \ ---(E)$$
$$cAMP+CRPx\leftrightarrow CRP\ \ \ \ \ \ \ \ ---(F)$$
$$CRP+Pl\leftrightarrow Plx\ \ \ \ \ \ \ \ ---(G)$$
$$Pl+polymerase+\{nucleotides\}\rightarrow Pl+polymerase+mRNA\ \ ---(H)$$
For making the calculations less complex, we derived three assumptions. By starting it, we made the first assumption to simplify this dynamics considerably.
Assumption 1:
Because [E2A] and [E2A’] are regulated by a lot of chemical compound, which makes [E2A’] and [E2A] not change considerably after a few amount of Glucose is added into the system. That this,
$$\frac{\Delta [E2A]}{[E2A]},\frac{\Delta [E2A']}{[E2A']\ll 1}$$
The following derivation can only be valid if the assumption above is reasonable.
Note: k represents reaction rate constant and K represent reaction equilibrium constant.
If we only see reaction (F) to (H), it can be seen as a modified form of induced system whereas CRP is an inhibitor activated by cAMP.
$$\frac{d[mRNA]}{dt}=k_H[Pl][Poly]\prod \{nucleotides\}$$
$$\frac{d[Pl]}{dt}=-k_G[CRP][Pl]+k_{-G}[Plx]$$
Compared to the change of CRP, PI needs a shorter time to reach its steady state. That is
$$\frac{d[Pl]}{dt}=0$$
then,
$$[Pl]=\frac{k_{-G}}{k_G[CRP]+k_{-G}}[Pl_{total}]=\frac{1}{1+K_G[CPR]}[Pl_{total}]$$
where \(K_G=k_G/k_{-G}\), \([Pl_{total}]=[Pl]+[Plx]\)
Then the transcription rate will becomes
$$\frac{d[mRNA]}{dt}=k_H[Pl][Poly]\prod \{nucleotides\}=\frac{k_H[Poly]\prod\{nucleotides\}}{1+K_G[CRP]}[Pl_{total}]$$
Because nucleotides in biology system are large enough, we can treat it as a constant during the reaction.c
Set \(V_s=k_H[Pl][Ploy]\prod\{nucleotides\}[Pl_{total}]\), then
$$\frac{d[mRNA]}{dt}=\frac{V_s}{1+K_G[CRP]}$$
Then we turn to the dynamics of [CRP]
From reaction (F)
$$\frac{d[CRP]}{dt}=k_F[cAMP][CRPx]-k_{-F}[CRP]$$
When [CRP] reach its steady state,
$$[CRP]=\frac{[CRP_{total}][cAMP]}{K_F+[cAMP]}$$
so the transcription rate become
$$\begin{split} \frac{d[mRNA]}{dt}&=\frac{V_s}{1+K_G[CRP]}\\&=\frac{V_s(K_F+[cAMP])}{(K_F+[cAMP])+K_G[CRP_{total}][cAMP]} \\ &=\frac{K_F\frac{1}{[cAMP]}+1}{\frac{K_F}{V_s}\frac{1}{[cAMP]}+\frac{K_G[CRP_{total}]}{V_s}}\end{split} $$
We can see that the transcription rate of genes is a function of [cAMP].
The Glucose transmission and digestion are described in reference [1].
If we write reaction (B) in a more detail way,
$$E2B'+Glucose+E2C\leftrightarrow complex+Glucose\overset{k_{cat}}{\rightarrow}E2B+E2C+G6P$$
then
$$\frac{d[complex]}{dt}=k_B[E2B'][Glucose][E2C]-(k_{-B}+k_{cat}[complex][Glucose])$$
When [complex] reach its steady state so that
$$\frac{d[complex]}{dt}=0$$
then
$$[complex]=\frac{k_B[E2B'][E2C]}{(k_{-B}+k_{cat})}$$
here we introduce the third assumption
Assumption 2:
[complex] is very dilute so that [Glucose] will keep its concentration during the reaction chain.
We combine this result and calculate reaction (A) and get
$$\frac{d[E2B']}{dt}=-k_B[E2B'][Glucose][E2C]+k_{-B}[complex][Glucose]+k_A[E2A'][E2B]-k_{-A}[E2A][E2B']$$
When E2B’ reach its steady state, it is
$$\frac{d[E2B']}{dt}=0$$
then
$$[E2B']=\frac{k_{-B}[complex][Glucose]+k_A[E2A'][E2B]}{k_B[E2C][Glucose]+k_{-A}[E2A]}$$
$$[E2B]=\frac{k_{-B}[complex][Glucose]+k_A[E2A'][E2B_{total}]}{k_B[E2C][Glucose]+k_{-A}[E2A]}-\frac{k_A[E2A'][E2B']}{k_B[E2C][Glucose]+k_{-A}[E2A]}$$
$$[E2B']=\frac{k_{-B}[complex][Glucose]+k_A[E2A'][E2B_{total}]}{k_B[E2C][Glucose]+(k_{-A}[E2A_{total}]+a(k_A-k_{-A})[E2A'])}$$
In this part, our target is to find our [AC'] when reaction A and reaction D reach their equilibrium state.
We here have two equilibrium constants
$$K_A=\frac{[E2A][E2B']}{[E2A'][E2B]}$$
$$K_B=\frac{[E2A][AC']}{[E2A'][AC]}$$
So,
$$\frac{K_A}{K_B}=\frac{[E2B'][AC]}{[E2B][AC']}=\frac{[E2B']([AC_{total}]-[AC'])}{([E2B_{total}]-[E2B'])[AC']}$$
Reassemble and get
$$[AC']=\frac{K_B[E2B'][AC_{total}]}{K_A([E2B_{total}]-[E2B'])+K_B[E2B']}=\frac{K_B[AC_{total}]}{K_A[E2B_{total}]/[E2B']+(K_B-K_A)}$$
cAMP actually participate many biological system not listed here. But briefly, we can assume that it is a first order reaction,
$$\frac{d[cAMP]}{dt}|_{consume}=-d_{cAMP}[cAMP]$$
According to reaction (E) and (F),
$$\frac{d[cAMP]}{dt}=k_E\frac{AC'_{total}[ATP]}{[ATP]+K_E}-d[cAMP]-\frac{d[CRP]}{dt}$$
Because in part I, [CRP] in steady state require the concentration of cAMP, which means the whole process will be very complicated if [cAMP] will keep changing with [CRP], so an assumption is needed to make the calculation simpler.
Assumption 3:
The reaction of CRP-cAMP bind contribute very small to the change of [cAMP], that is,
$$k_E\frac{[AC'_{total}][ATP]}{[ATP]+K_E}-d[cAMP]-\frac{d[CRP]}{dt}\approx k_E\frac{[AC'_{total}][ATP]}{[ATP]+K_E}-d[cAMP]$$
Under the assumption, the equilibrium of [cAMP] will be very easy to get,
$$\frac{d[cAMP]}{dt}=k_E\frac{[AC'_{total}][ATP]}{[ATP]+K_E}-d[cAMP] = 0$$
so,
$$[cAMP]=\frac{k_E}{d}\frac{[ATP]}{[ATP]+K_E]}[AC'_{total}]$$
Here we have calculated the concentration of [AC’], [E2B’] and [cAMP] in Part II ~ Part IV, and we also derive a formula that can express the transcription rate of the downstream genes following to Genes are Back of the PI inPart I.
First, we substitute [E2B’] into [AC’] and get
$$ [AC'] = \frac{K_B[AC_{total}]}{K_A[E2B_{total}]/[E2B']+(K_B-K_A)}=\frac{a[Glucose]+b}{[Glucose]+c} $$
where
$$a=\frac{K_B[AC_{total}]k_{-B}[complex]}{K_A[E2B_{total}]+(K_B-K_A)k_{-B}[complex]}$$
$$b=\frac{K_B[AC_{total}]k_A[E2A'][E2B_{total}]}{K_A[E2B_{total}]k_B[E2C]+(K_B-K_A)k_{-B}[complex]}$$
$$c=\frac{K_A[E2B_{total}](k_{-A}[E2A_{total}+(k_A-k_{-A})[E2A']])+(K_B-K_A)k_A[E2A'][E2B_{total}]}{K_A[E2B_{total}]k_B[E2C]+(K_B-K_A)k_{-B}[complex]}$$
Then put this into [cAMP]
$$[cAMP]=\frac{k_E}{d}\frac{[ATP]}{[ATP]+K_E}\times \frac{a[Glucose]+b}{[Glucose]+c}=\frac{a'[Glucose]+b}{[Glucose]+c}$$
$$a'=\frac{k_E}{d}\frac{[ATP]}{[ATP]+K_E}\times \frac{K_B[AC_{total}]k_{-B}[complex]}{K_A[E2B_{total}]k_B[E2C]+(K_B-K_A)k_{-B}[complex]}$$
then, we can substitute [cAMP] into the formula of transcription
$$\begin{split}\frac{dY}{dt}&=\frac{K_F\frac{1}{[cAMP]}+1}{\frac{K_F}{V_s}\frac{1}{[cAMP]}+\frac{K_G[CRP_{total}]}{V_s}}\\&=\frac{K_F([Glucose]+c)+(a'[Glucose]+b)}{\frac{K_F}{V_s}([Glucose]+c)+\frac{K_G[CRP_{total}]}{V_S}(a'[Glucose]+b)}\\&=\frac{(K_F+a')[Glucose]+(b+K_Fc)}{(\frac{K_G[CRP_{total}]}{V_S}+\frac{K_F}{V_S})[Glucose]+(\frac{K_F}{V_s}c+\frac{K_G[CRP_{total}]}{V_s}b)}\\&=\frac{c1[Glucose]+c2}{[Glucose]+c3}\end{split}$$
$$\frac{d[mRNA]}{dt}=\frac{c1[Glucose]+c2}{[Glucose]+c3}$$
where
$$c1=(K_F+a')/(\frac{K_G[CRP_{total}]}{V_s}+\frac{K_F}{V_S})$$
$$c2=(b+K_Fc)/(\frac{K_G[CRP_{total}]}{V_s}+\frac{K_F}{V_s})$$
$$c3=(\frac{K_F}{V_s}c+\frac{K_G[CRP_{total}]}{V_s}b)/(\frac{K_G[CRP_{total}]}{V_s}+\frac{K_F}{V_s})$$
For the correction of cooperativity, we add a Hill parameters, n, on the equation, so that the final formula will become
$$\frac{d[Gene]}{dt}=\frac{c1\times [Glucose]^n+c2}{[Glucose]^n}+c3$$
Because the solution we derive is the production rate when the system reaches quasi-steady state. To fit the data accurately, it is necessary to understand the reaction process evolution with time.
Before the quasi-steady state is reached, three components will affect the transcription of the promoter Pl, that is, glucose CRP and RNA polymerase. So when the glucose is added into the system, the promoter needs some time to react with the change and keep increasing its transcription rate. However, E. coli will natively produce a small RNA SgrS which can inhibit the translation of glucose transporter. The inhibition of glucose transporter hinders glucose entering a cell, and the in-cell glucose is continually consumed by E. coli. They both lead to a decrease rate.
But the reactions mentioned above are too complicated to solve analytically, so we assume that when the differential of the production rate is equal to zero, that means the system has reached the quasi-steady state.
If the assumption is not valid, the result using this method might not be consistent However, as shown in Fig 5, the data were consistent by applying the hypothesis.
 (b)
(b)
(a), 5 mM, (b) 10 mM, (c)15 mM.
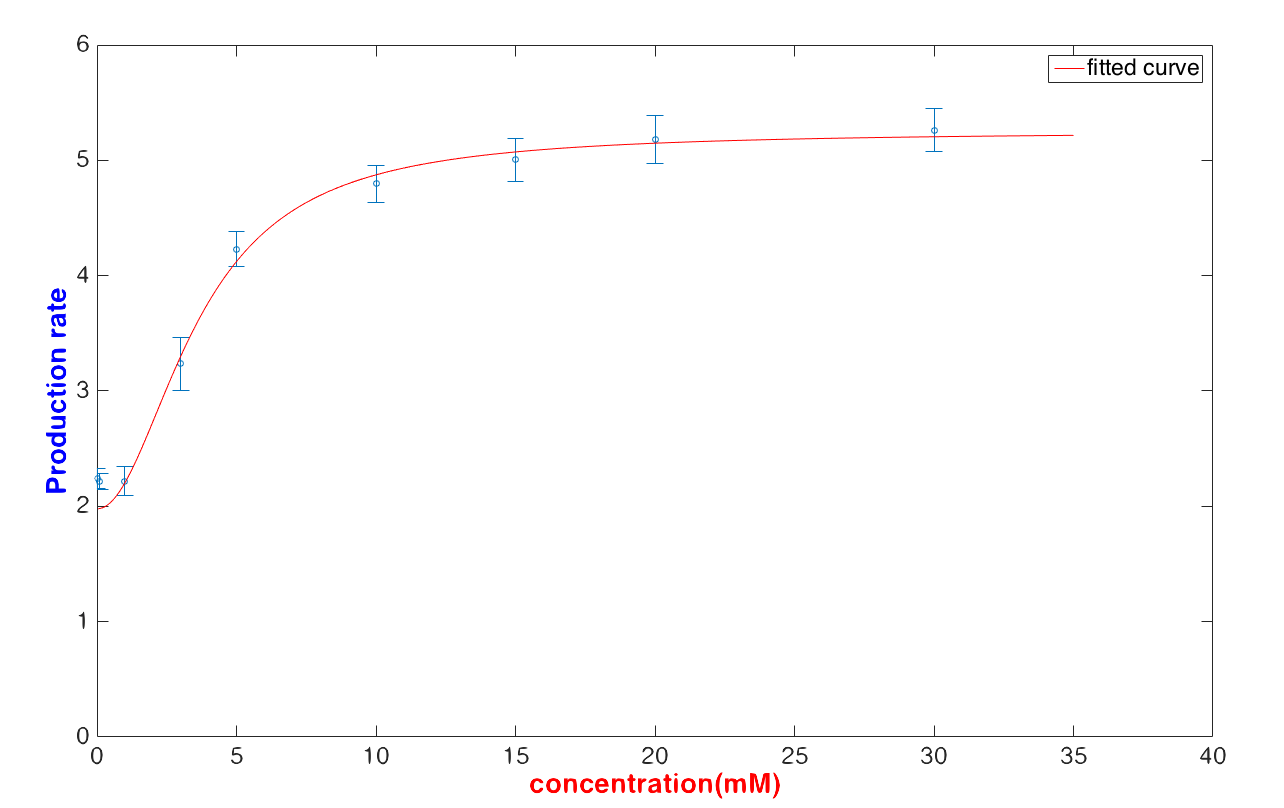
After a derivation of transcription rate and discussion in a single cell, we now have to exam if the formula can correctly match the experimental data well.
We use the method mentioned above to fit the quasi-steady production rate with a lower glucose concentration (< 30 mM) and get
$$\frac{d[Y]}{dt}=\frac{18.65\times [Glucose]^{2.02}+38.25}{[Glucose]^{2.02}+5.07}$$
The result shows that the fitting curve can fit the data well.
In our case, we intended to use the formula to calculate the glucose concentration with a given fluorescence value. It is obvious that U. coli can predict the glucose concentration with relatively high robustness when the detected glucose concentration is lower than 30 mM.But if the inputted glucose concentration is higher than 30 mg/μL, it is hard to exam the glucose concentration numericallys.
[1] Steinsiek S., et al., Glucose transport in Escherichia coli mutant strains with defects in sugar transport systems, Journal of Bacteriology (2012)
[2] Alejandro N., et al., Glucose uptake regulation in E. coli by the small RNA SgrS: comparative analysis of E. coli K-12 (JM109 and MG1655) and E. coli B (BL21), Microbial Cell Factories(2010)