| Line 379: | Line 379: | ||
detection methods are relatively complex, costly and low sensitive. Our project | detection methods are relatively complex, costly and low sensitive. Our project | ||
attempts to establish a novel in vitro microRNA detection system which is | attempts to establish a novel in vitro microRNA detection system which is | ||
| − | + | efficient, sensitive, specific, low-cost and output-visible. In this system, CRISPR-Cas9 technique | |
| − | is modified to integrate with | + | is modified to integrate with split-HRP reporting systems. |
| − | The advanced rolling circle amplification | + | The advanced chain-replacement and rolling circle amplification technologies are also involved and optimized. This system may ideally be compatible |
| − | + | ||
for the detection of various series of small non-coding RNAs. To our knowledge, | for the detection of various series of small non-coding RNAs. To our knowledge, | ||
we are the first to use the CRISPR-Cas9 system as a small non-coding RNA | we are the first to use the CRISPR-Cas9 system as a small non-coding RNA | ||
Revision as of 05:08, 19 October 2016
HomePage • PROJECT • Description
Abstract
MicroRNAs, serve as critical gene expression regulators at the transcriptional and post-transcriptional levels, have also been found as important blood-based biomarkers for early detection of cancers. However, their current in vitro detection methods are relatively complex, costly and low sensitive. Our project attempts to establish a novel in vitro microRNA detection system which is efficient, sensitive, specific, low-cost and output-visible. In this system, CRISPR-Cas9 technique is modified to integrate with split-HRP reporting systems. The advanced chain-replacement and rolling circle amplification technologies are also involved and optimized. This system may ideally be compatible for the detection of various series of small non-coding RNAs. To our knowledge, we are the first to use the CRISPR-Cas9 system as a small non-coding RNA monitor in vitro. Its establishment and further development might provide a new approach for rapid and low-cost cancer screening, virus detection and curative efficacy assessment.
Introduction
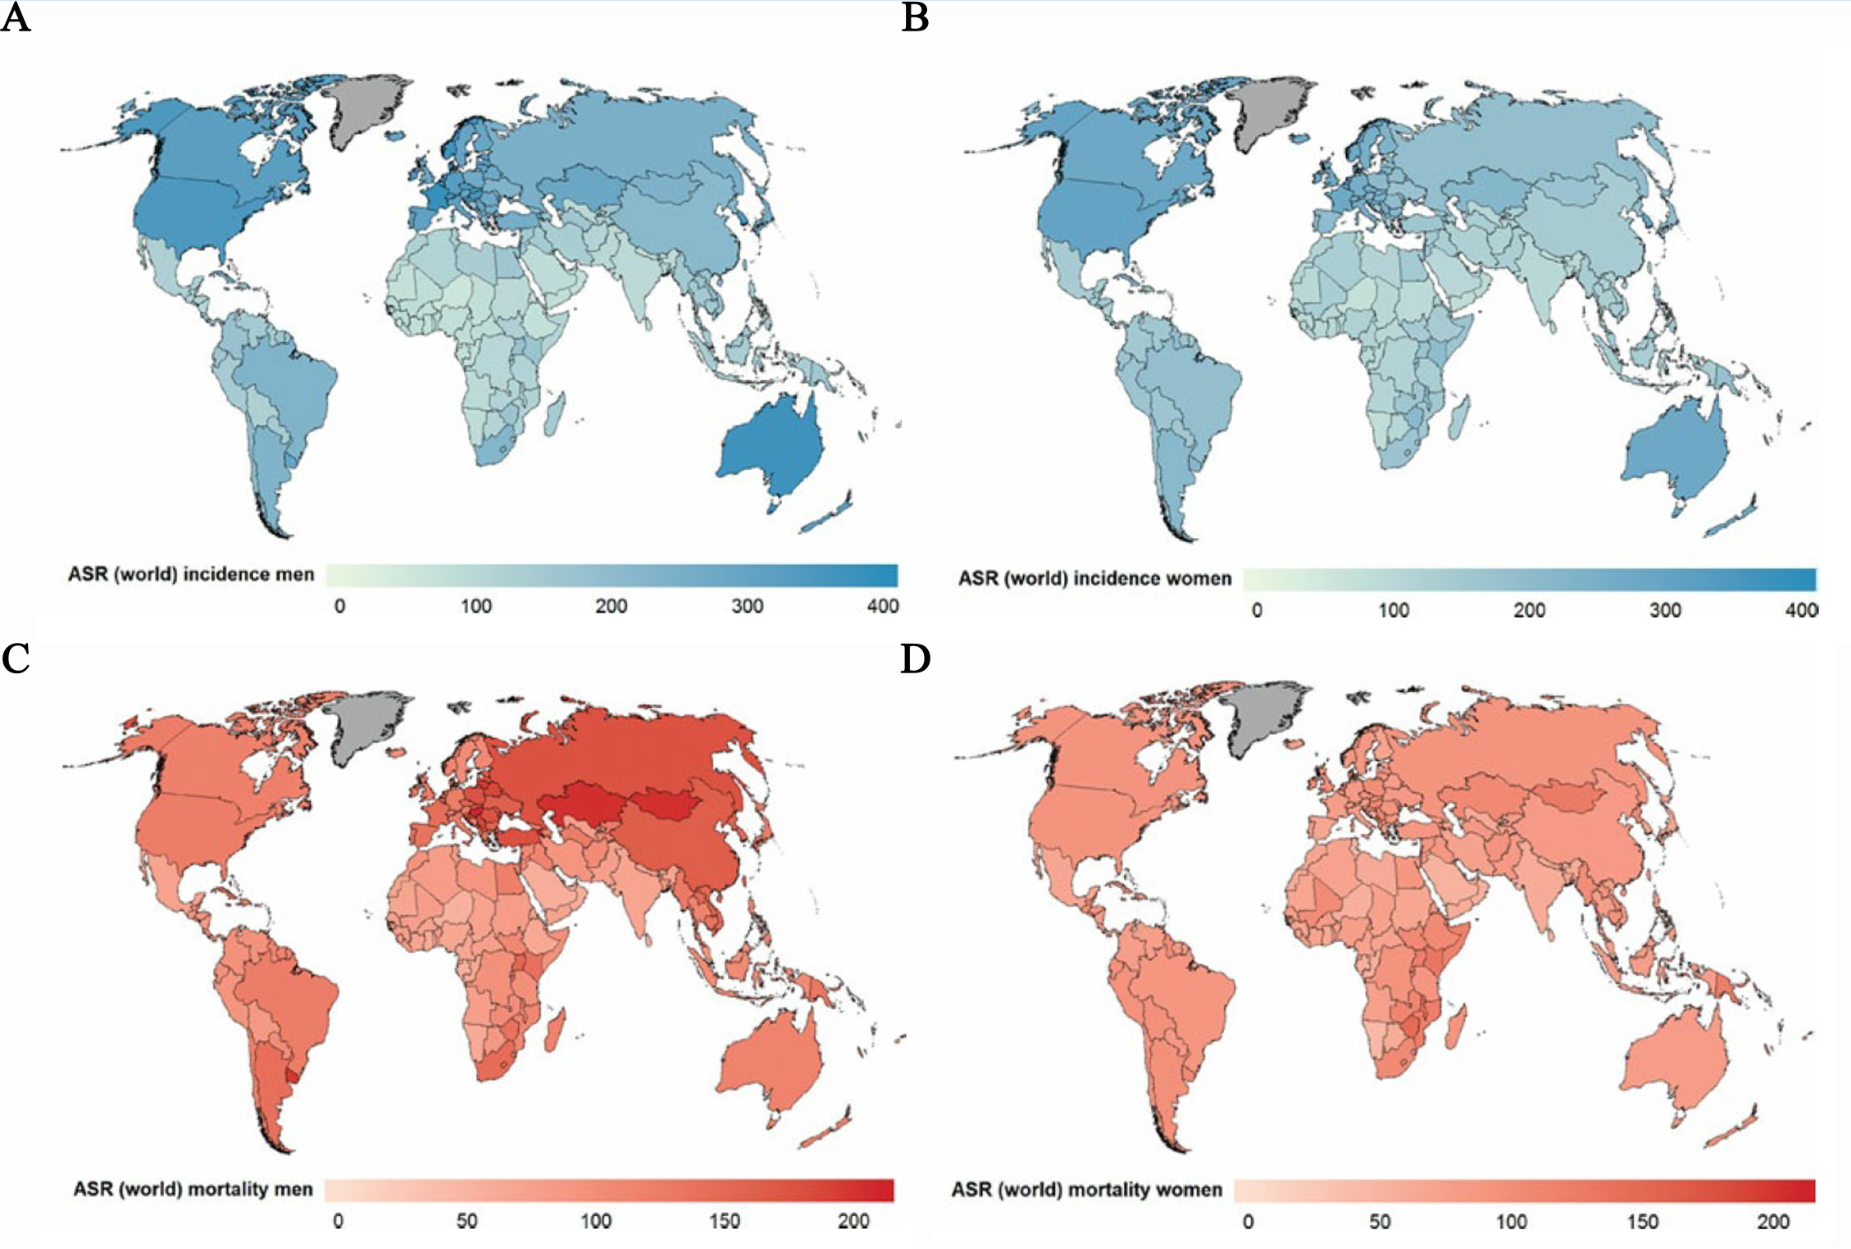
Nowadays, cancers, due to their high incidence and serious mortality, are affecting populations in all countries and all regions (Figure 1). However, in most countries, resources for prevention and diagnosis of cancer still remain limited due to their high cost and low cost-effectiveness1, whereas the early detection of cancer has been proven to result in improved survival, less extensive treatment and less possibility to metastasis2-4. Such situation highlighted the undiminished importance of the development of a low-cost, easily accessible and rapid tool for early screening and detection of cancers.
Figure 1. Global distribution of estimated age-standardized world cancer incidence rate (ASR) per 100 000 in (A) men, (B) women, and mortality rate (ASR) per 100 000 in (C) men and (D) women. (WHO, World cancer report, 2014)
MicroRNAs (miRNAs), as a kind of small non-coding RNA containing approximately 22 nucleic acids, have been proven to play important roles on post-transcriptional regulation of the gene expression, thus involving in the regulation of many important biological events5. Recently, it was reported that serum miRNAs can serve as a promising cancer biomarker because their expression pattern can be correlated with cancer type, stage, and other clinical variables, which then, implying that miRNA profiling can be used as a tool for cancer diagnosis and prognosis6-8. Moreover, circulating miRNAs have been proven to remain stable under some extreme condition such as RNase exposure, multiple freeze-thaw cycles, and extreme pH, thus making them strong candidates for low-cost detection and analysis 9. However, due to their short length, low expression level and high homologous sequence similarity, the quantified detection and analyzation of circulating miRNAs remain challenging nowadays. Old-schools such as Northern Blotting, microarray and qRT-PCR technique are still our approach to detect and analyze the quantity of miRNA10. Notably, the expanded application of these techniques, as well as some other new approaches such as bioluminescence11, Nanopore sensors12 were severely limited due to their relatively low sensitivity (which were mostly nM sensitivity against the pM or even fM concentration of blood miRNA), cumbersome and complex in operation, and relative high cost. More recently, Deng et.al reported a single-molecule resolution in situ miRNA detection technique based on rolling circle amplification (RCA)13. However, this approach has been restricted only in the application of cellular in situ analysis. Its expandability to circulating miRNA detection still faces a major problem that the degree of one-step signal amplification and differentiation might not be sufficient to meet the requirements of sensitivity and specificity. At the main time, such method still relies on equipment such as Fluoresce microplate readers or fluorescence microscopes, which are highly costly.
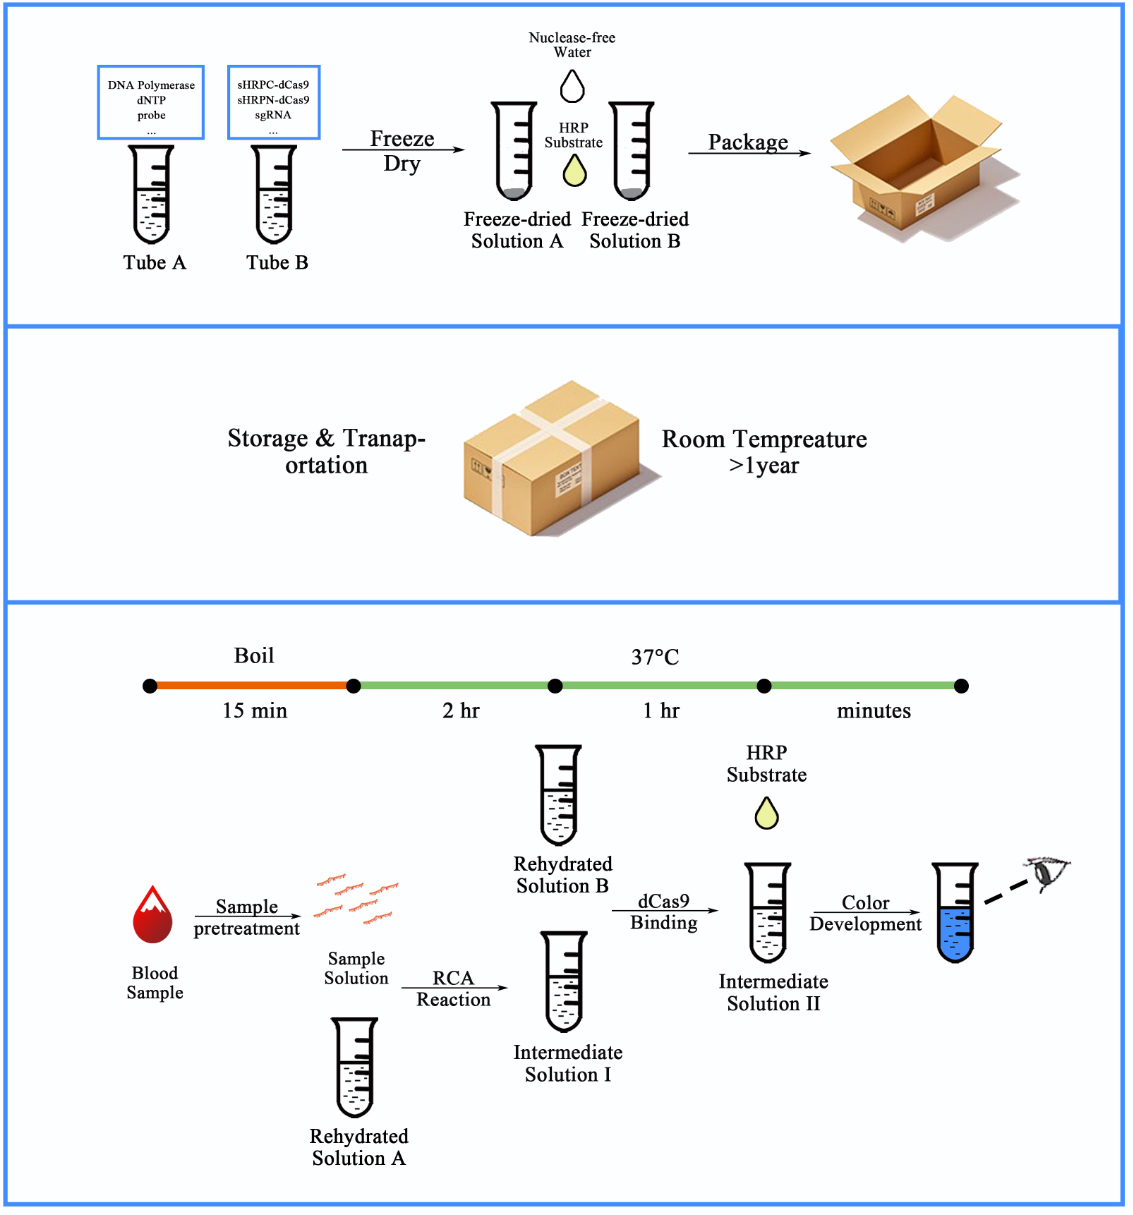
Figure 2. Workflow for our CRISPR-based blood-microRNA detection system.
Using sequence information from online databases, probes for RCA reaction were designed in silico. Once synthesized and sealed to form the dumbbell structure, the probe, together with other necessary materials can be embedded into tubes and freeze-dried to remain stable in room temperature for a relatively long time. For the detection process, serum samples were pre-treated by boiling in 95℃ for 15 min to expose the miRNAs completely. The amount of the specific RNA was indicated by a color difference in the tube from colorless to blue
In our project, we designed a novel cell-free platform built with synthetic bio-components to achieve the low-cost, handy and visualized detection of serum miRNAs, which can be employed in low-resource settings (Figure 2). Using miR let-7a (a bio-marker for non-small cell lung cancer (NSCLC)) as a demo of our scheme, we modified the RCA based DNA amplification system and introduced it into nucleic acid detection in liquid samples such as serum, and then conducted Sybr I mediated fluorescent assay for its validation and assessment. The improvements of sensitivity and specificity of RCA output signal as well as the visualization of RCA outputs were achieved through a single guide RNA (sgRNA) mediated dCas9 binding system and a conjugated split-HRP reporting system. Meanwhile, a mathematic model was also developed to provide theoretical approval to our scheme and basic guideline for wet-lab experiments. Finally, we employed a simple sample-pretreatment protocol to reliably expose miRNAs in serum samples and demonstrated robust detection with this scheme to compare let-7a concentrations among blood samples collected from NSCLC patients and healthy volunteers.
Improvement We Made
BBa_K1789003 and BBa_K1789004
In our project this year, a new protein-protein interaction (PPI) toolkit containing several split reporting systems were modified and designed and introduced into the registry. As a classical PPI indicator, split-GFP system, developed previously in our project in iGEM2015 (BBa_K1789003 and BBa_K1789004), was also included in our kit. Several improvements has been made for this system including:
1. Improved characterization for previous parts
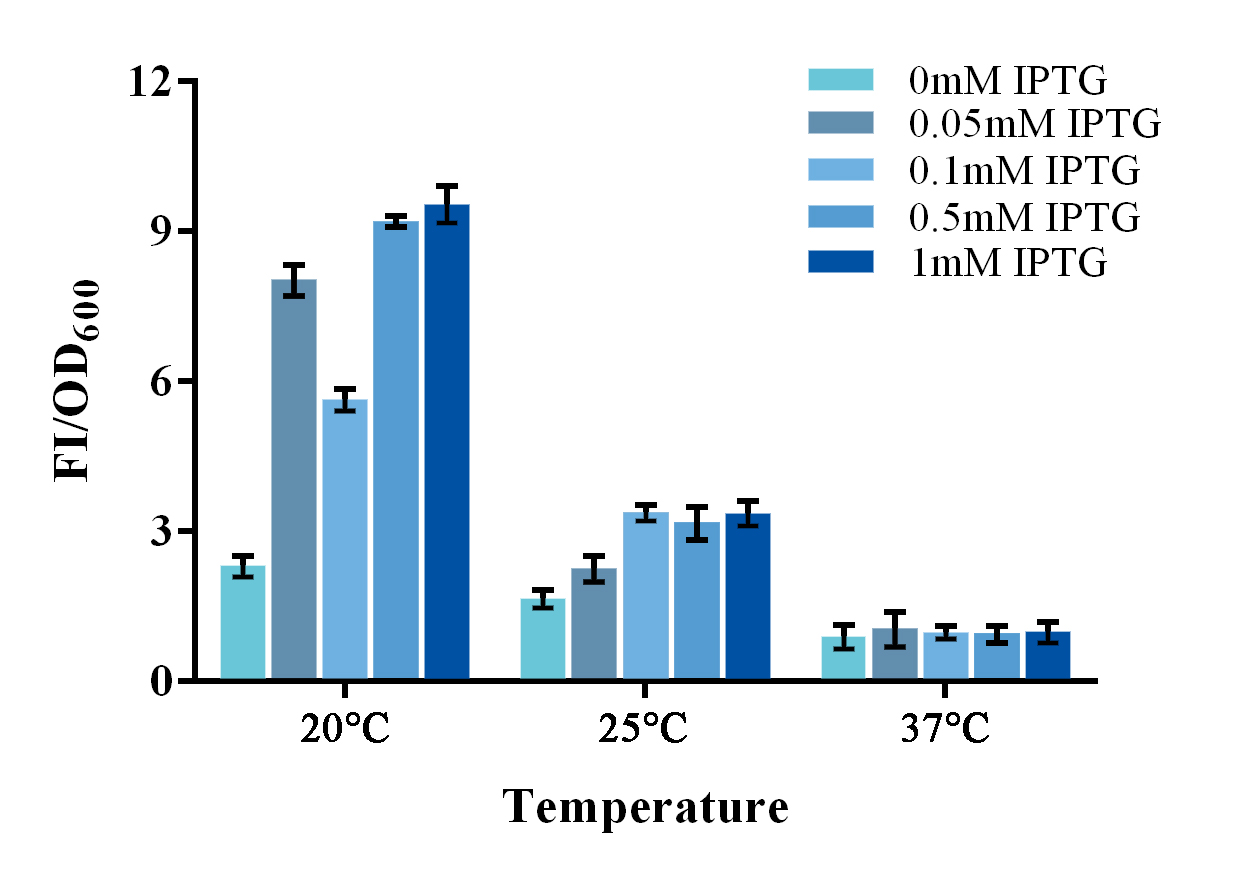
To further improve the function of existing parts, we stimulate an in vivo PPI situation, and tried to optimize the culture condition for a better signal-to-noise ratio (SNR). For such matter, two devices, containing split-GFP fragments and a complete or spited zinc finger protein, were built under control of a lac operon controlled T7 promoter. The complete zinc finger protein was to stimulate a PPI positive situation, while the split one was to stimulate a PPI negative situation . Fluorescence signal was detected by a microplate reader after an overnight culture under various conditions. Relative fluorescence intensity was then calculated with normalization of OD600 value. The relative fluorescence intensity of each control group was set arbitrarily at 1.0 (data not shown), and the levels of the other groups were adjusted correspondingly. Results shown a better SNR under 20℃ and 0.5mM IPTG induction (Figure 3). Thus indicating that better performance of such system could be expected under lower culturing temperature.
Figure 3. Evaluation of the split-GFP system under different expression condition.
Relative fluorescence intensity was calculated with normalization of the OD600 value. The relative fluorescence intensity of each control group was set arbitrarily at 1.0 (data not shown), and the levels of the other groups were adjusted correspondingly. Green fluorescence was measured under 488nm of excitation and 538nm of emission. This experiment was run in three parallel reactions, and the data represent results obtained from at least three independent experiments. *p<0.05, **p<0.01.
2. To further improve the function of split-GFP system, another method of splitting GFP was introduced and tested in our project. Instead of a traditional two-part split, we split the GFP protein into three fragments namely GFP10 (residues 194-212), GFP11 (residues 213-233) and GFP 1-9 (residues 1-193)14. Due to their short length, two small fragments can be easily fused onto proteins with less affection on their folding (figure 4A).
Figure 4 Evaluation of two different split-GFP systems.
Relative fluorescence intensity was calculated with normalization of the OD600 value. For Relative FI ratios, relative fluorescence intensity of each control group was set arbitrarily at 1.0, and the levels of the other groups were adjusted correspondingly. This experiment was run in three parallel reactions, and the data represent results obtained from at least three independent experiments. *p<0.05, **p<0.01.
Comparing with previous split-GFP system, higher SNR was reached under the same expression condition, while the total signal intensity suffered tolerable decrease (Figure 4B).
Reference
1 Jeong, K. E. & Cairns, J. A. Review of economic evidence in the prevention and early detection of colorectal cancer. Health Econ Rev 3, 20, doi:10.1186/2191-1991-3-20 (2013).
2 Etzioni, R. et al. The case for early detection. Nat Rev Cancer 3, 243-252, doi:10.1038/nrc1041 (2003).
3 Wolf, A. M. et al. American Cancer Society guideline for the early detection of prostate cancer: update 2010. CA Cancer J Clin 60, 70-98, doi:10.3322/caac.20066 (2010).
4 McPhail, S., Johnson, S., Greenberg, D., Peake, M. & Rous, B. Stage at diagnosis and early mortality from cancer in England. Br J Cancer 112 Suppl 1, S108-115, doi:10.1038/bjc.2015.49 (2015).
5 Ambros, V. MicroRNA pathways in flies and worms: growth, death, fat, stress, and timing. Cell 113, 673-676 (2003).
6 Lu, J. et al. MicroRNA expression profiles classify human cancers. Nature 435, 834-838, doi:10.1038/nature03702 (2005).
7 Jansson, M. D. & Lund, A. H. MicroRNA and cancer. Mol Oncol 6, 590-610, doi:10.1016/j.molonc.2012.09.006 (2012).
8 Schultz, N. A. et al. MicroRNA biomarkers in whole blood for detection of pancreatic cancer. JAMA 311, 392-404, doi:10.1001/jama.2013.284664 (2014).
9 Chen, X. et al. Characterization of microRNAs in serum: a novel class of biomarkers for diagnosis of cancer and other diseases. Cell Res 18, 997-1006, doi:10.1038/cr.2008.282 (2008).
10 Hunt, E. A., Broyles, D., Head, T. & Deo, S. K. MicroRNA Detection: Current Technology and Research Strategies. Annu Rev Anal Chem (Palo Alto Calif) 8, 217-237, doi:10.1146/annurev-anchem-071114-040343 (2015).
11 Cissell, K. A., Rahimi, Y., Shrestha, S., Hunt, E. A. & Deo, S. K. Bioluminescence-based detection of microRNA, miR21 in breast cancer cells. Anal Chem 80, 2319-2325, doi:10.1021/ac702577a (2008).
12 Venkatesan, B. M. & Bashir, R. Nanopore sensors for nucleic acid analysis. Nature nanotechnology 6, 615-624, doi:10.1038/nnano.2011.129 (2011).
13 Deng, R. et al. Toehold-initiated rolling circle amplification for visualizing individual microRNAs in situ in single cells. Angew Chem Int Ed Engl 53, 2389-2393, doi:10.1002/anie.201309388 (2014).
14 Cabantous, S. et al. A new protein-protein interaction sensor based on tripartite split-GFP association. Scientific reports 3, 2854, doi:10.1038/srep02854 (2013).


