Qiuxinyuan12 (Talk | contribs) |
Qiuxinyuan12 (Talk | contribs) |
||
| Line 553: | Line 553: | ||
</p> | </p> | ||
</br> | </br> | ||
| + | |||
| + | <!--标题--> | ||
| + | <h2> | ||
| + | <span><span style="color:#7f1015">Modeling</span></span><hr /> | ||
| + | </h2> | ||
| + | |||
| + | <!--正文--> | ||
| + | <p style="text-indent:22pt;"> | ||
| + | <span style="line-height:2;font-family:Perpetua;font-size:18px;">This model was created to evaluate the effectiveness of initial design and offer guidelines about how the system can (or must) be improved. The relationships between the signal to noise ratio (SNR), the signal intensity respectively and the concentration of miRNA under different additional amount of fusion proteins were discussed mainly in this model. For such matter, theoretical calculation and experimental results were well integrated and a brilliant probability model was introduced. | ||
| + | |||
| + | </span> | ||
| + | </p> | ||
| + | </br> | ||
| + | |||
| + | <!--正文--> | ||
| + | <p style="text-indent:22pt;"> | ||
| + | <span style="line-height:2;font-family:Perpetua;font-size:18px;"> | ||
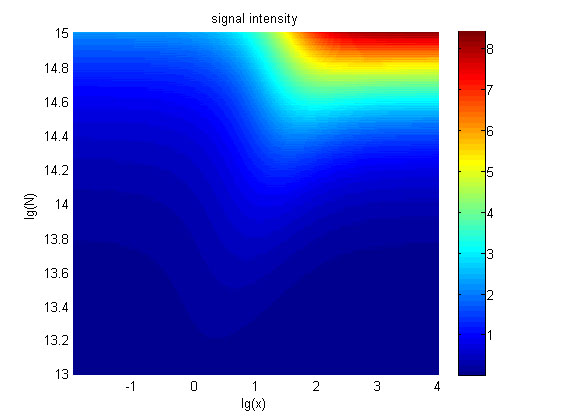
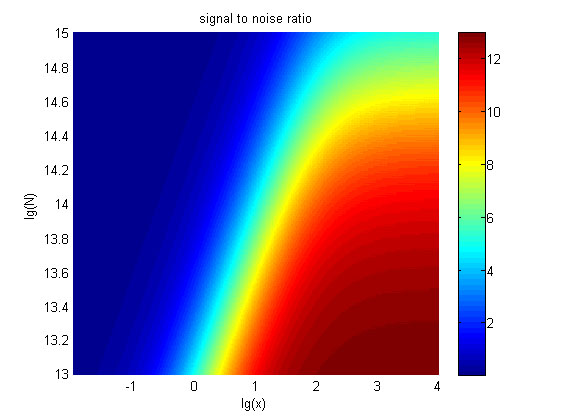
| + | The relationships were obtained and shown below. | ||
| + | </span> | ||
| + | </p> | ||
| + | </br> | ||
| + | |||
| + | <!--图和图注--> | ||
| + | </br> | ||
| + | </html> | ||
| + | [[File:T--NUDT_CHINA--modelfig5.jpg|700px|center]] | ||
| + | <html> | ||
| + | </br> | ||
| + | <p> | ||
| + | <span style="line-height:2;font-family:Perpetua;font- | ||
| + | |||
| + | size:18px;"><b>Figure | ||
| + | 5. The signal intensity (OD<sub>450</sub>)</b> Three-dimensional map of signal | ||
| + | |||
| + | intensity (OD<sub>450</sub>) | ||
| + | against miRNA concentration(pM) and additional amount of fusion proteins.</span> | ||
| + | </p> | ||
| + | </br> | ||
| + | |||
| + | |||
| + | <!--正文--> | ||
| + | <p style="text-indent:22pt;"> | ||
| + | <span style="line-height:2;font-family:Perpetua;font-size:18px;"> | ||
| + | The relationship between the concentration of miRNA and the signal intensity was monotonous when the value of the molecule number of the fusion proteins was relatively large. While the relationship did not hold when the value of the molecule number of the fusion proteins was relatively small. And the signal intensity increased as the value of the molecule number of the fusion proteins increases. | ||
| + | </span> | ||
| + | </p> | ||
| + | </br> | ||
| + | |||
| + | <!--图和图注--> | ||
| + | </br> | ||
| + | </html> | ||
| + | [[File:T--NUDT_CHINA--modelfig6.jpg|700px|center]] | ||
| + | <html> | ||
| + | </br> | ||
| + | <p> | ||
| + | <span style="line-height:2;font-family:Perpetua;font- | ||
| + | |||
| + | size:18px;"><b>Figure 6. The result of SNR</b> Three-dimensional map of signal | ||
| + | |||
| + | to noise ratio against miRNA concentration (pM) and additional amount of fusion | ||
| + | |||
| + | proteins.</span> | ||
| + | </p> | ||
| + | </br> | ||
| + | |||
| + | <!--正文--> | ||
| + | <p style="text-indent:22pt;"> | ||
| + | <span style="line-height:2;font-family:Perpetua;font-size:18px;">The signal-to-noise ratio decreased as the value of the molecule number of the fusion proteins increased. </span> | ||
| + | </p> | ||
| + | </br> | ||
| + | |||
| + | |||
| + | |||
| + | |||
Revision as of 22:45, 19 October 2016
TOP

