Abstract
This model was created to evaluate the effectiveness of initial design, and offered guidelines about how the system can (or must) be improved. (You can go DESIGN.page to see more.) The core idea was to simulate the process of producing the signal which can be detected, and drew a conclusion by obtaining the relationship between the signal intensity and the concentration of miRNA.
Introduction
Mathematical models of two aspects of our project were created, a RCA model and a signal detection model.
The RCA model was based on the Michaelis-Menten equation. The relationship between the concentration of miRNA and the number of stem-loop structures was obtained through theoretical calculation, and our experimental results was used to calculate the parameters we introduced previously.
The signal detection model was composed of a probability model and a kinetic equation of enzymatic reaction, thus the relationship between the number of stem-loop structures and the signal intensity under the premise of adding a certain amount of fusion proteins of dCas9 and split-HRP fragments was obtained.
By integrating the two models, the impacts of the molecule number of proteins on the signal to noise ratio was theoretically predicted and the trend of the signal intensity with the change of the concentration of miRNA in our wet-lab work was explained.
Assumption and Justification
About model
We assume that miRNA is not degraded throughout the reaction process.
We assume that the two fusion proteins of dCas9 and split-HRP fragments have the same ability to combine with the stem-loop structure, and only when two different proteins next to each other, can they have the ability to catalyze substrate and produce signal.
We assume that the number of stem-loop structures in each RCA product is equal under a certain reaction time.
We assume that the enzymatic activity remains unchanged with time under the premise of excessive amount of enzymes or a short-time reaction.
About the data
We assume that the data we obtain from wet-lab experiment are reliable.
We assume that all the results are trustworthy in the process of statistical processing and data calculation.
Model
Notations
The RCA model
Firstly, we assume that there is a linear relationship between the concentration of the initiated probes and miRNA as the combination reaction between miRNA and probe occurs spontaneously1 . This can be written as:
Next, RCA is an enzymatic reaction, the reaction equation is written as: iprobe+dNTP→ iprobe-dN+PPi, under the premise of excessive amount of enzymes and dNTPs, the relationship between the concentration of iprobe and the initial speed of RCA can be described by the Michaelis-Menten equation. This can be written as:
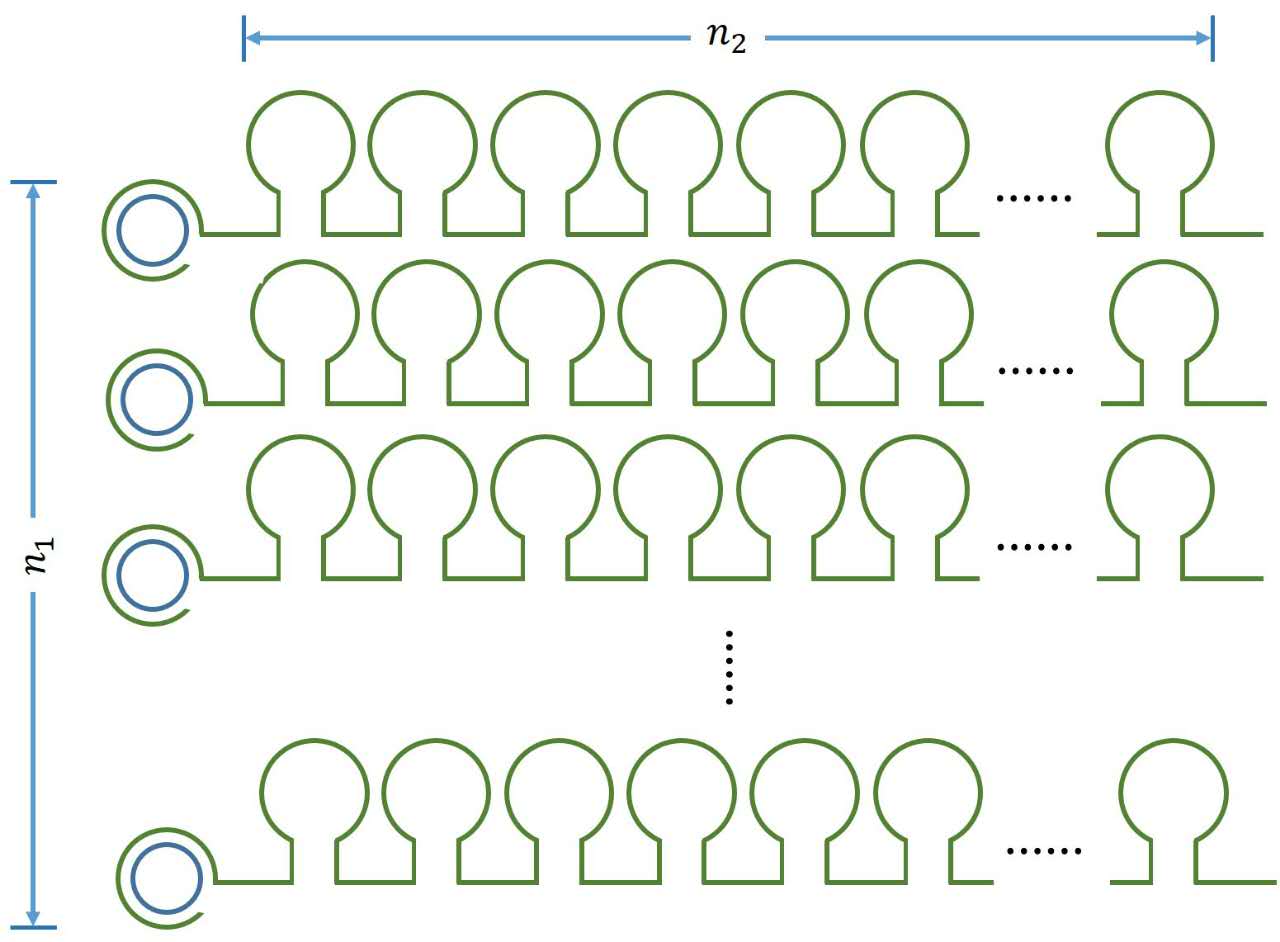
It is obvious that there is a linear relationship between the molecule numbers of iprobe-dN (n1 , reflects the molecule numbers of RCA product) and the initial speed of RCA reaction. Notably, under the premise of excessive amount of enzymes, the extending of each RCA production is related to the reaction time, not the concentration of the iprobe. It is a linear relationship when we assume that the enzymatic activity remains unchanged with time, thus, the number of stem-loop structures (n2 ) in each RCA product is stable under the premise of a certain reaction time.
Figure 1. Schematic diagram
This can be written as:
And then, SYBR Green binds to DNA. The resulting DNA-dye-complex absorbs blue light (λmax = 497nm) and emits green light (λmax = 520nm). Thus, there is a linear relationship between the total amount of stem-loop structures and the fluorescence intensity of DNA-dye-complex. This can be written as:
In summary, the relationship between the concentration of miRNA and the fluorescence intensity of DNA-dye-complex can be written as:
The signal detection model
Firstly, it is obvious that there is a linear relationship between the molecule number of formed intact HRP proteins in the solution (consider as NOISE) and the molecule number of fusion protein s in the solution. This can be written as:
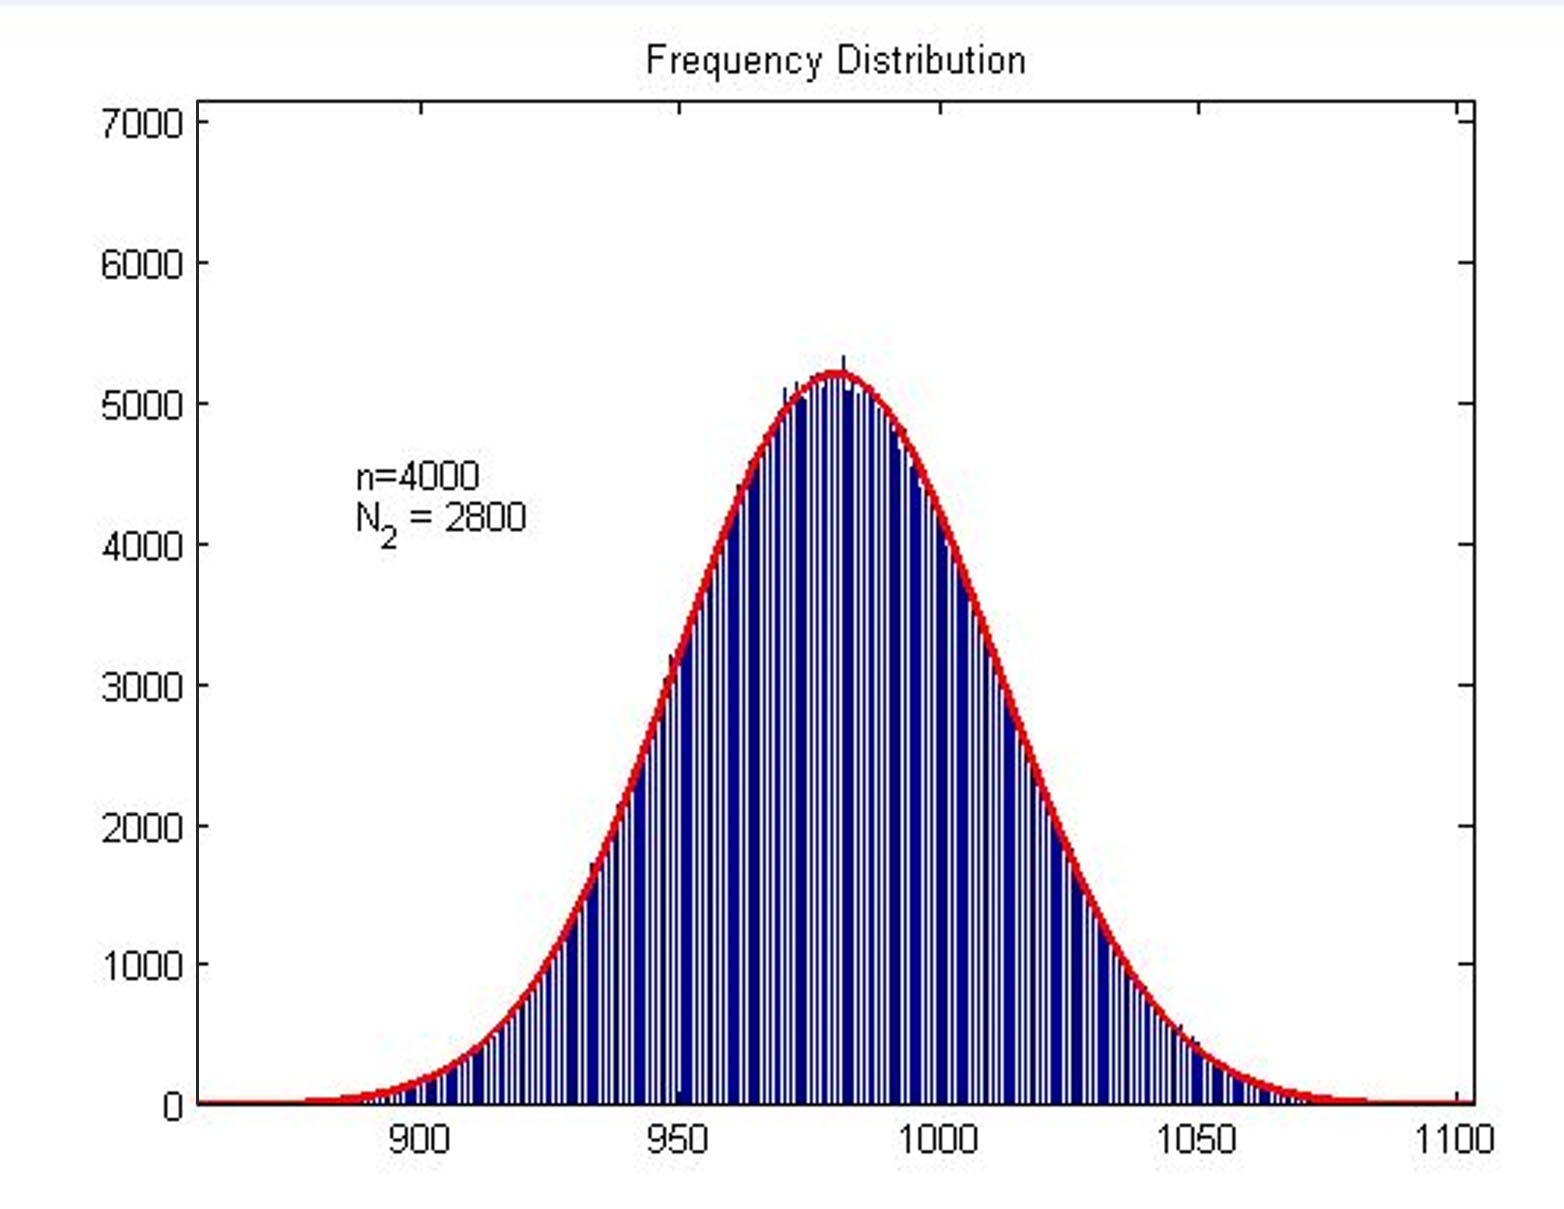
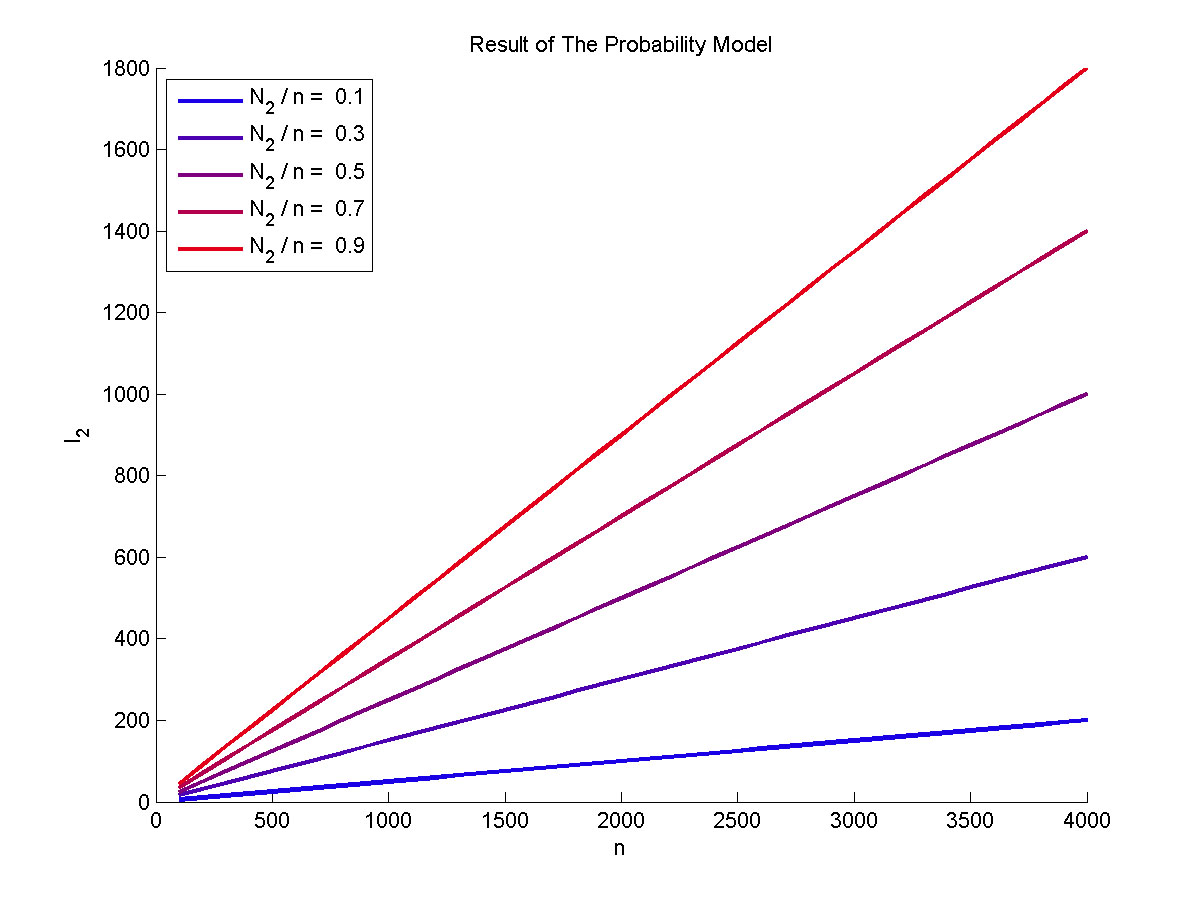
Next, we built a probability model to find the expression of the molecule number of formed intact HRP proteins (fused with dCas9) through binding with stem-loop structure (consider as SIGNAL). It is related to the total amount of stem-loop structures and the molecule number of DNA-bound fusion proteins. We obtain the result by Monte Carlo method.
Figure2. Frequency Distribution
Plot of frequency distribution of the molecule number of formed intact HRP proteins through binding with stem-loop structure.
Figure 3. The result of the probability model
Plot of the expect value of the molecule number of formed intact proteins against the total amount of stem-loop structures, carried out at 0.1, 0.3, 0.5, 0.7, 0.9 of N2 to n ratio.
The result can be written as:
As for N2, which refers to the molecule number of fusion proteins binding with stem- loop structure. The equation is formulated based on the limiting case. The equation can be written as:
And then, we can obtain the expressions for ρ and I separately.
Notably, under the premise of excessive substrates, it is a linear relationship between the reaction rate and the concentration of enzymes when we assume that the enzymatic activity remain unchanged with time, thus, we can obtain the expression of the signal intensity at tth time-step. This is written as:
In summary, the relationship between the number of stem-loop structures and the signal to noise ratio under the premise of adding a certain amount of fusion proteins is written as:
The relationship between the number of Stem-loop structures and the signal intensity under the premise of adding a certain amount of fusion proteins is written as:
The calculation of the constants
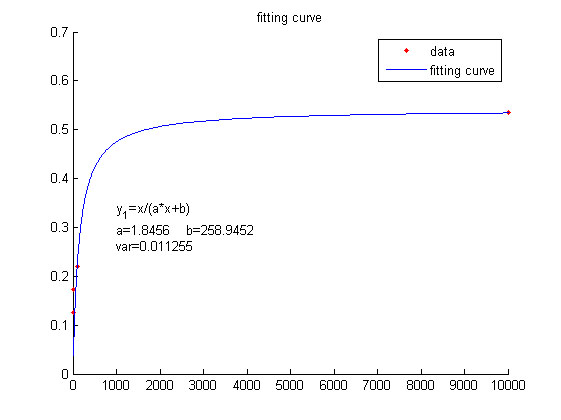
To simplify the equation (1), the constants could be integrated. As can be seen from the above table, k1, k2, k3 are constants representing the scale factor, Km and Vmax are characteristic constants of phi 29 DNA polymerase, and n2, which refers to the number of stem-loop structures in each RCA product, is stable under the premise of a certain reaction time. Thus, define two constants, mark as a and b, and then the equation can be simplified as:
We used this equation to fit the data points obtained through experiments. (Figure …in the ….page) The fitting curve is shown below.
Figure 4. Fitting curve
Fitting curve of fluorescence intensity of DNA-dye-complex (RFU) against the concentrations of miRNA (Pm).
With regard to the equation (2), we set the parameters based on the experiments as follows: k3 =8.35*10-16 (n=y1/k3); k4 =0.038; k5t=5.9*10-12.
Results and Analysis
By integrating the two models, we can obtain the relationships between the signal to noise ratio, the signal intensity respectively and the concentration of miRNA under different additional amount of fusion proteins.
The results are shown below.
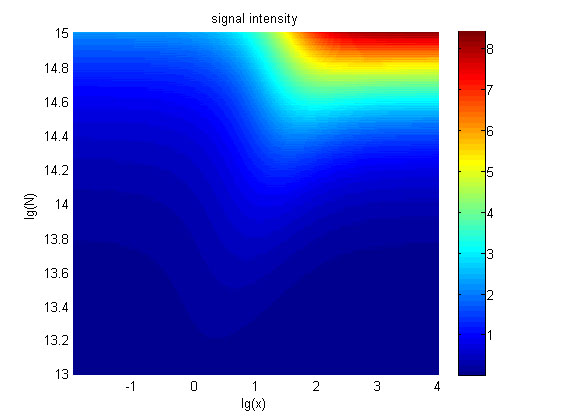
Figure 5. The signal intensity (OD450)
Three- dimensional map of signal intensity (OD450) against miRNA concentration(pM) and additional amount of fusion proteins.
There exists a monotonous relation between the concentration of miRNA and the signal intensity when the value of the molecule number of fusion proteins is relatively large. While the relationship does not hold when the value of the molecule number of fusion proteins is relatively small. And the signal intensity increases as the value of the molecule number of fusion proteins increases.
The trend of the signal intensity with the change of the concentration of miRNA is consistent with that we obtained in our wet-lab work.(…….. in the result page)
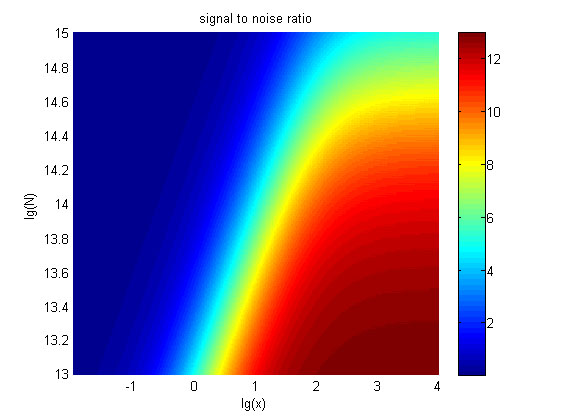
Figure 6. The result of signal to noise ratio
Three- dimensional map of signal to noise ratio against miRNA concentration (pM) and additional amount of fusion proteins.
The signal-to-noise ratio decreases as the value of the molecule number of fusion proteins increases.
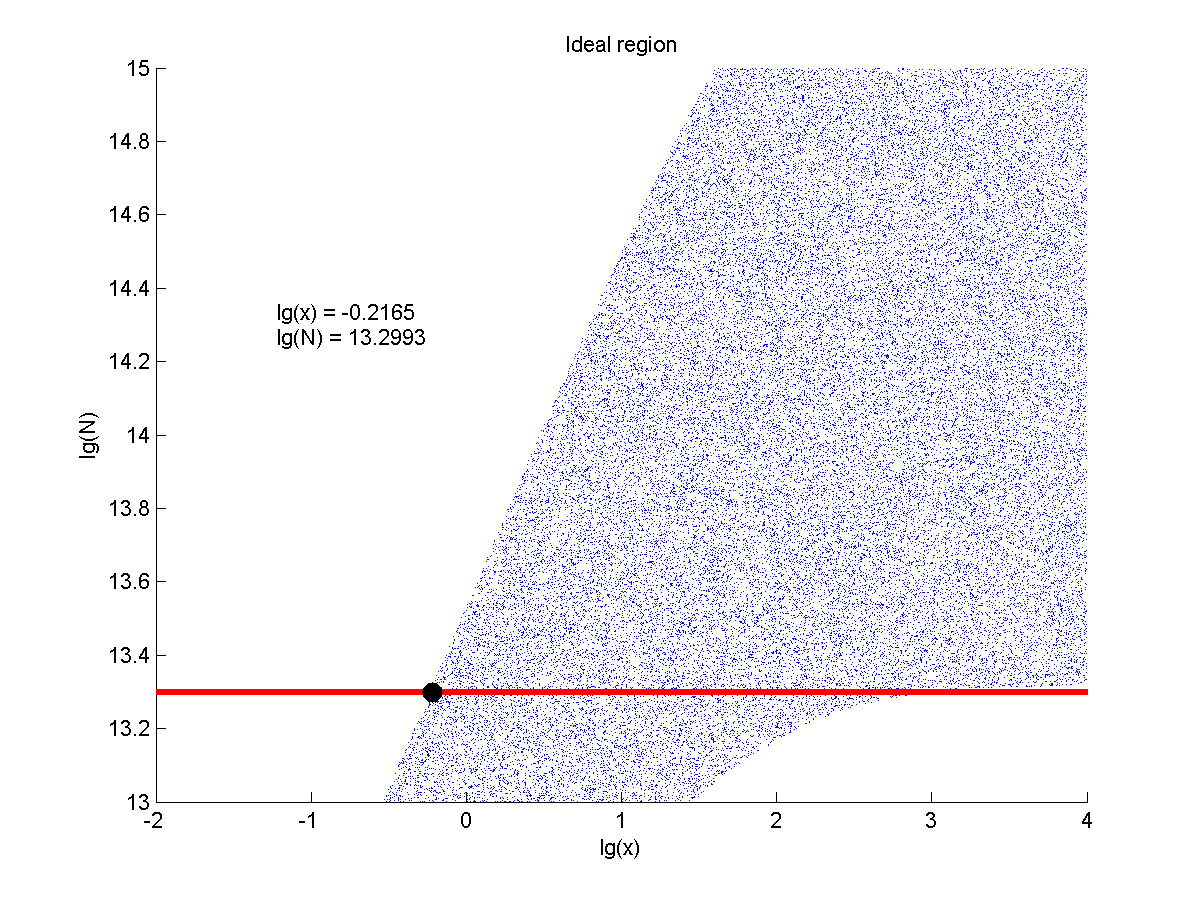
Furthermore, we consider that it is conducive to signal detection when the values of signal intensity and signal to noise ratio are both greater than two. We obtain the ideal region through calculation, which is shown as below.
Figure 7. Ideal region
Region of qualified logarithm of concentrations of miRNA (pM) and logarithm of the additional amount of fusion proteins.
When the value of N is set to 1013.3, the range of the value of x contained in the ideal region is the largest, which means when the value of the molecule number of fusion proteins is 1013.3, the concentration range of miRNA contained in the ideal region is the largest.
Conclusion
Based on our simulation, we came to the conclusion that:
The calculated trend of the signal intensity with the change of the concentration of miRNA from our model is consistent with the trend we obtained in our laboratory work.
The value of the molecule number of fusion protein of dCas9 and split-HRP fragments not only affects the signal-to-noise ratio, but also the signal intensity. So we need to weigh its impact on both to select the optimal solution.
The concentration range of miRNA contained in the ideal region is the largest when we set the value of the molecule number of fusion proteins to be 1013.3, we optimize the value of the addition amount of fusion proteins in our wet-lab work based on it.
Reference
1 Deng, R. et al. Toehold-initiated rolling circle amplification for visualizing individual microRNAs in situ in single cells. Angew Chem Int Ed Engl 53, 2389- 2393, doi:10.1002/anie.201309388 (2014).


