Zhuchushu13 (Talk | contribs) |
Zhuchushu13 (Talk | contribs) |
||
| Line 1,604: | Line 1,604: | ||
</br> | </br> | ||
</html> | </html> | ||
| − | |||
[[File:T--NUDT_CHINA--modelfig7-2.jpg|700px|center]] | [[File:T--NUDT_CHINA--modelfig7-2.jpg|700px|center]] | ||
<html> | <html> | ||
| Line 1,611: | Line 1,610: | ||
<span style="line-height:2;font-family:Perpetua;font- | <span style="line-height:2;font-family:Perpetua;font- | ||
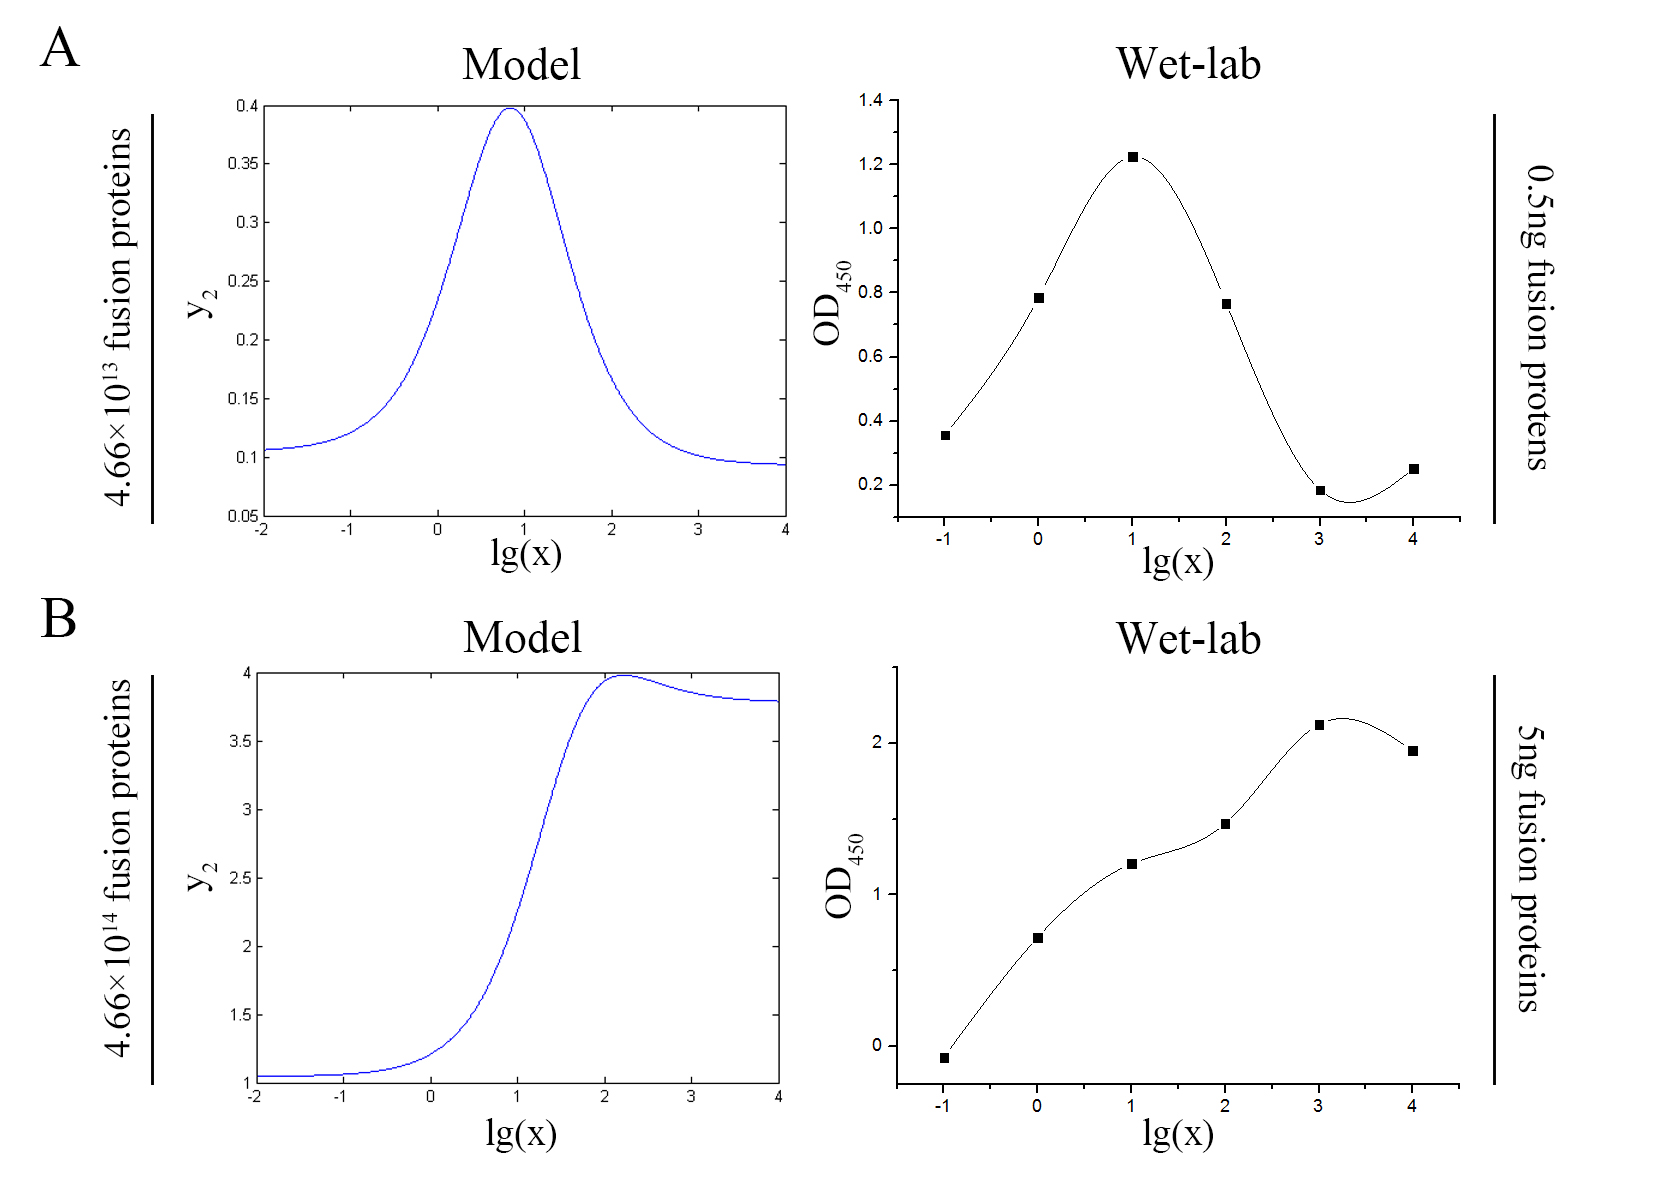
| − | size:18px;"><b>Figure 7. Test of model</b> | + | size:18px;"><b>Figure 7. Test of model</b> Plot of the signal intensity (OD<sub>450</sub>) against miRNA concentration (pM) predicted by the model and experimented by wet-lab. (A) The value of the molecule number of each fusion protein added to the system is set to be 4.66e+13. The mass of each fusion protein added to the system in wet-lab is 0.5 ng. (B) The value of the molecule number of each fusion protein added to the system is set to be 4.66e+14. The mass of each fusion protein added to the system in wet-lab is 5 ng.</span> |
| − | intensity (OD<sub>450</sub>) against miRNA concentration (pM) predicted by the | + | |
| − | model | + | |
| − | 4.66e+13. | + | |
| − | + | ||
| − | + | ||
| − | + | ||
| − | + | ||
| − | + | ||
| − | to be 4.66e+14. | + | |
| − | + | ||
| − | + | ||
</p> | </p> | ||
Revision as of 10:52, 19 October 2016
TOP


