Qiuxinyuan12 (Talk | contribs) |
Zhuchushu13 (Talk | contribs) |
||
| Line 757: | Line 757: | ||
<p> | <p> | ||
<b><span style="line-height:2;font-family:Perpetua;font-size:18px;"> </span></b> | <b><span style="line-height:2;font-family:Perpetua;font-size:18px;"> </span></b> | ||
| + | </p> | ||
| + | |||
| + | |||
| + | <!--标题--> | ||
| + | <h2> | ||
| + | <span><span style="color:#7f1015">Modeling</span></span><hr /> | ||
| + | </h2> | ||
| + | |||
| + | <!--标题--> | ||
| + | <h3> | ||
| + | <span><span style="color:#7f1015">Establishing the | ||
| + | |||
| + | model</span></span><hr /> | ||
| + | </h3> | ||
| + | |||
| + | <!--正文--> | ||
| + | <p style="text-indent:22pt;"> | ||
| + | <span style="line-height:2;font-family:Perpetua;font-size:18px;">To | ||
| + | |||
| + | evaluate the effectiveness of initial design and provide improvement guidelines | ||
| + | |||
| + | for our project, the model was created.</span> | ||
</p> | </p> | ||
| + | </br> | ||
| + | |||
| + | |||
| + | <!--正文--> | ||
| + | <p style="text-indent:22pt;"> | ||
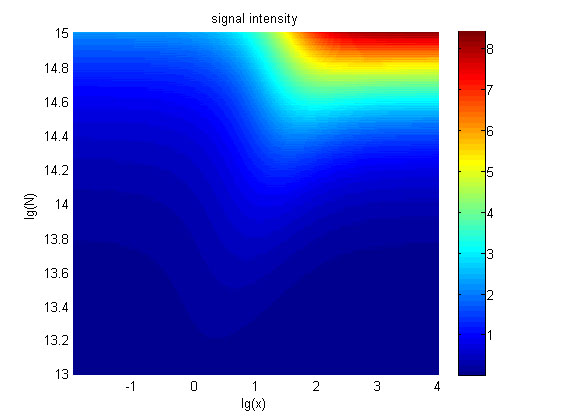
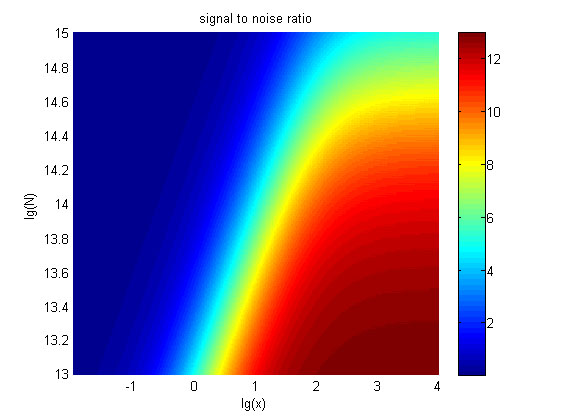
| + | <span style="line-height:2;font-family:Perpetua;font-size:18px;">The | ||
| + | |||
| + | relationships between the signal to noise ratio (SNR), the signal intensity | ||
| + | |||
| + | respectively and the concentration of miRNA under different additional amount of | ||
| + | |||
| + | fusion proteins were discussed mainly in this model. For such matter, | ||
| + | |||
| + | theoretical calculation and experimental results were well integrated and a | ||
| + | |||
| + | brilliant probability model was introduced. | ||
| + | The relationships were obtained and shown below. | ||
| + | </span> | ||
| + | </p> | ||
| + | </br> | ||
| + | |||
| + | |||
| + | <!--图和图注--> | ||
| + | </br> | ||
| + | </html> | ||
| + | [[File:T--NUDT_CHINA--modelfig5.jpg|700px|center]] | ||
| + | <html> | ||
| + | </br> | ||
| + | <p> | ||
| + | <span style="line-height:2;font-family:Perpetua;font- | ||
| + | |||
| + | size:18px;"><b>Figure | ||
| + | 5. The signal intensity (OD<sub>450</sub>)</b> Three-dimensional map of signal | ||
| + | |||
| + | intensity (OD<sub>450</sub>) | ||
| + | against miRNA concentration(pM) and additional amount of fusion proteins.</span> | ||
| + | </p> | ||
| + | </br> | ||
| + | |||
| + | |||
| + | |||
| + | <!--图和图注--> | ||
| + | </br> | ||
| + | </html> | ||
| + | [[File:T--NUDT_CHINA--modelfig6.jpg|700px|center]] | ||
| + | <html> | ||
| + | </br> | ||
| + | <p> | ||
| + | <span style="line-height:2;font-family:Perpetua;font- | ||
| + | |||
| + | size:18px;"><b>Figure 6. The result of SNR</b> Three-dimensional map of signal | ||
| + | |||
| + | to noise ratio against miRNA concentration (pM) and additional amount of fusion | ||
| + | |||
| + | proteins.</span> | ||
| + | </p> | ||
| + | </br> | ||
| + | |||
| + | |||
| + | <!--标题--> | ||
| + | <h3> | ||
| + | <span><span style="color:#7f1015">Testing the model</span></span><hr /> | ||
| + | </h3> | ||
| + | |||
| + | <!--正文--> | ||
| + | <p style="text-indent:22pt;"> | ||
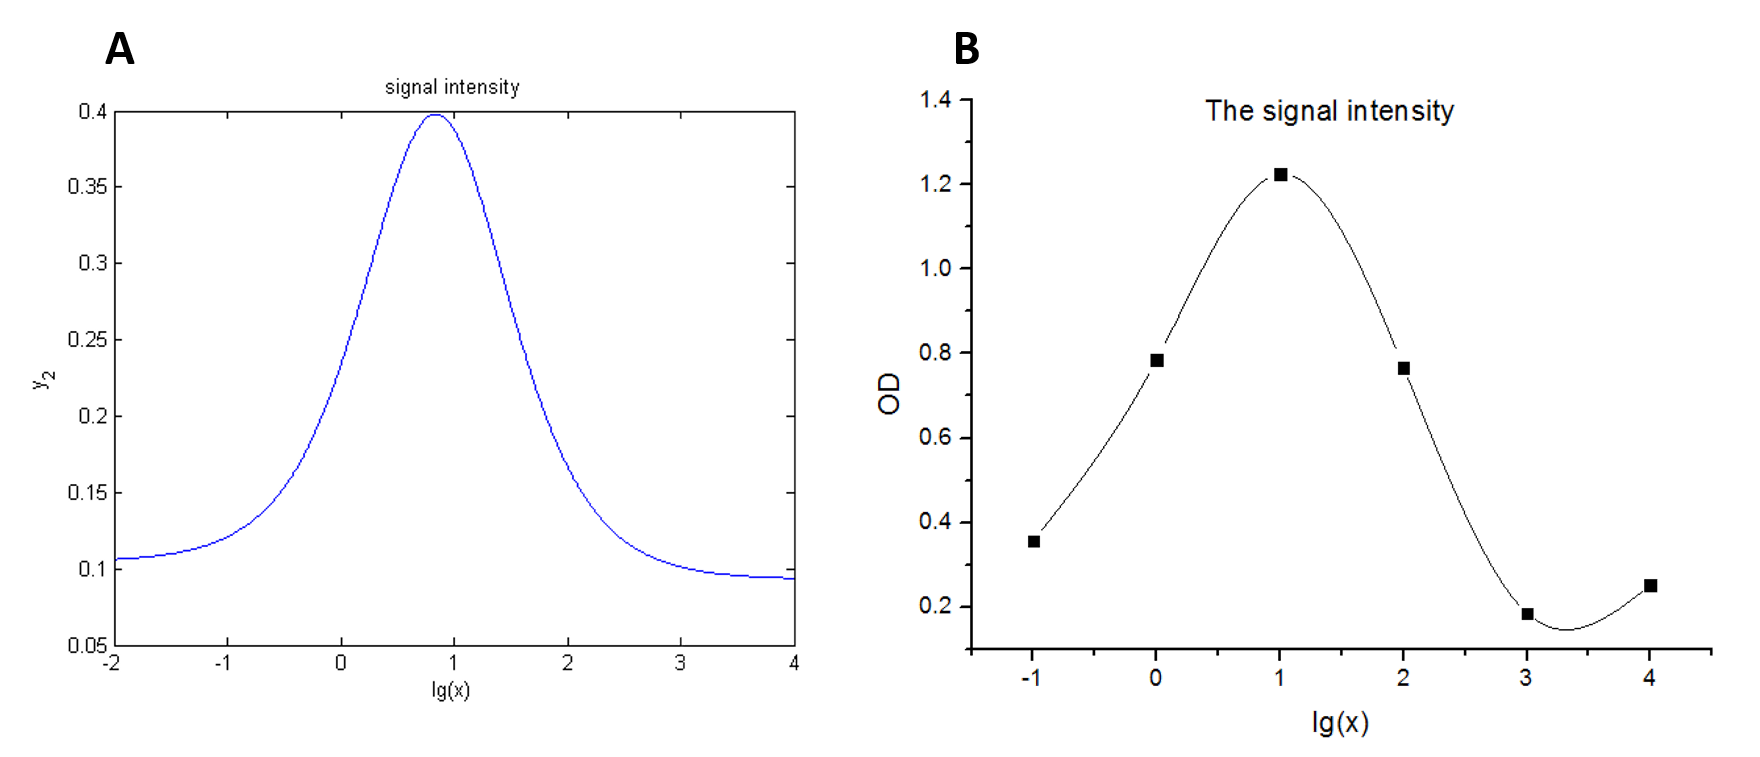
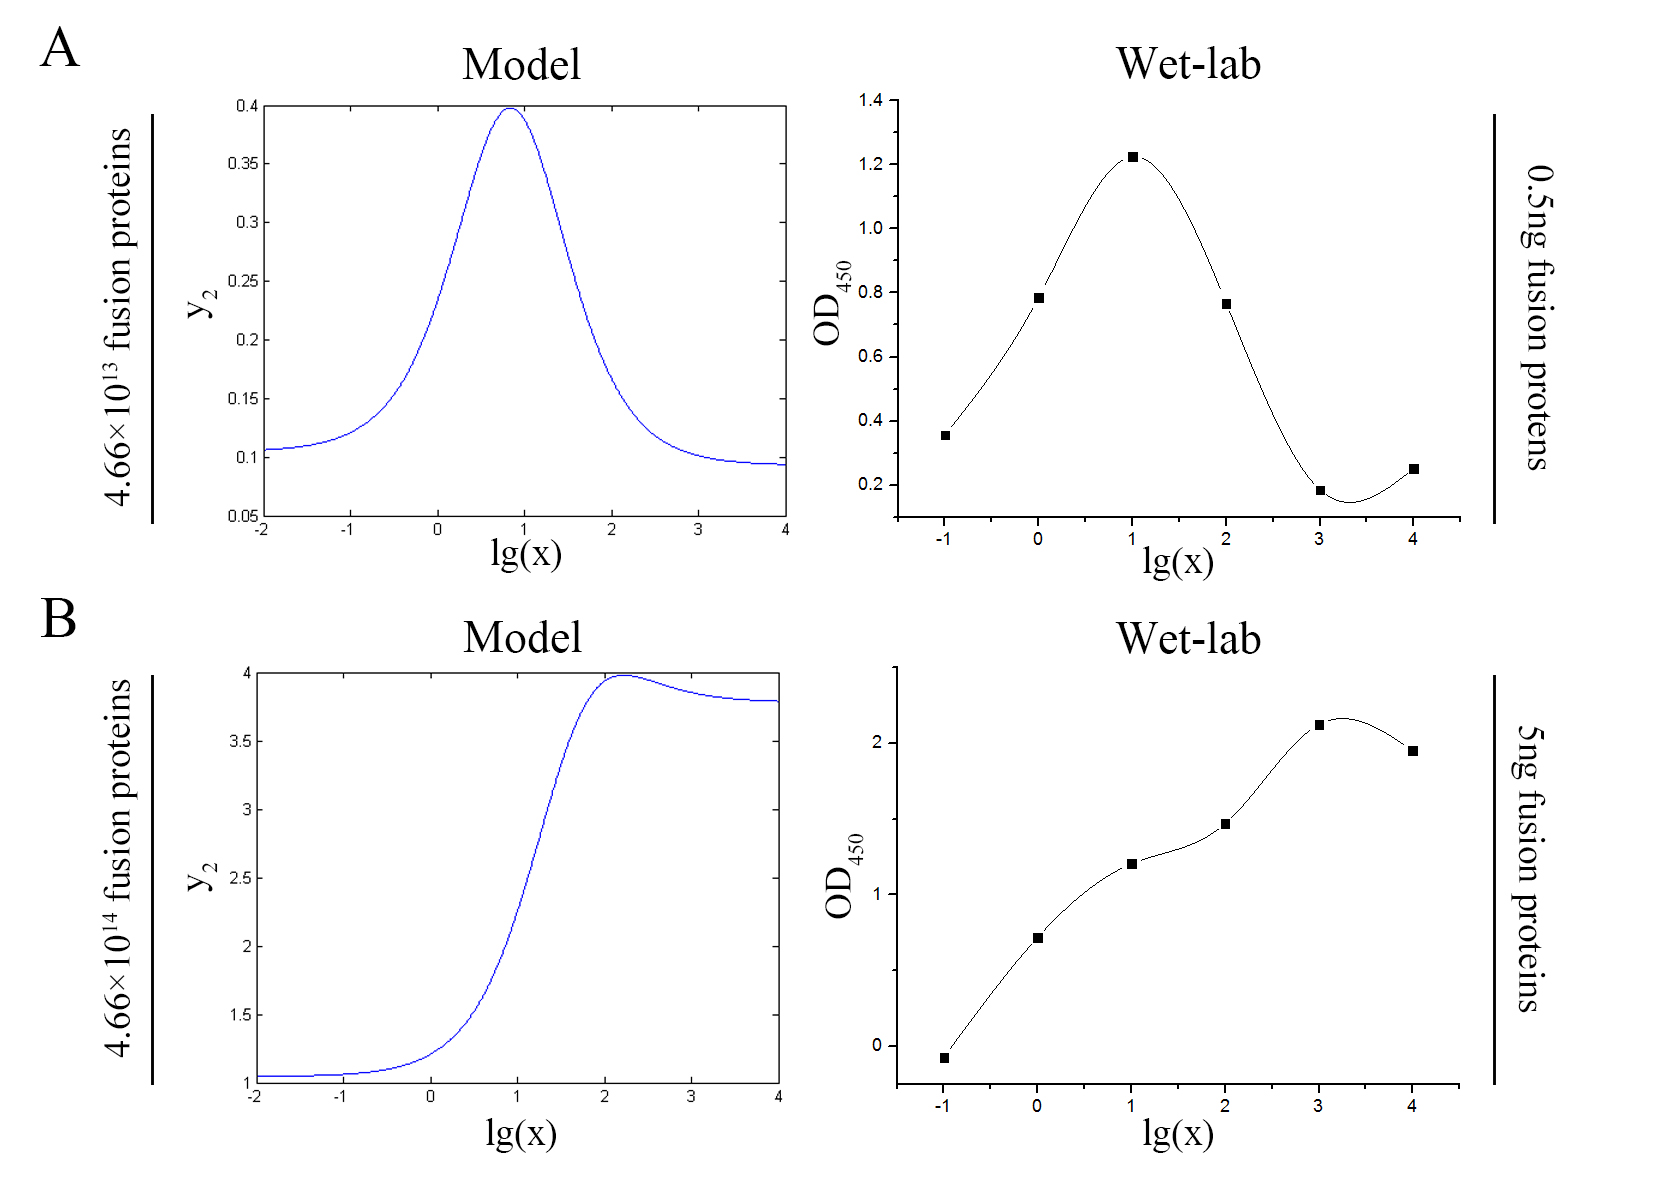
| + | <span style="line-height:2;font-family:Perpetua;font-size:18px;">The | ||
| + | |||
| + | accuracy of the model was tested by comparing the curves predicted by the model | ||
| + | |||
| + | with those obtained from the experiment. </span> | ||
| + | </p> | ||
| + | </br> | ||
| + | |||
| + | |||
| + | |||
| + | |||
| + | <!--图和图注--> | ||
| + | </br> | ||
| + | </html> | ||
| + | [[File:T--NUDT_CHINA--modelfig7-1.jpg|700px|center]] | ||
| + | [[File:T--NUDT_CHINA--modelfig7-2.jpg|700px|center]] | ||
| + | <html> | ||
| + | </br> | ||
| + | <p> | ||
| + | <span style="line-height:2;font-family:Perpetua;font- | ||
| + | |||
| + | size:18px;"><b>Figure 7. Test of model</b> (A) Plot of the signal | ||
| + | intensity (OD<sub>450</sub>) against miRNA concentration (pM) predicted by the | ||
| + | model with the value of the molecule number of the fusion proteins set to be | ||
| + | 4.66e+13. (B)<span> Plot of the | ||
| + | signal intensity (OD<sub>450</sub>) against miRNA concentration (pM) obtained | ||
| + | from the experiment with the value of the molecule number of the fusion | ||
| + | proteins set to be 4.66e+13. (C) Plot of the | ||
| + | signal intensity (OD<sub>450</sub>) against miRNA concentration (pM) predicted | ||
| + | by the model with the value of the molecule number of the fusion proteins set | ||
| + | to be 4.66e+14. (D) Plot of the signal intensity (OD450) against miRNA | ||
| + | concentration (pM) obtained from the experiment with the value of the molecule | ||
| + | number of the fusion proteins set to be 4.66e+14.</span> | ||
| + | </p> | ||
| + | |||
| + | </br> | ||
| + | |||
| + | |||
| + | |||
| + | <!--正文--> | ||
| + | <p style="text-indent:22pt;"> | ||
| + | <span style="line-height:2;font-family:Perpetua;font-size:18px;">The curves | ||
| + | |||
| + | predicted by the model were in good agreement with the experimental | ||
| + | |||
| + | results.</span> | ||
| + | </p> | ||
| + | </br> | ||
| + | |||
| + | |||
| + | <!--标题--> | ||
| + | <h3> | ||
| + | <span><span style="color:#7f1015">Optimizing our wet-lab | ||
| + | |||
| + | protocol</span></span><hr /> | ||
| + | </h3> | ||
| + | |||
| + | <!--正文--> | ||
| + | <p style="text-indent:22pt;"> | ||
| + | <span style="line-height:2;font-family:Perpetua;font-size:18px;">The | ||
| + | |||
| + | situation when the value of signal intensity and SNR were both greater than two | ||
| + | |||
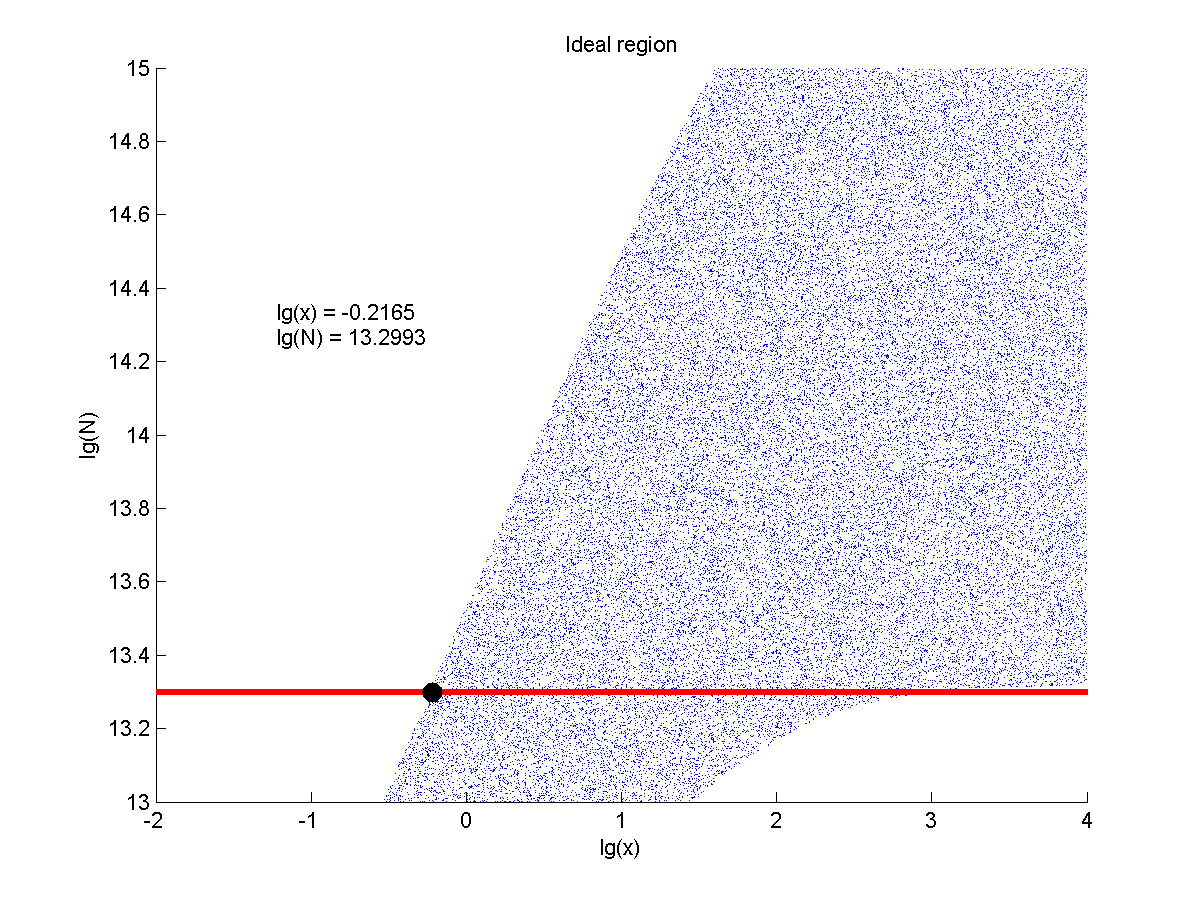
| + | was considered to be conducive to signal detection. Thus an ideal region was | ||
| + | |||
| + | obtained through calculation.</span> | ||
| + | </p> | ||
| + | </br> | ||
| + | |||
| + | |||
| + | <!--图和图注--> | ||
| + | </br> | ||
| + | </html> | ||
| + | [[File:T--NUDT_CHINA--modelfig7.jpg|700px|center]] | ||
| + | <html> | ||
| + | </br> | ||
| + | <p> | ||
| + | <span style="line-height:2;font-family:Perpetua;font- | ||
| + | |||
| + | size:18px;"><b>Figure 8. Ideal region</b> Region of qualified logarithm of | ||
| + | |||
| + | concentrations of miRNA (pM) and logarithm of the additional amount of fusion | ||
| + | |||
| + | proteins.</span> | ||
| + | </p> | ||
| + | |||
| + | </br> | ||
| + | |||
| + | |||
| + | |||
| + | <!--正文--> | ||
| + | <p style="text-indent:22pt;"> | ||
| + | <span style="line-height:2;font-family:Perpetua;font-size:18px;">The | ||
| + | |||
| + | concentration range of miRNA that can be detected is maximum when we set the | ||
| + | |||
| + | value of the molecule number of the fusion proteins to be e+13.3, building on | ||
| + | |||
| + | which, our wet-lab protocol could be optimized in our future work. </span> | ||
| + | </p> | ||
| + | </br> | ||
| + | |||
| + | |||
| + | |||
| + | |||
| + | |||
| + | |||
</br> | </br> | ||
<h2> | <h2> | ||
Revision as of 05:11, 19 October 2016
TOP

