Qiuxinyuan12 (Talk | contribs) |
|||
| Line 758: | Line 758: | ||
<b><span style="line-height:2;font-family:Perpetua;font-size:18px;"> </span></b> | <b><span style="line-height:2;font-family:Perpetua;font-size:18px;"> </span></b> | ||
</p> | </p> | ||
| + | |||
| + | |||
| Line 767: | Line 769: | ||
<!--标题--> | <!--标题--> | ||
<h3> | <h3> | ||
| − | <span><span style="color:#7f1015"> | + | <span><span style="color:#7f1015">Obtaining the relationship</span></span><hr /> |
| − | + | ||
| − | + | ||
</h3> | </h3> | ||
<!--正文--> | <!--正文--> | ||
<p style="text-indent:22pt;"> | <p style="text-indent:22pt;"> | ||
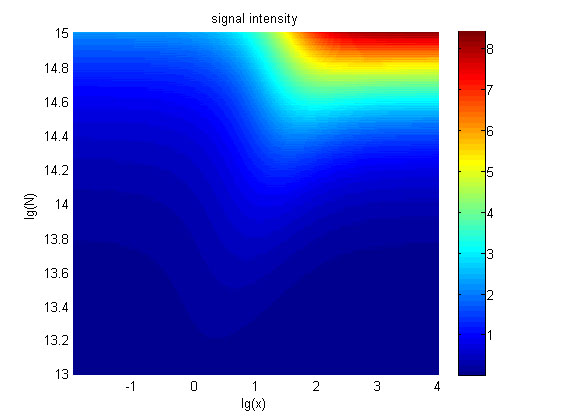
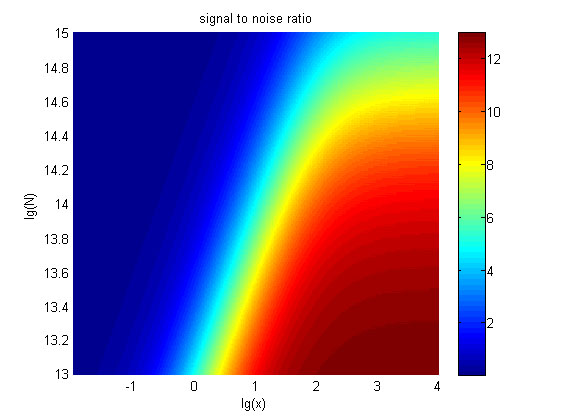
| − | + | <span style="line-height:2;font-family:Perpetua;font-size:18px;">The relationships between the signal to noise ratio (SNR), the signal intensity respectively and the concentration of miRNA under different additional amount of fusion proteins were discussed mainly in this model. For such matter, theoretical calculation and experimental results were well integrated and a brilliant probability model was introduced. | |
| − | + | ||
| − | + | ||
| − | + | ||
| − | + | ||
| − | + | ||
| − | + | ||
| − | + | ||
| − | + | ||
| − | + | ||
| − | + | ||
| − | <span style="line-height:2;font-family:Perpetua;font-size:18px;">The | + | |
| − | + | ||
| − | relationships between the signal to noise ratio (SNR), the signal intensity | + | |
| − | + | ||
| − | respectively and the concentration of miRNA under different additional amount of | + | |
| − | + | ||
| − | fusion proteins were discussed mainly in this model. For such matter, | + | |
| − | + | ||
| − | theoretical calculation and experimental results were well integrated and a | + | |
| − | + | ||
| − | brilliant probability model was introduced. | + | |
The relationships were obtained and shown below. | The relationships were obtained and shown below. | ||
</span> | </span> | ||
| Line 812: | Line 791: | ||
size:18px;"><b>Figure | size:18px;"><b>Figure | ||
| − | + | 9. The signal intensity (OD<sub>450</sub>)</b> Three-dimensional map of signal | |
intensity (OD<sub>450</sub>) | intensity (OD<sub>450</sub>) | ||
| Line 830: | Line 809: | ||
<span style="line-height:2;font-family:Perpetua;font- | <span style="line-height:2;font-family:Perpetua;font- | ||
| − | size:18px;"><b>Figure | + | size:18px;"><b>Figure 10. The result of SNR</b> Three-dimensional map of signal |
to noise ratio against miRNA concentration (pM) and additional amount of fusion | to noise ratio against miRNA concentration (pM) and additional amount of fusion | ||
| Line 846: | Line 825: | ||
<!--正文--> | <!--正文--> | ||
<p style="text-indent:22pt;"> | <p style="text-indent:22pt;"> | ||
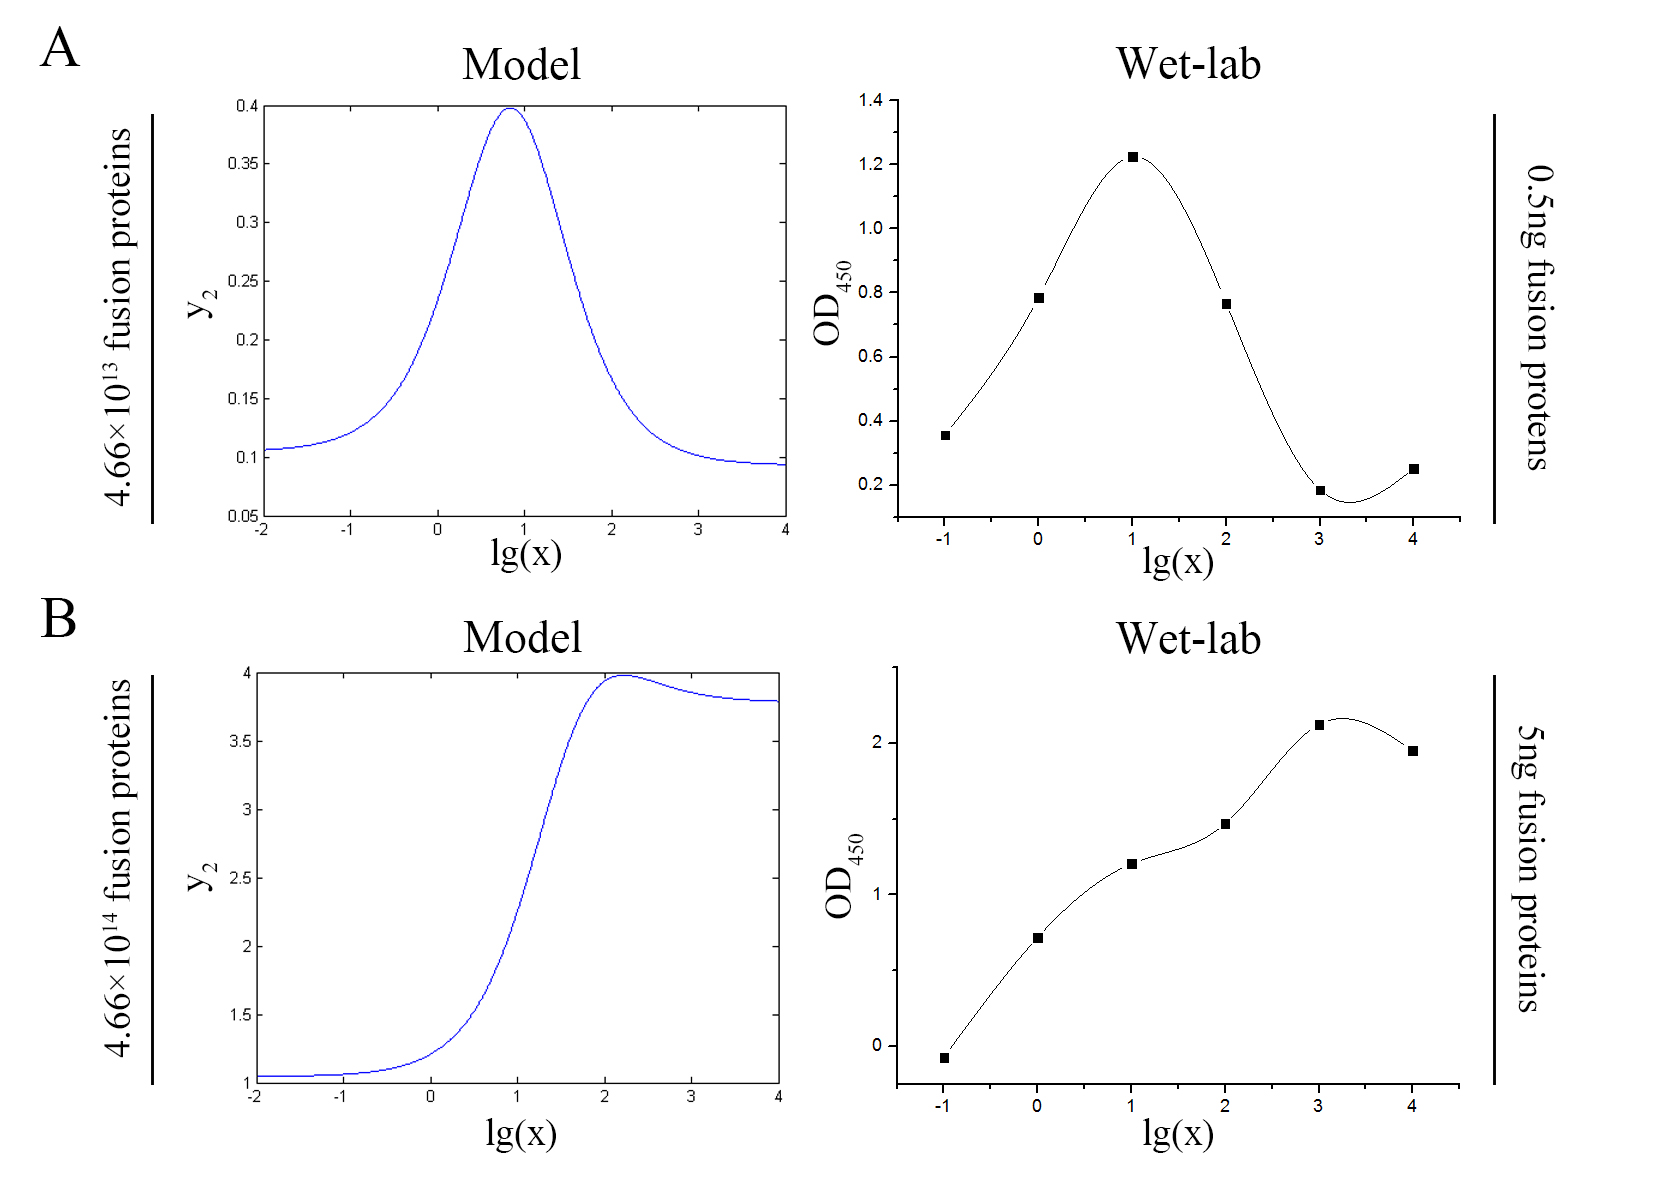
| − | <span style="line-height:2;font-family:Perpetua;font-size:18px;">The | + | <span style="line-height:2;font-family:Perpetua;font-size:18px;">The accuracy of the model was tested by comparing the curves predicted by the model with those obtained from the experiment. </span> |
| − | + | ||
| − | accuracy of the model was tested by comparing the curves predicted by the model | + | |
| − | + | ||
| − | with those obtained from the experiment. </span> | + | |
</p> | </p> | ||
</br> | </br> | ||
| Line 860: | Line 835: | ||
</br> | </br> | ||
</html> | </html> | ||
| − | |||
[[File:T--NUDT_CHINA--modelfig7-2.jpg|700px|center]] | [[File:T--NUDT_CHINA--modelfig7-2.jpg|700px|center]] | ||
<html> | <html> | ||
| Line 867: | Line 841: | ||
<span style="line-height:2;font-family:Perpetua;font- | <span style="line-height:2;font-family:Perpetua;font- | ||
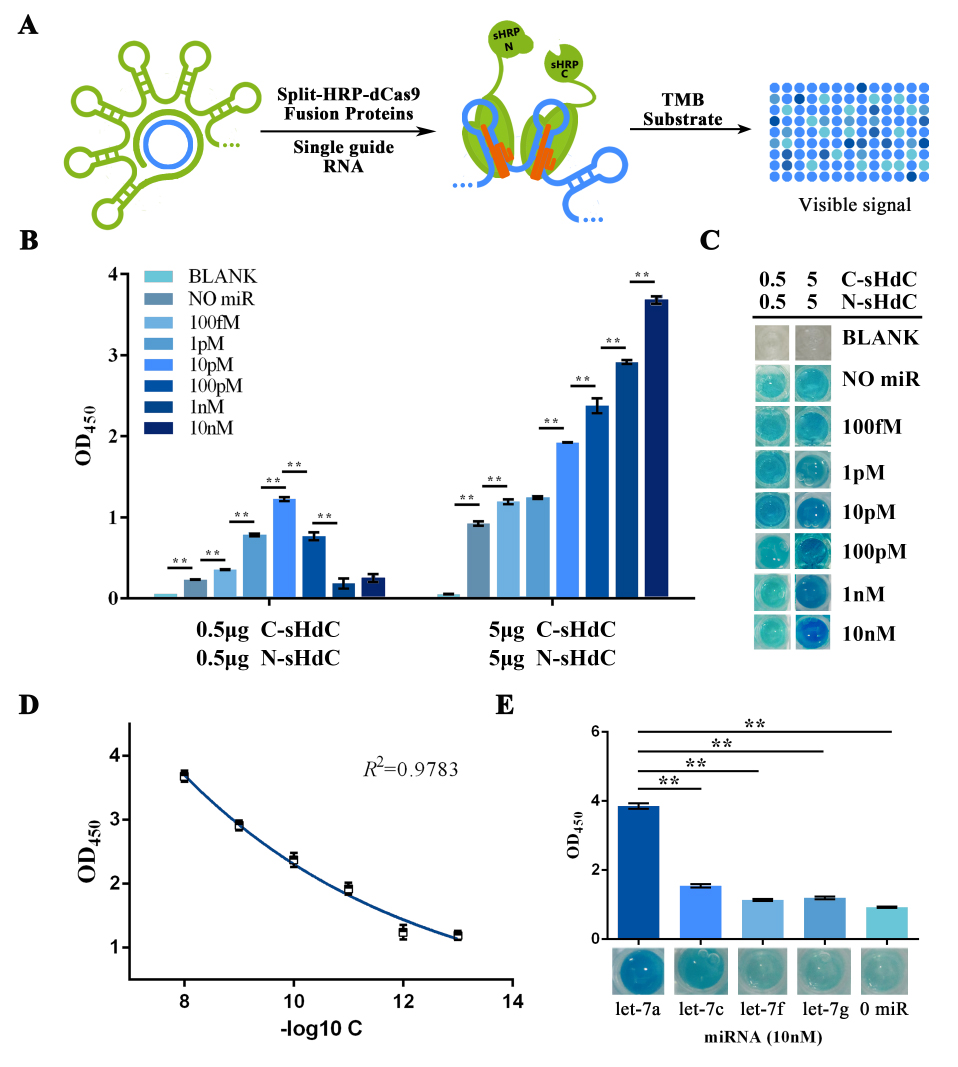
| − | size:18px;"><b>Figure | + | size:18px;"><b>Figure 11. Test of model</b> Plot of the signal intensity (OD<sub>450</sub>) against miRNA concentration (pM) predicted by the model and experimented by wet-lab. (A) The value of the molecule number of each fusion protein added to the system is set to be 4.66e+13. The mass of each fusion protein added to the system in wet-lab is 0.5 ng. (B) The value of the molecule number of each fusion protein added to the system is set to be 4.66e+14. The mass of each fusion protein added to the system in wet-lab is 5 ng.</span> |
| − | intensity (OD<sub>450</sub>) against miRNA concentration (pM) predicted by the | + | |
| − | model | + | |
| − | 4.66e+13. | + | |
| − | + | ||
| − | + | ||
| − | + | ||
| − | + | ||
| − | + | ||
| − | to be 4.66e+14. | + | |
| − | + | ||
| − | + | ||
</p> | </p> | ||
| Line 887: | Line 850: | ||
<!--正文--> | <!--正文--> | ||
<p style="text-indent:22pt;"> | <p style="text-indent:22pt;"> | ||
| − | <span style="line-height:2;font-family:Perpetua;font-size:18px;">The curves | + | <span style="line-height:2;font-family:Perpetua;font-size:18px;">The general trend of curves predicted by the model were in good agreement with the experimental results.</span> |
| − | + | ||
| − | predicted by the model were in good agreement with the experimental | + | |
| − | + | ||
| − | results.</span> | + | |
</p> | </p> | ||
</br> | </br> | ||
| Line 898: | Line 857: | ||
<!--标题--> | <!--标题--> | ||
<h3> | <h3> | ||
| − | <span><span style="color:#7f1015">Optimizing our wet-lab | + | <span><span style="color:#7f1015">Optimizing our wet-lab protocol</span></span><hr /> |
| − | + | ||
| − | protocol</span></span><hr /> | + | |
</h3> | </h3> | ||
<!--正文--> | <!--正文--> | ||
<p style="text-indent:22pt;"> | <p style="text-indent:22pt;"> | ||
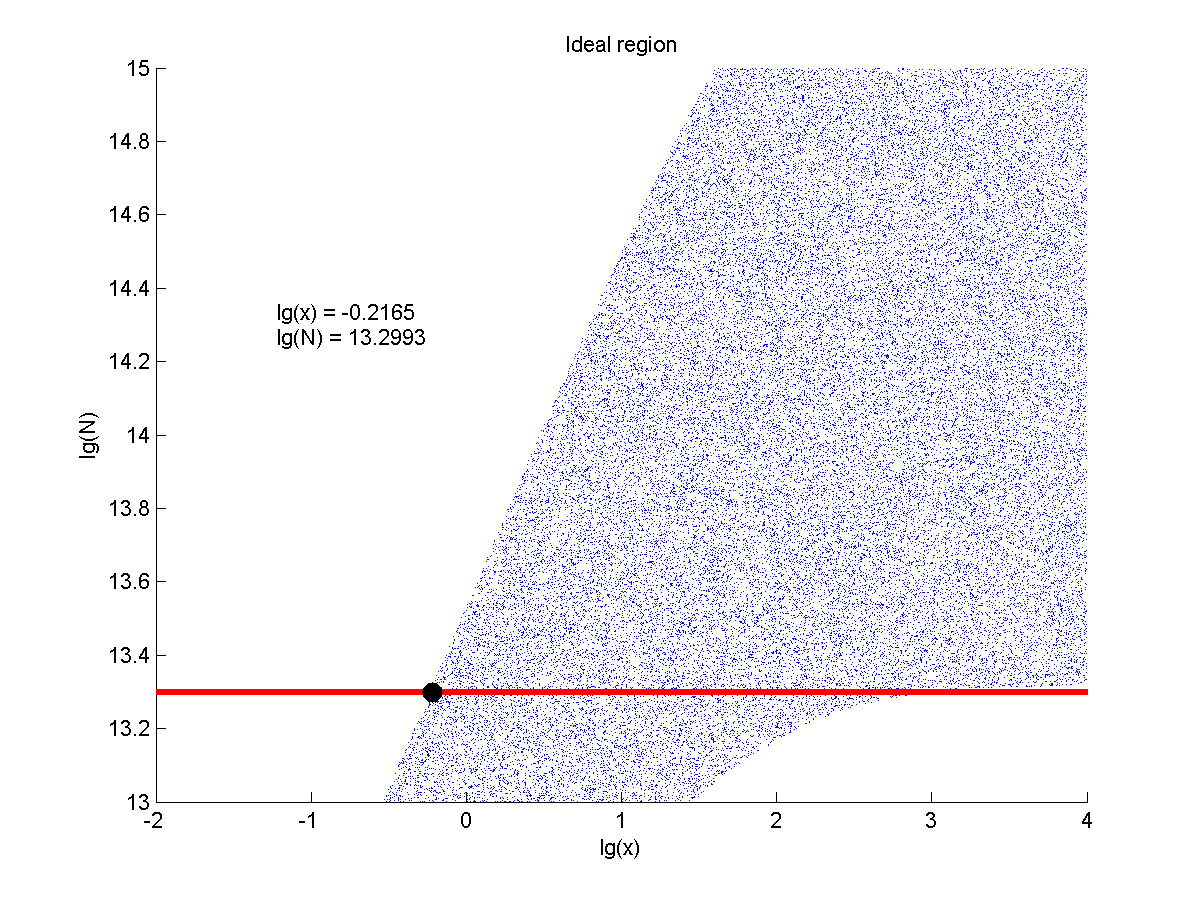
| − | <span style="line-height:2;font-family:Perpetua;font-size:18px;">The | + | <span style="line-height:2;font-family:Perpetua;font-size:18px;">The situation when the value of signal intensity and SNR were both greater than two was considered to be conducive to signal detection. Thus an ideal region was obtained through calculation.</span> |
| − | + | ||
| − | situation when the value of signal intensity and SNR were both greater than two | + | |
| − | + | ||
| − | was considered to be conducive to signal detection. Thus an ideal region was | + | |
| − | + | ||
| − | obtained through calculation.</span> | + | |
</p> | </p> | ||
</br> | </br> | ||
| Line 938: | Line 889: | ||
<!--正文--> | <!--正文--> | ||
<p style="text-indent:22pt;"> | <p style="text-indent:22pt;"> | ||
| − | <span style="line-height:2;font-family:Perpetua;font-size:18px;">The | + | <span style="line-height:2;font-family:Perpetua;font-size:18px;">The concentration range of miRNA that can be detected is maximum when we set the value of the molecule number of the fusion proteins to be e+13.3, building on which, our wet-lab protocol could be optimized in our future work. </span> |
| − | + | ||
| − | concentration range of miRNA that can be detected is maximum when we set the | + | |
| − | + | ||
| − | value of the molecule number of the fusion proteins to be e+13.3, building on | + | |
| − | + | ||
| − | which, our wet-lab protocol could be optimized in our future work. </span> | + | |
</p> | </p> | ||
</br> | </br> | ||
| − | |||
| − | |||
Revision as of 16:02, 19 October 2016
TOP

