Team:Pittsburgh/Model

Contact Us
Thank you to our sponsors!


The Effect of Lead Contamination in Drinking Water on a Young Population
In developing a lead sensor for our project, we were curious about the effects of lead contamination in the water supply on small children. How do their bodies metabolize it? Where does it go? We were pretty appalled by the devastating effects lead can have on the human body and how long it can persist even after the initial exposure. Many journals report that there can be devastating neurological and physiological impairments from even the smallest exposure and there is no safe dosage of lead.
Very often, a journal would give a range of blood-lead levels and say that it correlated with a specific impairment but no paper was able to show a level or duration of contamination that resulted in that blood-lead level. Without this, we couldn't really gauge what level of lead exposure and for how long a person could be exposed to lead and miss out on the devastating health benefits. So we decided to try and model it!
We began with a thorough examination of the literature, looking for important details on how much lead is absorbed into the body, where the absorbed lead goes, and how long it stays in the body. With these literature values, we were able to create a rudimentary mass balance of the human body focusing on the amount of lead ingested and the amount that is excreted. We decided to treat the blood and bones of a contaminated person as two different systems to more accurately model how the body metabolizes lead and processes it. Our simplified version of how the body metabolizes lead is shown below.

The basic format of the differential equations for the two systems are included below.
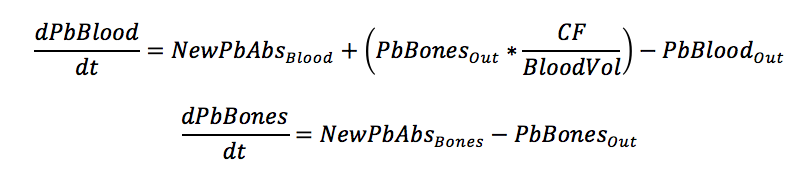
To put the differential equations into terms that could be measured, estimated, or taken from literature, the following substitutions were made.

Below is the definition of each variable used in the differential equations. Units are included (as well as conversion factors) for dimensional analysis and confirming that each term is correct

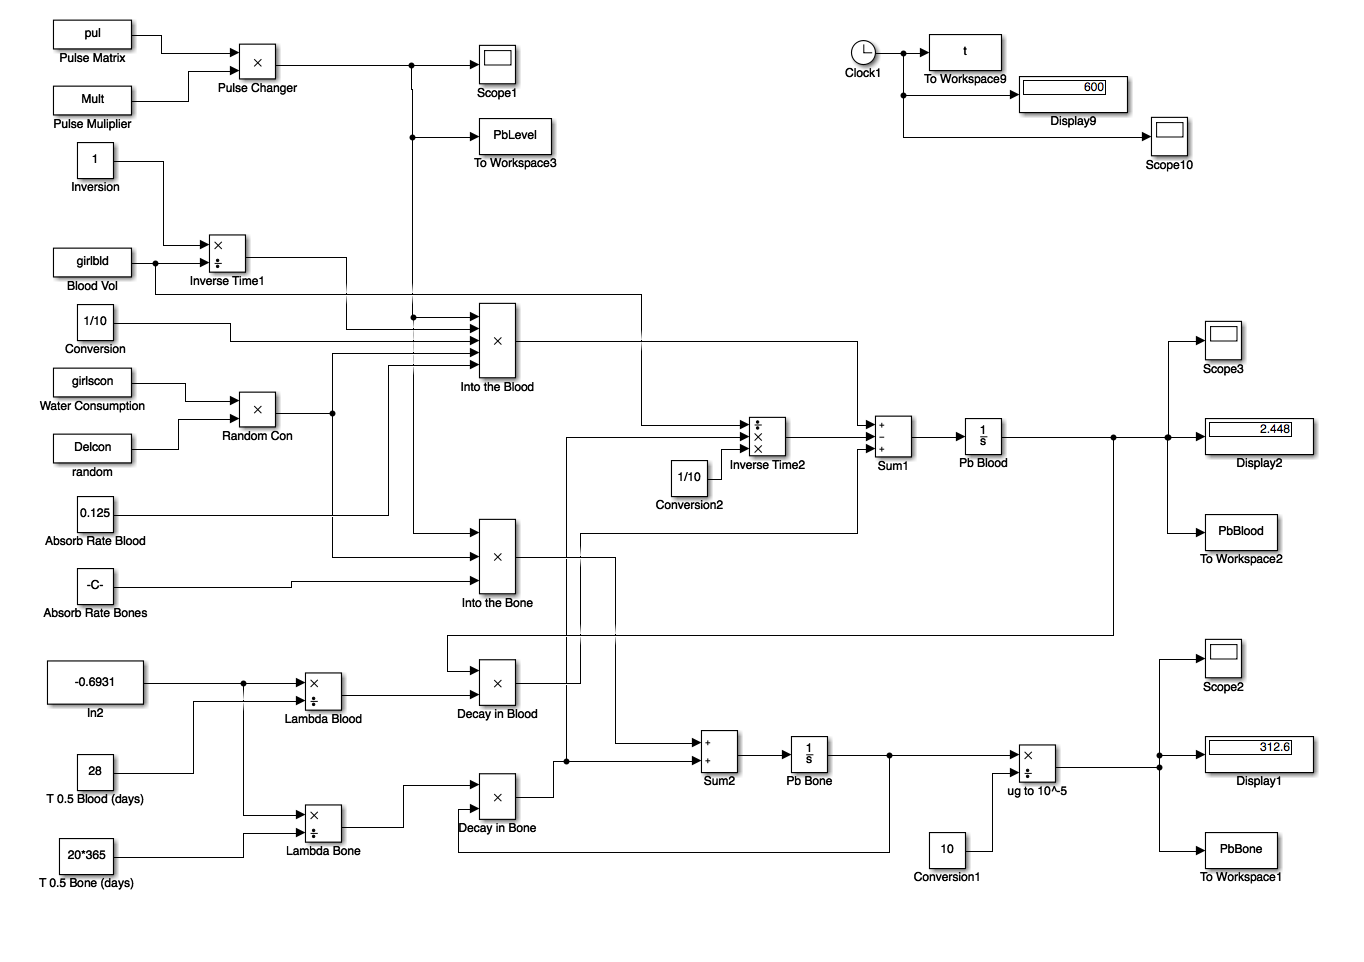
From these differential equations, we generated a Simulink Model in MatLab 2016a and used a script to input values. The Simulink Model is shown below.
We were able to find the average water consumed by a child based on their age in order to get an idea of their lead intake. In order to effectively simulate the "daily consumption", we used a random variable to guess how much water they drank on a given day (since many children also get water from juice, soda, and other beverages). The random variable was used to predict anywhere from 20-100% water consumption from contaminated tap water. This gave us a range of possible blood lead level concentrations based off of the level of lead contamination as we will see later.
Determining the blood volume was a little tricky. We were able to find a correlation that related a person's height and weight to an average blood volume. From there we looked up average values for children's height and weight over time. Using the reference values for height and weight, we calculated the average amount of blood for a person and related it to their age.
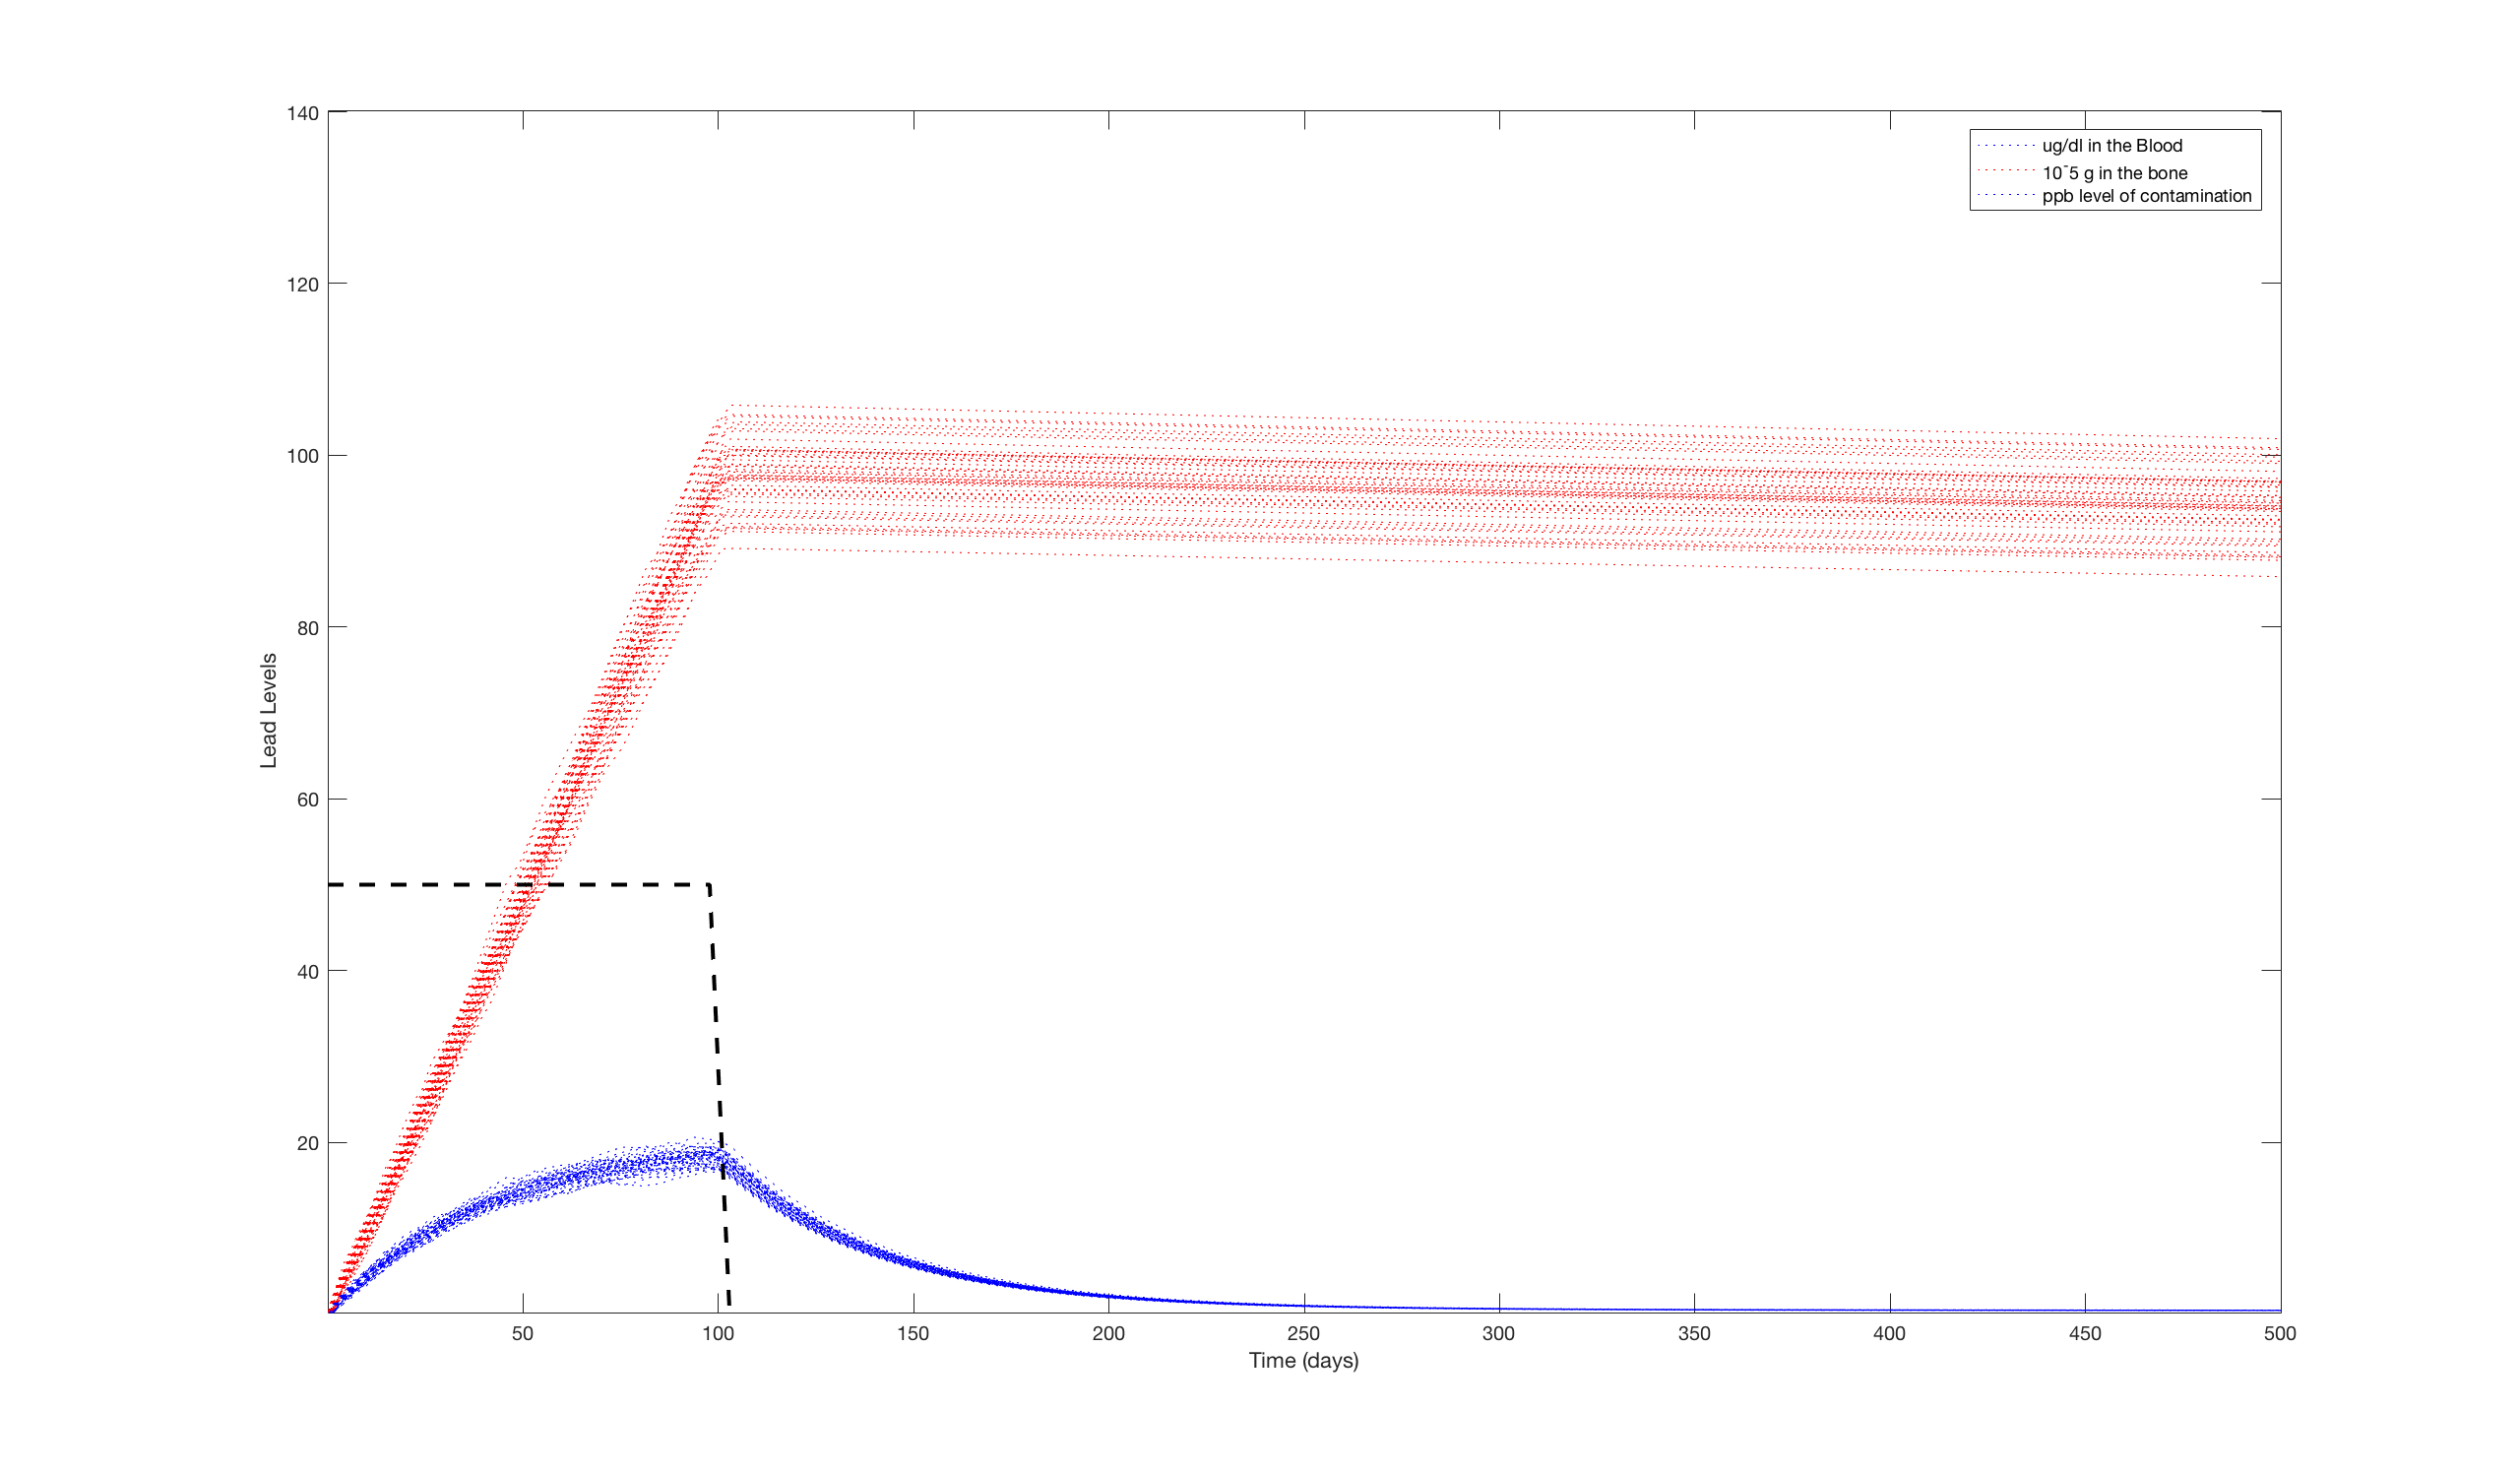
With all the important information put into the model, we were able to begin simulating lead exposure. Initially, we used a pulse of lead contamination of 50 ppb for 10 days on a 1-year-old child. This was meant to simulate a brief exposure to a mild amount of lead. We decided to model it using a 500 day window to see the long-term effects of lead exposure. To account for the different amounts of water a child may drink in a given day, we ran the simulation 50 times and plotted them all on the same graph. The results of these simulations are below

It's clear that while the blood lead levels spike quickly, the body is able to filter the lead out of its system within 3 or 4 months after the initial exposure. This is not true for the bones because the lead that makes it into the bones stays around much longer. Unfortunately, this means that the child will continue to have prolonged exposure to lead at a very low level. As of yet there is no hard evidence that proves such a long exposure to lead at a low level can do any damage, there is a growing notion that an exposure like this at such a young age can make the individual at higher risk for depression and other neurological conditions.
We decided to look at the same level of exposure (50 ppb) but for increasing intervals of time (ranging from the initial 10 days and increasing to 25, 50 and 100 days of exposure. The results of these simulations are shown below


Here we can see that even though the increase in lead in the bones is linear with time, the concentration of lead in the blood appears to begin reaching a saturation point. To explore this trend, we ran 10 simulations, increasing the duration of exposure by 10 days each time. The results of this simulation are shown below.

To get a better look at just the blood concentrations, below is a zoomed-in portion of the same graph just focussing on blood-lead levels for the first 200 days. You should note that as the duration of exposure increases, so does the variation in blood lead level, meaning that the severity for the same level of contamination will be more of a range than one distinct value.

To examine the effect of severity of exposure over the same period of time, we ran simulations of a 100 day exposure to different levels of contamination range including 25, 50, 75, and 100 ppb.

Again a similar relationship is observed. Blood-lead levels do reach different levels of saturation but now we see that the rate at which lead is absorbed by the bones increases with contamination severity.
This model provides a quantified approach relating the level and duration of lead exposure with the concentration of lead in the blood. Whether it is in estimating the severity of the events in Flint, Michigan or in detecting the threshold of exposure without noticeable side effects, this model could be the first step in better realizing how our bodies take up, store and slowly get rid of lead.