Team:NAU-CHINA/Model/BCA
Benefit-cost function
Different proteins have different expression levels. It is unclear to what extent these expression levels are optimized to their environment. Evolutionary theories suggest that protein expression levels maximize fitness, but the fitness as a function of protein level has seldom been directly measured. To address this, Erez Dekel and Uri Alon studied the lac system of Escherichia coli, which allows the cell to use the sugar lactose for growth. They experimentally measured the growth burden due to production and maintenance of the Lac proteins (cost), as well as the growth advantage (benefit) conferred by the Lac proteins when lactose is present. The fitness function, given by the difference between the benefit and the cost, predicts that for each lactose environment there exists an optimal Lac expression level that maximizes growth rate. They then performed serial dilution evolution experiments at different lactose concentrations. In a few hundred generations, cells evolved to reach the predicted optimal expression levels. Thus, protein expression from the lac operon seems to be a solution of a cost–benefit optimization problem, and can be rapidly tuned by evolution to function optimally in new environments.
(1)Cost
First we need to derive the cost function. The cost is defined as the relative reduction in growth rate due to the burden place on the cell by production and presence of the protein. Studies show that the cost function is nonlinear[1]. It reflect the fact that the resources can be use by cell is limited,so that if the expression of these heterogenous proteins has no restrictions,the production of other important protein will be affect. This may damage the cell. If this kind of damage can be reduced,the degradation will become more efficient.
It’s assumed that the amount of resource in the cell is limited and R was defined as the whole resource. The burden of the production of these proteins can be described as the reduce of the resource(R). Every protein consumes the resource in unit , so the resource left can be described as `R-epsilon Pro`. The growth in the effect of these limited resource can be described as `f_0R//(K_R+R)`. Follow the definition of the cost, we’ll get the equation[1]:
`C(Pro)=-(f(Pro)-f(0))/(f(0))=(f_0R//(K_R+R)-f_0(R-epsilon Pro_T)//(K_R+R-epsilon Pro_T))/(f_0R//(K_R+R))=(eta Pro_T)/(1-Pro_T//M)`
Where `eta=(K_R epsilon)/(R(K+R))`, `M=(K_R+R)/epsilon`. M represent the effective maximal capacity for producing non-essential proteins.It’s no hard to see that production of he terogenous proteins at levels that approach M would inhibit production of essential systems, so that cell growth would be significantly slowed down.
(2)Benefits
We define benefits as the relative increment of growth in the effect of a certain protein or a certain group of protein. Experiments show that the form of the benefit function is well described by catabolism kinetics of this system[2].The increase in growth rate is proportional to the rate of energy source use, and hence to the enzymatic rate of the E1,E2 and E3,when it’s in steady state(`f(0)` the wild type,we made it as standard 1 while the `f_(3-pba)(Pro)` represent the extra resource,3-pba,brings some benefits to the cell):
`B(Pro)=(f_(3-pba)(pro)-f(0)/(f(0))=(f(pro)-1)/1=epsilon_(nu_(3-pba))`
Where `nu_(3-pba)` is the metabolic rate of 3-pba intracellular when steady, `B(Pro)` is defined as benefits.
(3)Experiment
We allow wildtype E.coli to propagate in the engineered strain for dozens of genegrations and consider the growth rate as 1. Then we put our engineered strain alone into Lysogeny broth and note down the growth rate m. And here we get the cost c by 1-m.
To get the parameters of the cost function ,we Take reciprocal of the function.
Afterwards we should test the degree to which 3pba would inhibit the growth of our engineered strain .So we put wildtype E.coli to propagate in Lysogeny broth together with 3pba. After generations to come , we note down the growth rate n. And we get to know 3pba suppress the growth of our engineered strain as 1-n.
| Bacterial Strain | Environment | Growth Rate | Purpose |
|---|---|---|---|
| Wild-type strain | LB | 1 | Define it as standard growth rate |
| Engineered strain | LB | m | 1-m is relative growth rate ,in the influence of protein cost. |
| Wild-type strain | LB + 3pba | n | 1-n is relative growth rate,in the influence of 3-pbs toxicity to the strain. |
| Engineered strain | LB + 3pba | p | Net yield |
And we now describe the net yield as the function below:
`Y_(3-pba)(Pro)=B(Pro)-C(Pro)-mu*pba"_outside"`
`mu` is defined as the toxicity coefficient of 3-pba.
`Y_(3-pba)(Pro)=delta nu_(3-pba)-(eta Pro_T)/(1-Pro_T//M)-mu*pba"_outside"`
If we assume `nu_(3-pba) oo Pro_T`, we can define a benefits coefficient `alpha`, and `nu_(3-pba)=(alpha*pba"_inside"*Pro_T)/(K_B+pba"_inside")`.
The simulation result is:
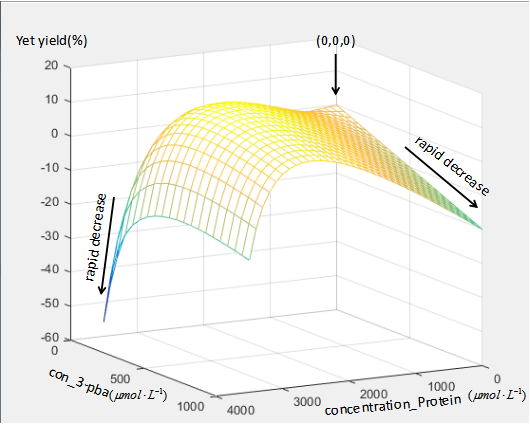
We can see the point (0,0,0) represent the wild type without 3-pba,and the relative growth rate is zero. When there are too much protein and little 3-pba or little protein and too much protein,the relative growth rate show rapid decrease. And only if the concentration of both protein and 3-pba are in appropriate level,the relative growth rate can higher than wild type and show yellow in the figure.
This is just a rough simulation,for can be changed by different concentration structure of the proteins,E1,E2,E3 and MhbR. But this also can be a reference that show us the amount of the protein is expected limited within a level. And if we want to raise the rate,how to achieve a increase with less protein must be payed attention to.
We need to find the key enzyme in the system,so we use the metabolic control analysis.Details:MCA.
Reference
- Alon, U., An Introduction to Systems Biology_Design Principles of Biological Circuits.173-174.
- Alon, E.D.U., Optimality and evolutionary tuning of the expression level of a protein. 28 July 2005.