Esp
Summary
EB (Esp as extracted from the S. epidermidids genome) is one of our combat proteins targeting biofilm formation and prevents eDNA exudation. By expressing and attaching it to our spider silk, in combination with the other combat proteins, we hope to combat both biofilm and virulence in chronic wounds.
Assembling a construct for recombinant expression of EB [✔️]
Demonstrating expression of EB in E. coli [❓]
Adding Sortase and His tags to the expression construct [❌]
Investigating possible bactericidal activity [❓]
Assemble truncated EB [❌]
Demonstrating efficient Biofilm inhibition by EB [❓]
Demonstrating efficient Biofilm dispersal by EB [✔️]
Results
Assembling a construct for recombinant expression of EB
By using 3A Assembly, the construct to produce recombinant Esp was assembled. The components used for this experiment were the T7-promoter (BBa_K525998), the coding sequence for EB (BBa_K531003) and a backbone, in this case pSB1K3. To obtain the final ligation product a classic 3A assembly was performed.
Digestion [✔️]
In this experiment double digestion was performed on the BioBricks T7 and Esp to prepare these samples for ligation. Also single digestions were performed to investigate the restriction enzymes functionality.
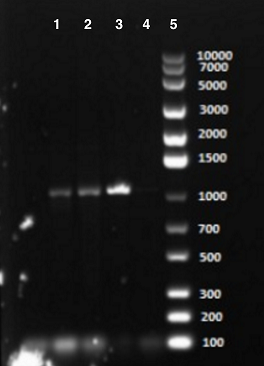
Both single and double digestions were considered successful except for the empty wells with T7 PCR products and an unspecific band, in well 9, for the T7 plasmid. However, it is hard to evaluate the results for the double digestion of the T7 plasmid since the expected size of 55 bp is too small to be visualised on a common gel. Since the longer fragments that this digestion generates were clearly visible, double digestion of the T7 plasmid was assumed to be successful. The next step was planned to ligate the digested fragments together into an appropriate backbone.
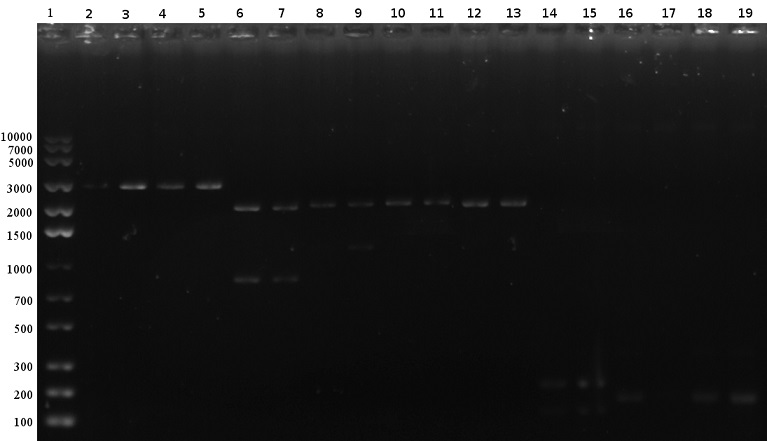
| Well | Sample |
|---|---|
| 1 |
DNA Ladder |
| 2 & 3 |
EB Plasmid sd EcorI |
| 4 & 5 |
EB Plasmid sd SpeI |
| 6 & 7 |
EB Plasmid dd |
| 8 & 9 |
T7 Plasmid sd EcorI |
| 10 & 11 |
T7 Plasmid sd SpeI |
| 12 & 13 |
T7 Plasmid dd |
| 14 & 15 |
T7 PCR Product sd EcorI |
| 16 & 17 |
T7 PCR Product sd SpeI |
| 18 & 19 |
T7 PCR product dd |
Ligation [✔️]
At this point we worked with two versions of Esp referred as EB and EC (Esp optimised for C. crescentus, BBa_K531006)
After the ligation had been performed, a gel electrophoresis was run to analyse the results. However, the results were not satisfying since too little product was present as could be seen in figure 2. Therefore, we were not sure if the ligation had been successful. However, the transformation was performed despite having too little DNA to see it on the gel.
Colony PCR of Ligation Products [✔️]
The planned transformation mentioned in Result 2 was successful, 1 colony was observed for the assembled plasmid containing T7 and EC (pSB1K3-T7-EC) and two colonies were observed for the plasmid with T7 and EB (pSB1K3-T7-EB) after 18 h incubation.
The 3A assembly of pSB1K3-T7-EB was considered a success since the colony PCR appeared successful and the sequencing results confirmed a correct assembly. pSB1K3-T7-EC however, was not correctly assembled, as indicated by the sequencing results and the work with it was not continued.
Generally, a very low number of colonies was observed when transforming ligation products whereas the positive control worked fine. This likely indicates that the ligation product itself is not of a very high quality or quantity. For any following experiments, both digestion and ligation should be analysed carefully to make sure that high-quality ligation product can be transformed. Additionally, to optimize the ligation a couple of different insert:vector ratios could have been tested.
Demonstrating expression of EB in E. coli
In order to express recombinant Esp, BL21(DE3) cells containing the construct pSB1K3-T7-EB were induced with IPTG, triggering the protein production. The cells were lysed by sonication, the samples were spun down and the pellet was resuspended in PBS. Thereafter SDS-PAGE was run to confirm the expression of the protein of interest. Supernatant and the resuspended pellet were run separately on the SDS-PAGE since the solubility of Esp is unknown to us and an insoluble protein might require re-folding in order to be functional. In following results the samples from the supernatant is referred as “soluble fraction” and the samples from the pellet as “insoluble fraction”.
SDS-PAGE, First Attempt [❓]
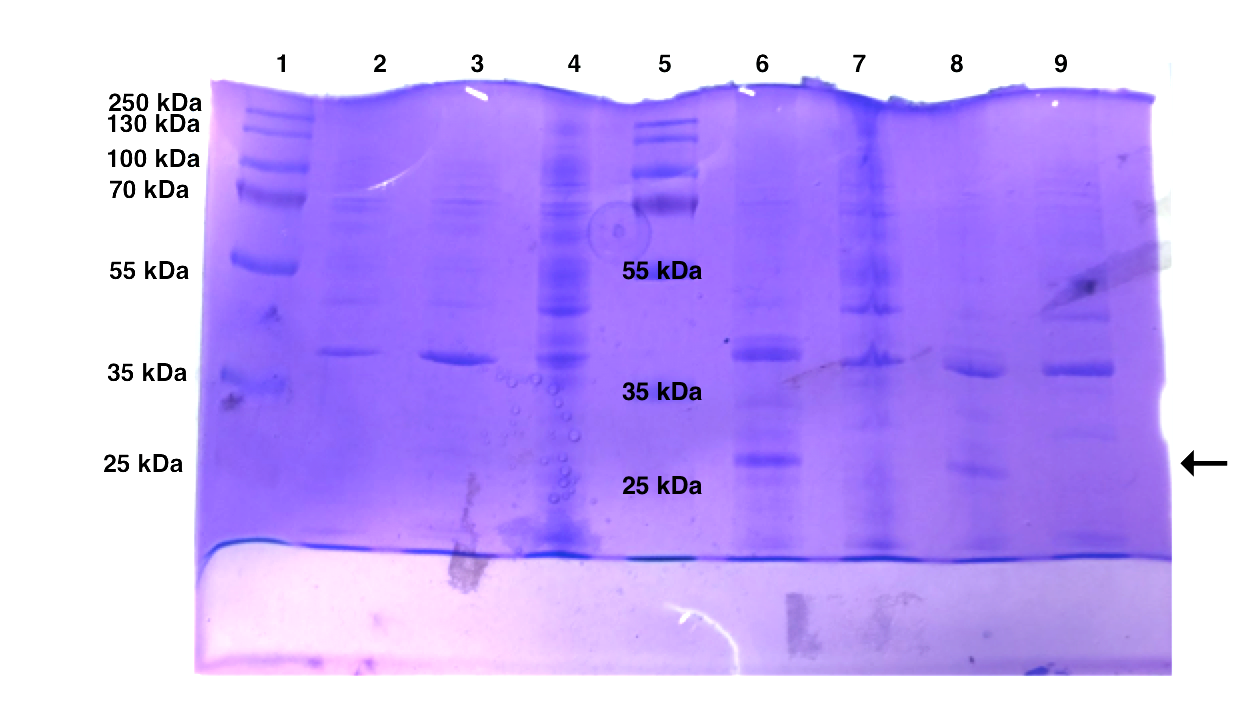
| Well | Sample |
|---|---|
| 1 |
Protein Ladder |
| 2 |
Soluble fraction EB1, 1 mM IPTG induction |
| 3 |
Soluble fraction EB2, 1 mM IPTG induction |
| 4 |
Soluble fraction EB2, uninduced |
| 5 |
Protein Ladder |
| 6 |
Insoluble Fraction EB1, 1 mM IPTG induction |
| 7 |
Insoluble Fraction EB1, uninduced |
| 8 |
Insoluble Fraction EB2, 1 mM IPTG induction |
| 9 |
Insoluble Fraction EB2, uninduced |
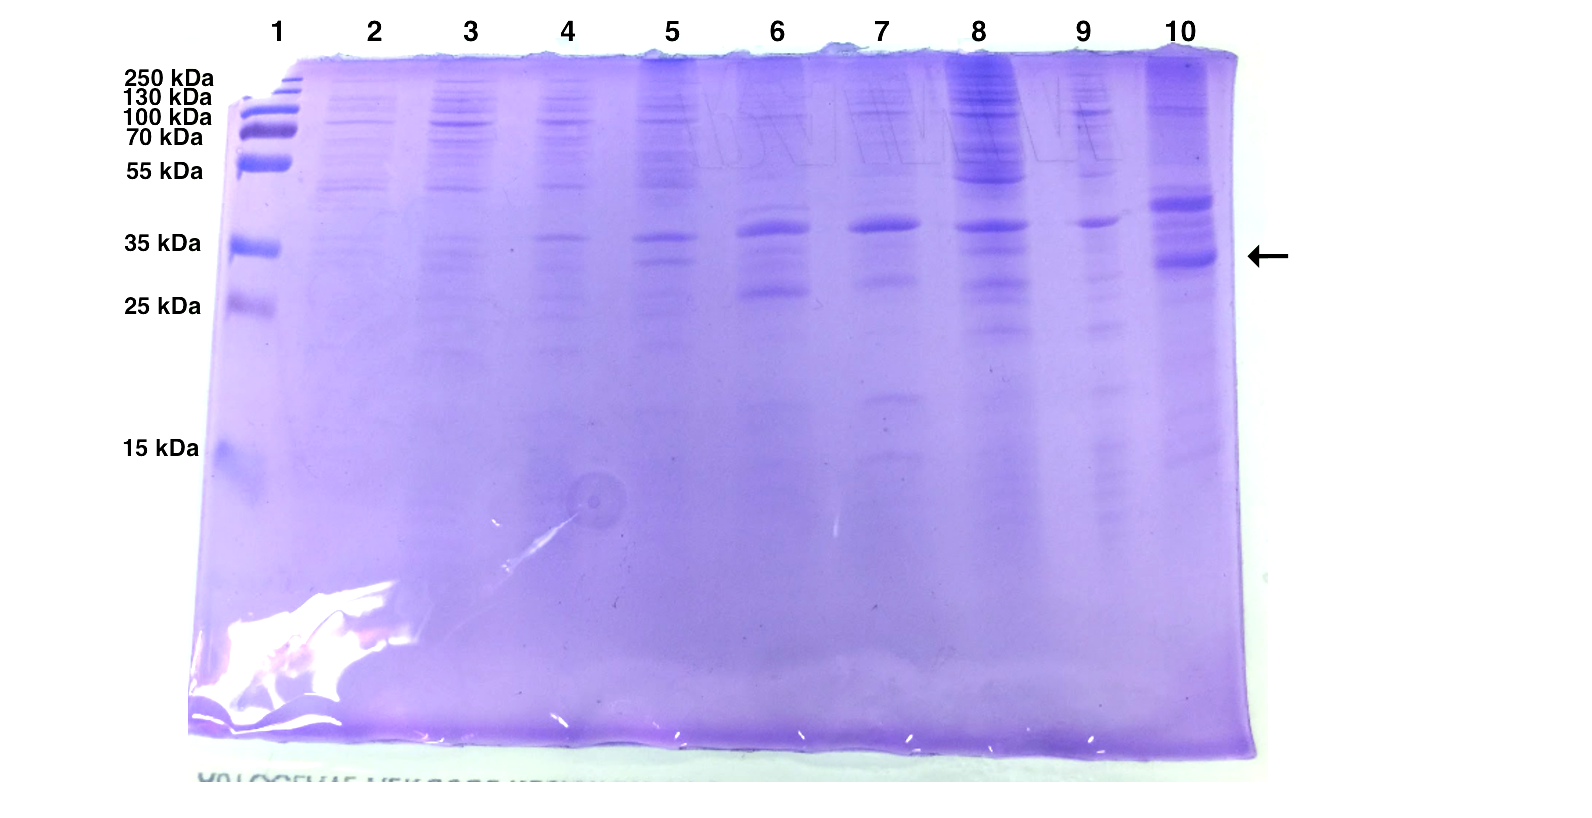
An intense band at around 40 kDa exists in all the protein samples. Insoluble protein at around 29 kDa showed a significant increase after IPTG induction.
The expression of pSB1K3-T7-EB seems to be successful. EB is calculated to be 30 kDa and we observed an intense band around 30 kDa after IPTG induction. However, Western blot might be needed to further confirm the result as Coomassie Blue stains total protein and recombinant proteins can be hard to identify among the multitudes of endogenous proteins. Besides, the protein ladder used in this SDS page does not have a band at 30 kDa and the observed band might not be exactly at 30 kDa.
SDS-PAGE, Second Attempt [❓]
In this experiment two batches of SDS-PAGE were done. In the second SDS-page, we added the untransformed BL21 cells to see whether there is a difference between the transformed and non-transformed cells since it was hard to interpret the results in last SDS-page without such a control. This is especially important since the T7 expression system can be leaky and recombinant protein may be expressed even in uninduced cells, further complicating the interpretation.
| Well | Sample |
|---|---|
| 1 |
Protein Ladder |
| 2 |
Soluble fraction, untransformed cells |
| 3 |
Soluble fraction, uninduced |
| 4 |
Soluble fraction, induced at 37 °C, 4h |
| 5 |
Soluble fractino, induced at 25 °C overnight |
| 6 |
Insoluble Fraction, untransformed cells |
| 7 |
Insoluble Fraction, uninduced |
| 8 |
Insoluble Fraction, induced at 37 °C, 4h |
| 9 |
Insoluble Fraction EB2, induced at 25 °C overnight |
| Well | Sample |
|---|---|
| 1 |
Protein Ladder |
| 2 |
Soluble fraction, untransformed cells |
| 3 |
Soluble fraction, uninduced |
| 4 |
Soluble fraction, induced at 37 °C, 4h |
| 5 |
Soluble fractino, induced at 25 °C overnight |
| 6 | Protein Ladder |
| 7 |
Insoluble Fraction, untransformed cells |
| 8 |
Insoluble Fraction, uninduced |
| 9 |
Insoluble Fraction, induced at 37 °C, 4h |
| 10 |
Insoluble Fraction EB2, induced at 25 °C overnight |
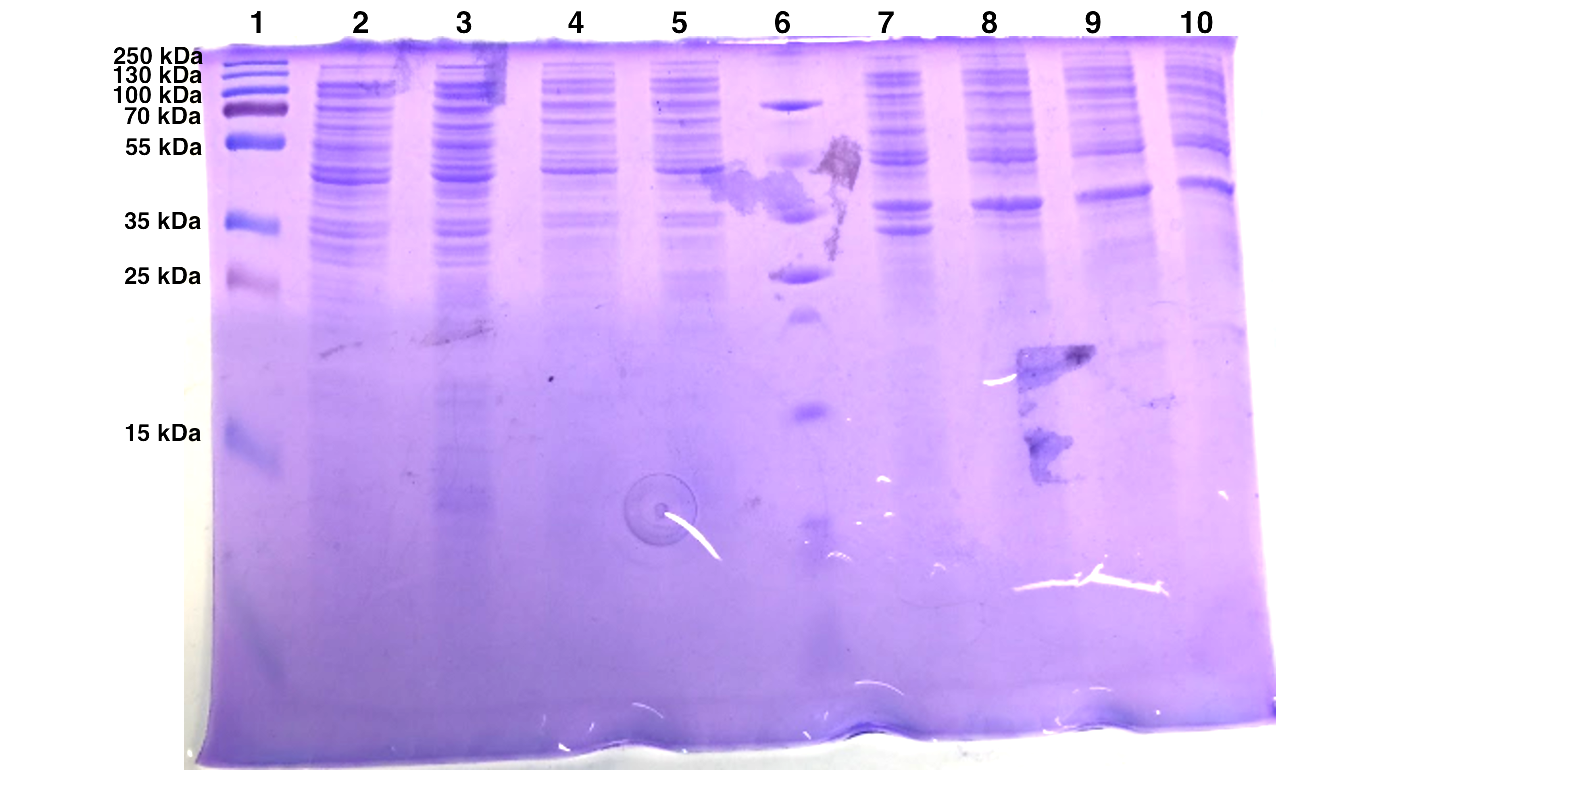
The expression of pSB1K3-T7-EB seems to be successful for the first batch but not for the second one. EB is calculated to be 30 kDa and we observed an intense band around 30 kDa after IPTG induction.
As mentioned above, we added the untransformed BL21 cells to see whether there is a difference in expression between the transformed and non-transformed cells. The result turns out the bands at 40 kDa and 35 kDa are universally expressed in all samples.
Since the last experiment shows an universal protein expression at 35-40 kDa no conclusion can be drawn whether we have successfully expressed Esp. Furthermore, we have seen protein expression in this range both in the soluble and the insoluble samples, therefore we have not succeed in determining the solubility of Esp. If we had more time we could have used mass spectrometry for more accurate results. Furthermore, if we had succeed to insert the His-tag in the gene encoding for Esp before this experiment was performed we could have purified our samples before running the SDS-PAGE’s or performed a Western Blot with anti-His-tag antibodies. That could have given us easier results to interpret with no surrounding noise due to the impurities.
Furthermore, during our project we have prepared our own buffers and gels. If we would have had the possibility to use standardized material for the SDS-PAGE maybe we could in a greater extent avoid bad separation and smeary gels.
Adding Sortase and His tags to the expression construct
In order to purify and attach Esp to spider silk, the addition of linkers and tags (LT) was necessary, which was going to be achieved by a modified 3A assembly using a BamHI restriction site. This site first has to be introduced to EB using PCR.
PCR adding BamHI overhang, First Attempt [❌]
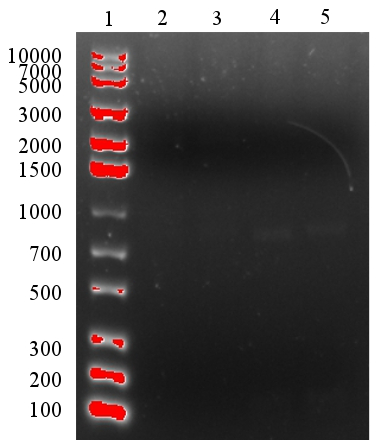
In the first trial adding BamHI overhang to EB using PCR, the setup reaction was similar as regular PCR with a reverse primer designed to add a BamHI site. It had the same annealing temperature as the pre-existing forward primer (VF2). Positive control was performed with VF2 and VR, which proved to be functioning in our previous experiments. We tested two annealing temperature with 52 °C and 57 °C.
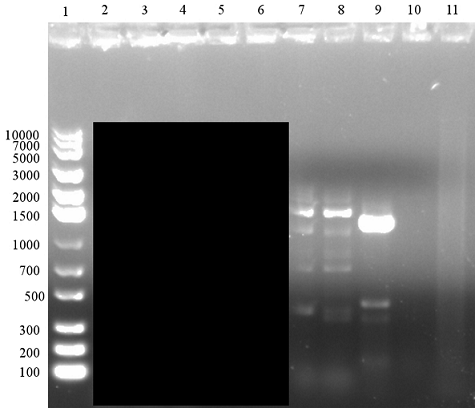
As shown in figure, in both of the gels, there were intensive bands for positive control. However, the overhang PCR seemed to have been unsuccessful with PCR products that were either unspecific (at 52 °C annealing temperature) or simply not present (57 °C). The failure could due to low compatibility of the new primer or the conditions for overhang PCR not being optimal. For the next trial, various component in the setup were optimised.
PCR adding BamHI Overhang, Second to Fourth Attempt [❌]
In the following three attempts, we switched to Taq polymerase, increased amount of DNA templates and primers to optimise the PCR. However, the modifications to the protocol were unsuccessful. The bands were either faint or unspecific. We examined all the reagents and found out that we had mixed up the reverse primer.
PCR adding BamHI overhang, Fifth Attempt [✔️]
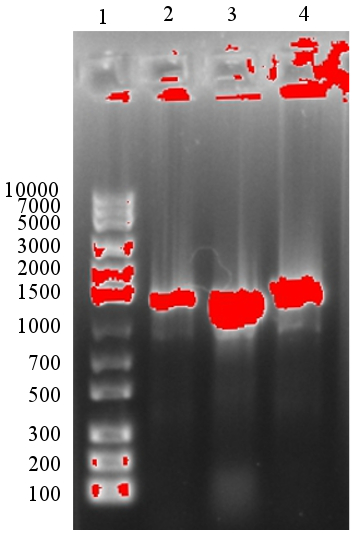
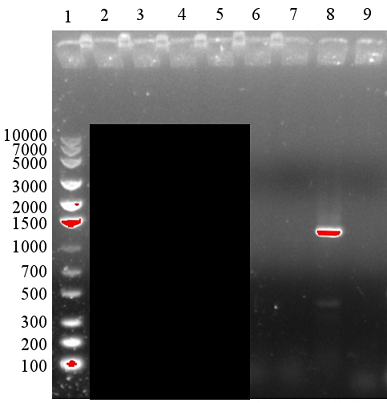
In the new trial with correct primers, clear bands were observed at correct size in the gel. As shown in the picture, the well 2, 3 and 4 were EB with 1, 10 and 20 ng of DNA template. The bands occurred at a size slightly bigger than 1000 bp, which was corresponding to EB with 1021 bp. After performing this successful overhang PCR, we were able to continue with digestion and ligation of the product.
Digestion and Ligation, First Attempt [❌]
We performed the gel purification with the QIAquick gel extraction kit. After gel purification, the samples had concentrations of 12 and 15 ng/ml, which was adequate for the following digestion and ligation.
BamHI restriction enzyme was used to digest the purified PCR product under the standard protocol with 60 min 37 °C incubation and 20 min of heat kill. T4 ligase was used to ligate digested EB, LT and the pSB1C3 backbone.
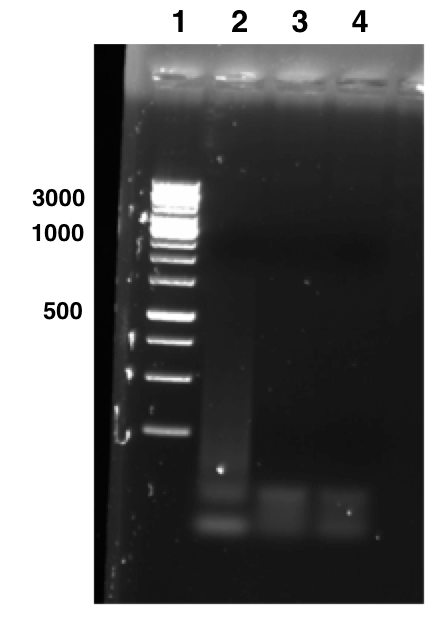
Subsequently a gel for both the digestion and ligation product was run. Unfortunately, no bands for the ligation and digestion product appeared in the gel, indicating unsuccessful reactions. Perhaps the gel purification might have diluted the digestion product or the conditions for digestion and ligation might not be optimal.
Digestion and Ligation, Second Attempt [❌]
We had another three attempts for digestion and ligation. Various component and time for incubation and heat kill were optimized. None of them succeeded. If the digestions were successful or not was hard to judge as the digested DNA sequence had similar size as the undigested one. We observed faint bands at over 3000 bp which might correspond to the assembled plasmid. Then we moved on with transformation the new construct into both TOP10 cells and BL21(DE3) cells. Unfortunately, the only colony observed was shown to not contain EB. It is unclear whether the fault lies with low efficacy digestion and ligation or with the transformation process.
Overhang PCR with New Strategy [❌]
After several failure in digestion and ligation, we decided to use a new strategy: amplifying the whole pSB1C3-T7-EB construct with the addition of a BamHI restriction sequence after the EB coding sequence. The PCR was performed with Phusion High Fidelity Polymerase. Due to time limitation, we only tried three annealing temperatures. Unfortunately, none of the PCR products showed bands in the gel.
In conclusion, we managed to add BamHI overhang to EB after several failures. However, the digestion and ligation were unsuccessful. The digested product was hard to tell from the gel because the undigested sample had similar size as its. In all four attempts for ligation and transformation, only one colony developed in the third attempt, while it didn’t have the correct sequence.
A new strategy was tried to add BamHI to the whole pSB1C3-T7-EB construct. However, due to limited time, we didn’t find the optimal conditions and didn’t get any amplified product. For troubleshooting, positive control should be used for the digestion reaction to exclude a systematic error.
Investigating possible bacteriolytic activity
Esp serves a variety of functions but many of its possible activities are undocumented, which was the reason we wanted to investigate whether it would in fact also be bacteriolytic.
We chose to perform a modified Kirby-Bauer test with TOB1 E.coli for which filter papers soaked with samples were placed on an agar plate to assess whether they inhibit bacterial growth.
Kirby-Bauer, First Attempt [❓]
In a first attempt at performing a Kirby-Bauer, salt-free agar plates were used as an optimal growth medium for E.coli TOB1. Autoclaved cellulose nitrate filter papers were soaked in cell lysates, where the soluble and insoluble fractions were separated in order to also assess solubility of our protein. The plates were incubated overnight and halo formation was assessed.
Unfortunately, this proved to be rather difficult since the agar and the colonies were very similar in colour. Nevertheless, the positive control (Kanamycin at 35 μg/ml) did display an inhibition of bacterial growth, indicating that our set-up seemed to work. We could, however, not see such a halo for our EB samples samples which might simply be because EB not being bacteriolytic / bacteriostatic or might also be caused freezing our protein in lysis buffer and repeatedly thawing it.
For a repeated experiment, we planned to use freshly produced protein and selective agar which might help making halos visible.
Kirby-Bauer, Second Attempt [❓]
In this experiment, two different EB solutions were used to assess whether freezing of the samples had a deleterious effect on EB activity. After incubation, especially on Endo Agar the bacterial colonies were quite easily visible and those plates were used to assess halo formation.
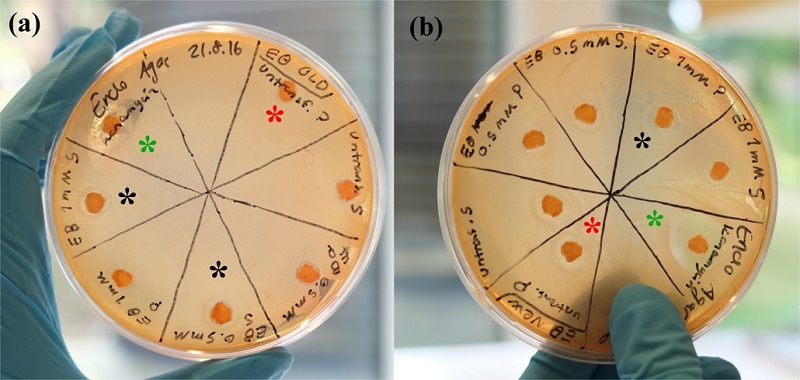
The samples with considerable halo formation in this case were:
- EB ‘old’, 1mM IPTG induction, soluble fraction
- EB ‘old’, 0.5mM IPTG induction, soluble fraction
- EB ‘new’, 1mM IPTG induction, insoluble fraction
Unfortunately, those results don’t appear very consistent and even negative controls (cell lysate from untransformed BL21(DE3) cells) showed halo formation in some cases, especially on the plate with the ‘new’ EB. This could indicate that the mere fact that the disks were soaked in a liquid could inhibit bacterial growth. In a subsequent experiment where triplicates were performed and less liquid was used, unfortunately no colonies formed, likely because the inoculum used to streak the plates had been too diluted.
After those three experiments, no clear conclusion can be drawn about whether EB has a bacteriolytic activity on E.coli. Since its main effects were documented to concern the biofilm and virulence factors, EB might in fact not be bacteriolytic or at least not exhibit that effect on gram negative bacteria.
For replication of the experiments, EB should be cleaved beforehand in order to remove the pro-peptide, which is reported to greatly improve its efficacy (Sugimoto 2011) This cleavage was not performed in our experiments and would likely be needed to test EB efficiently. Alternatively, Esp could perhaps be assembled in a mature form, as we attempted by truncating the sequence (see below).
Assemble truncated EB
Esp is initially transcribed as a pre-pro-peptide and subsequently cleaved into an active, mature form. (Sugimoto 2011) The uncleaved pre-pro-peptide has shown little to no activity in biofilm-degradation and is usually treated with thermolysin before functional assays (Sugimoto 2011, Ohara-Nemoto 2002) In order to avoid the additional step of thermolysin-mediated cleavage, which can also represent an additional confounding factor, we decided to create a truncated version of Esp (trEB) which would be missing the first 66 amino acids.
The set up for this experiment was considered to be fairly simple: we constructed a primer that was going to anneal at the valine in the 67th position and add the BioBrick prefix to its N-terminal. That primer was then used in combination with the EB_reverse primer to allow for subsequent ligation of the LT sequence to the C-terminus to assemble a protein that could be purified and conjugated to the spider silk.
Overhang PCR, Digestion and Ligation, First Attempt [❓]
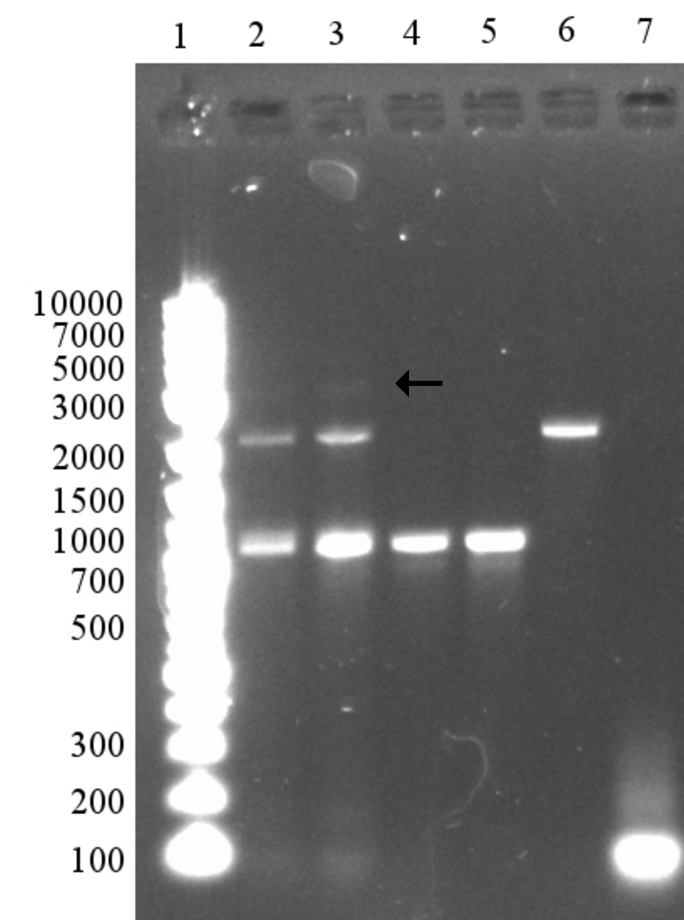
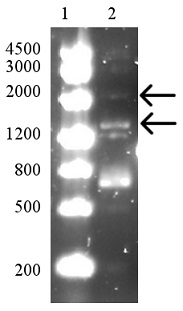
PCR was performed with standard set-up and with the two primers EB_trunc and EB_reverse. This should result in a truncated EB that also has the BamHI site required for adding LT. The PCR appeared successful in the first attempt, with a strong band that approximately corresponds to the expected 673 bp. (See Figure 12a)
Subsequently, the PCR product was digested and ligated to perform a 3A assembly with the LT sequence and the pSB1C3 backbone. The success of the digestion can not be assessed on the gel since only a few bases are removed. The ligation was performed with a 3:1 inserts:vector ratio and appeared partly successful with bands that could correspond to a circular plasmid visible (see arrows). After transformation, unfortunately no colonies could be observed for TOP10 or BL21(DE3) cells.

Since the ligation appeared to be somewhat successful and all ligation product had been used for the transformation, we decided to simply re-do the ligation with the already digested fragments.
Digestion and Ligation, Second Attempt [❓]
In this second attempt, the inserts:vector ratio was set to 10:1 in the hopes of achieving a more efficient ligation. Additionally, the ligation product was not heat-killed, which could inhibit transformation efficacy.
As can be seen on the gel, the ligation appeared partly successful but after transformation, no colonies were visible. Even after retransformation of the remaining ligation product, no colonies were visible and the project was abandoned due to time constraints.
Overall, the attempt to assemble a truncated version of EB was unsuccessful since it suffered from the same pitfalls as many other parts of the project. If there had been more time to focus on this part of our project, another strategy for the assembly could have been attempted, such as a Gibson assembly. Alternatively, the PCR could have been performed with primers amplifying the BioBrick suffix, which would have allowed to simply digest the PCR product and ligate it into a backbone without another fragment, which might have improved ligation efficacy.
Demonstrating efficient Biofilm inhibition by EB
To demonstrate inhibition by EB, a crystal violet assay was performed with P. aeruginosa and S. aureus biofilms. Since we did not know whether EB is present in the pellet or the supernatant both fractions were saved and tested in this experiment.
With those assays it has to be kept in mind that crystal violet also stains bacterial cells so that part of the effect may be due to a bacteriolytic function. Given that EB however did not show a clear halo in Kirby-Bauer test, we believe that the decrease of absorbance int he biofilm assays is in fact due to biofilm inhibition or degradation.
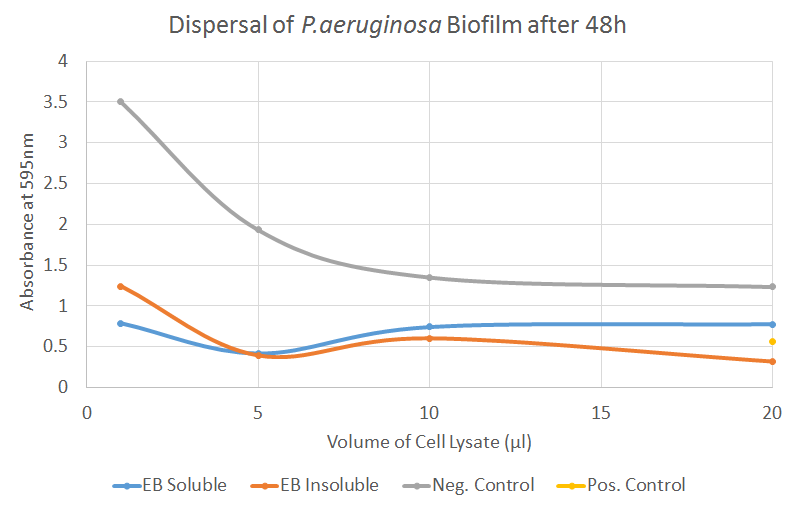
Biofilm Assay, First Attempt [❓]
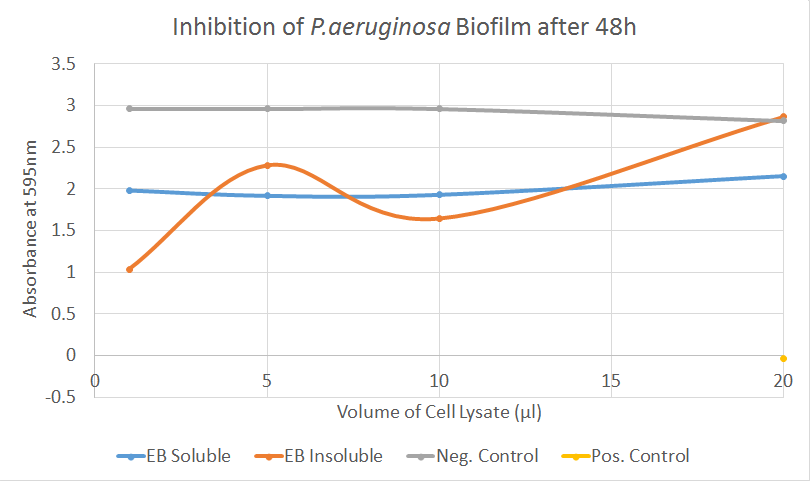
In this first attempt of demonstrating biofilm inhibition, the bacteria were incubated for 48 hours with different volumes of cell lysate before their absorbance was measured. Protein obtained on several different days was tested but for simplicity, only part of the data is displayed.
In this assay, EB did not show strong activity. For S. aureus, the results were erratic, including the negative controls (cell lysates of untransformed BL21(DE3) cells) and are not displayed here. The tests performed on P. aeruginosa, however, indicate a possible biofilm-inhibitingactivity by the soluble fraction of our cell lysates, with an absorbance consistently below the negative controls.
Based on those results, we were not able to draw any kind of conclusion given that the samples seemed inconsistent and the assay had only been performed using triplicates. Biofilm assays often need to be performed with considerably more replicates since they are hard to standardise and washing steps add the danger of unintentionally detaching the biofilm.
A next assay was planned in which more replicates would be performed and the outer wells of the plate were going to be left empty since they tend to dry out after longer incubation periods. Additionally, the time course was adapted: 48 hours are usually recommended for biofilm growth but we were uncertain as to whether that might be too long; the biofilm growth could possibly overwhelm the activity of Esp or Esp could simply have lost activity after such a long incubation time.
Biofilm Assay, Second Attempt [✔️]
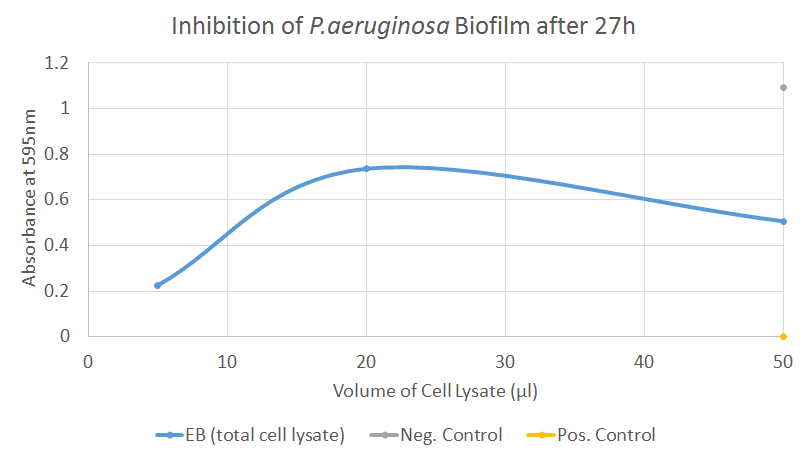
When repeating this assay, the samples were now not split anymore in supernatant and pellet, reducing the amount of work. Furthermore, 12 replicates of each sample were performed and the plates were quantified after only 27 hours of incubation.
Again, the S. aureus results were unfortunately not usable since both positive and negative controls showed highly unusual behaviour. The tests on P. aeruginosa, however, displayed some measure of inhibition though the effect does not seem to correlate with the amount of cell lysate that was added. However, considering that incubation with 50 μl of cell lysate reduced the absorbance by almost 50 % compared to the negative control, some measure of biofilm-inhibiting activity seems to be present.
After those two assays, no clear conclusion can be drawn but there are indications that EB might work as predicted. The results obtained using P. aeruginosa imply that EB might in fact inhibit the formation of biofilms though the variance of the samples can be considerable, as explained above. Due to time constraints, we were unfortunately not able to repeat the assays, even though it would have been very beneficial to test either a truncated or cleaved form of EB which has been shown to have a much stronger biofilm-dispersing activity. For any future project involving EB and its activity on biofilm, more replicates and various time points should also be considered.
Demonstrating efficient Biofilm dispersal by EB
The approach was very similar to the one outlined above for the biofilm inhibition. The main differences lies in the timing: P. aeruginosa and S. aureus were incubated for 48 hours allowing them to form a biofilm before the combat proteins were added. All statistical analysis was conducted using Student's T-test.
Biofilm Dispersal, First Attempt [❌]
In this test, we encountered a well-known issue with the negative control - even the cell lysates of untransformed cells (or the lysis buffer itself) seem to be disrupting the biofilm to a certain degree, an effect that correlated strongly with the volume of lysate added. The reduction in absorbance after adding EB cell lysates corresponds to the reduction observed by adding the lysates of untransformed cells, indicating little contribution by EB. For P. aeruginosa, however, the biofilm dispersal seemed to occur even for smaller volumes of EB, hinting that EB might be more effective on Pseudomonas rather than Staphylococci. This conclusion, however, can of course not be drawn after a single experiment.
When repeating the experiment, we were aiming to introduce the same changes mentioned in the “Biofilm Inhibition” section; avoid using the outer wells which tend to try out, test whole cell lysates instead of soluble and insoluble fractions and also reduce the incubation time.
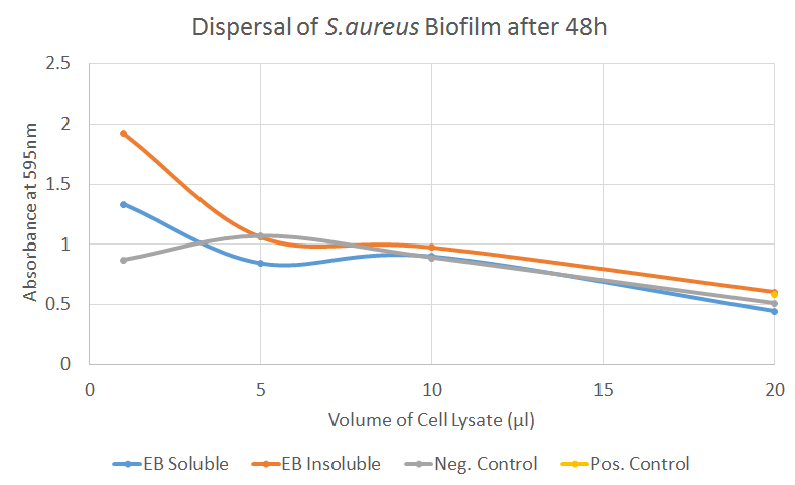
Biofilm Dispersal, Second Attempt [✔️]
After adapting our protocol to reflect the changes mentioned above, we were able to gather clearer data for the dispersal of both S. aureus and P. aeruginosa biofilms. Both experiments showed very similar results with a clear decrease in absorbance after treatment with the EB samples, correlating well with the volume of sample added. Additionally, the differences were highly significant for both S. aureus and P. aeruginosa when 50 μl of sample were added.
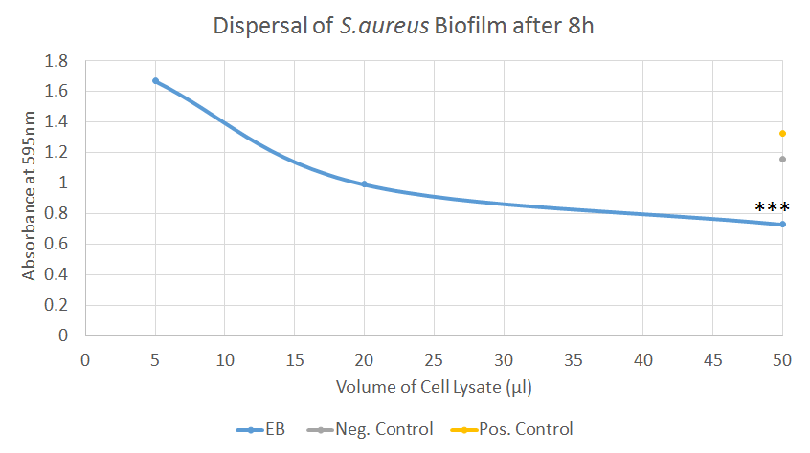
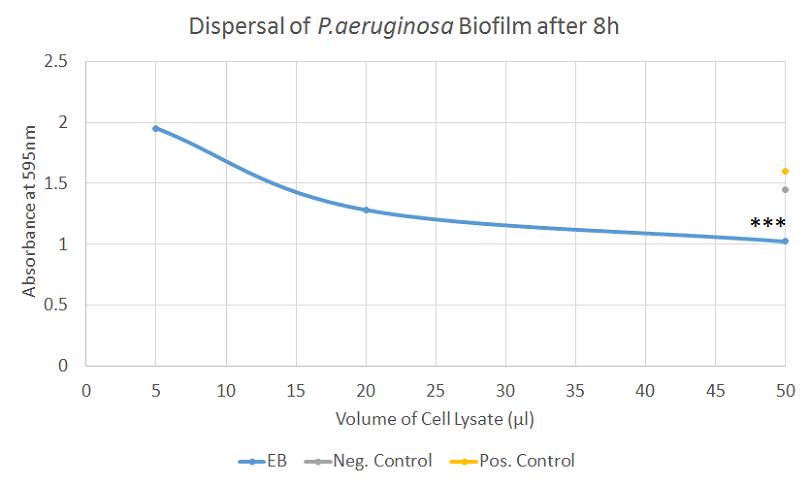
In conclusion, after some optimization, valuable data has been obtained regarding the ability of EB to disperse biofilm. Whereas the data was not always consistent, the final experiments indicates that EB possesses a strong ability to disperse biofilm, especially considering that crude cell lysates were used to perform the tests.
For the future, the testing of both activated and purified EB would be an obvious goal, as well as further improving the set-up of the assay in order to obtain more reliable data.