Nuclease
Summary
Nuclease (Nuc) is one of our combat proteins which targets the extracellular DNA (eDNA) of biofilms. In our potential wound dressing, we hope that Nuc would be able to disperse biofilm which relies on the negative charge of eDNA to maintain its structural integrity.
Assembling a construct for recombinant expression of Nuc [✔️]
Demonstrating expression and investigating solubility of Nuc in E. coli [✔️]
Demonstrating efficient biofilm inhibition by Nuc [❌]
Demonstrating efficient biofilm dispersal by Nuc [✔️]
Demonstrating bacteriolytic activity of Nuc [❌]
Adding Sortase and His tags to the expression construct [❓]
Results
Assembling a construct for recombinant expression of Nuc
The 3A assembly method is used to assemble a pSB1C3-T7-Nuc construct, where the nuclease BioBrick created by the UCL London iGEM team 2012 BBa_K729004 and the T7-promoter created by the Bielefeld Germany iGEM team 2011 BBa_K525998 are cut out from their original constructs and the backbone cut open, using appropriate restriction enzymes.
The ligation products are then first transformed into TOP10 for maximum transformation efficiency. The plasmid are extracted and transformed into BL21(DE3) for expression.
Digestion and Ligation, First to Third Attempt [❌]
Successful digestion of Nuc and backbone (pSB1K3) in the second attempt. Ligation with T7 from first assembly attempt on the other hand failed. The PCR analysis of the ligation showed contamination of bands corresponding to Esp, indicating a simple mistake in probably marking the tubes.
The third attempt showed successful digestion of backbone (pSB1K3). However, unsuccessful digestion of Nuc. Thus, ligation could not be performed. Since no obvious errors could be identified in either the first or the second attempt, the procedure was simply repeated without any changes.
Digestion and Ligation, Fourth Attempt [✔️]
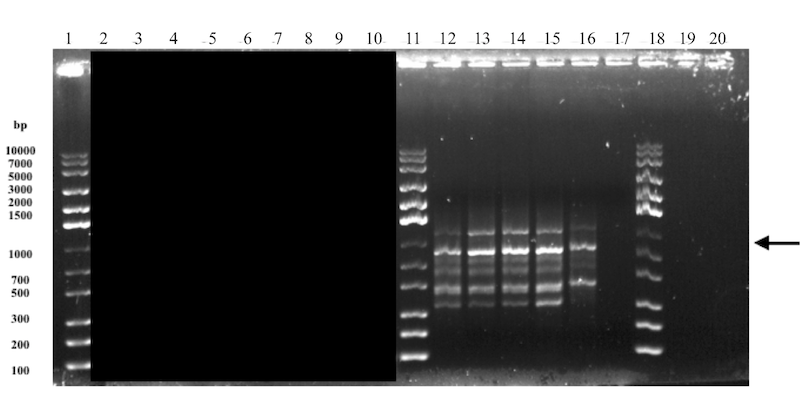
pSB1C3-Nuc was successfully digested and the digested product was then also successfully ligated with previously digested backbone (pSB1K3) and T7. However, the analysis of the results were not convincing. A clear band (see arrow in Figure 1) at the expected size of approximately 800 bp but also a lot of other unspecific bands. The subsequent transformation in TOP10 was unsuccessful since there were no growth of colonies.
The decision was made to re-do the ligation, based on the ligation gel results which showed a lot of unspecific bands. Since the transformations in the previous attempts had a very low success rate compared to the expected results, the ligation product would be transformed directly into BL21(DE3) as well as in TOP10 to investigate whether the type of cell was a contributing factor. This is however not believed to be the primary reason for the unsuccessful transformations since the TOP10 strain takes up plasmids more easily than BL21(DE3) which is an expression strain.
Digestion and Ligation, Fifth to Seventh Attempt [❓]
Nuc and backbone (pSB1K3-T7-Esp as source) was successfully digested but no analysis was performed for the ligation product. Conclusions had to be drawn from further transformation in TOP10 and BL21(DE3) with subsequent inoculation in liquid media. Analysis of extracted plasmid from TOP10 cells showed indications of presence of Esp instead of nuclease, as in the second attempt. PCR analysis of plasmids from BL21(DE3) cells were negative. The contamination of Esp had now occurred for the second time and probably derived from the usage of pSB1K3-T7-Esp as backbone source, due to depletion of pure pSB1K3. The pSB1K3-T7-Esp plasmid was digested with the same restriction enzymes as the linear pSB1K3 backbone from iGEM HQ. The backbone fragment from this was then obtained through gel purification for the use in subsequent ligation. This gel purification may have been imprecise and the cause of the Esp contamination. Therefore, ligation was re-done with another backbone source from iGEM HQ containing only backbone, pSB1A3.
The subsequent attempt was unsuccessful and for the 7th attempt, no analysis on the ligation product was made. The transformation of the ligation product was unsuccessful since there were no colonies on the plate. Since the transformation protocol were thought to be reliable, the conclusion was drawn that the ligation had failed. The backbone used was again changed to pSB1C3 instead, due to depletion of the pSB1A3 sample from iGEM HQ. Also, the ligation conditions were changed - instead of 10 minutes at room temperature, the samples were incubated at 16 °C overnight, a common protocol for ligations which we hoped would be more successful.
Digestion an Ligation, Eight to Tenth Attempt [✔️]
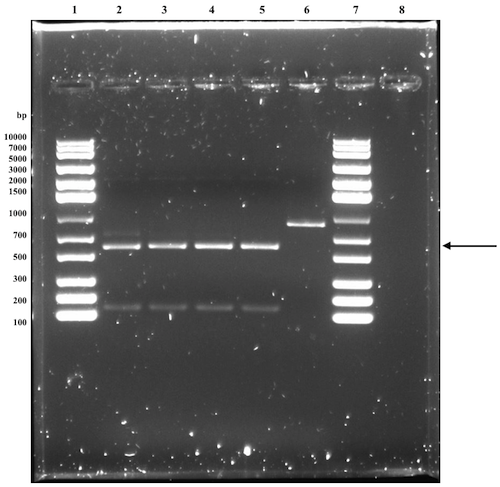
Successful digestion of Nuc in both the 8th and the 9th attempt (see Figure 2, 9th attempt). There results from the analysis of the ligation product indicated a successful ligation and after transformations, colonies were formed. However for both attempts, the subsequent plasmid analysis of the transformed cells showed negative results.
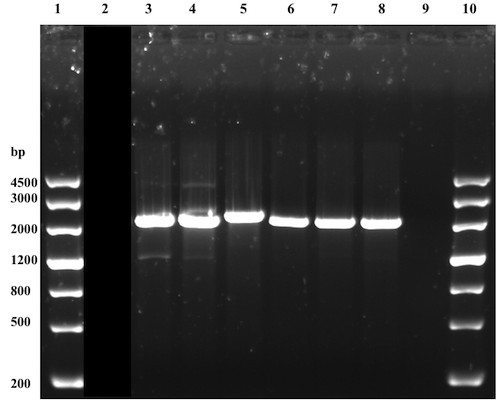
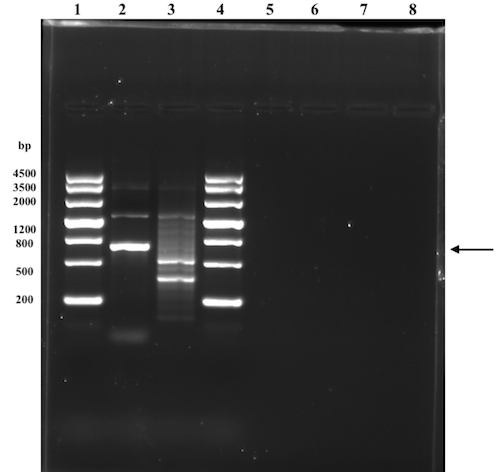
The vector:insert ratio of 1:3 was suspected to be insufficient and a 1:10 ratio was set for the subsequent ligations. A mistake of using the wrong restriction enzymes for the digestion of the backbone resulted in an obvious unsuccessful ligation. The following, 10th, attempt where the same samples were used (except for the backbone, which was now correctly digested), was successful. But the results were not confirmed until a single digestion analysis had been performed (successfully, see Figure 3) since the analysis of the ligation product were inconclusive. The sample in well 5 (see Figure 3) had the expected size and was further used. Presence of the correct construct was further proved after overhang PCR amplification with the Nuc_R reverse primer, designed with a BamHI restriction site overhang (see Figure 4). This part (BBa_K2144000) was submitted to the iGEM Part Registry.
Demonstrating expression and investigating solubility of Nuc in E. coli
The assembled expression construct is transformed into BL21(DE3) for optimal expression conditions. Liquid cultures of transformed cells are then induced with 0.5 mM or 1 mM IPTG to initiate expression of nuclease. A non-induced culture serves as a reference. After lysing the cells through sonication and collecting the cell debris with centrifugation, both the supernatant and the resuspended pellet are analyzed using SDS-PAGE.
Expression, extraction & SDS-PAGE [✔️]
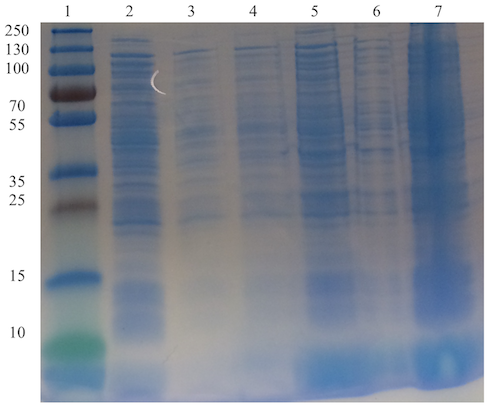
The visible band at the expected size, corresponding to nuclease, in well 2 is not present in the wells (3 and 4) with the samples with lower IPTG induction concentrations. This indicates that the plasmid of interest is functional and that nuclease is expressed when inducing with IPTG. Since the same band is also visible in well 5 (pellet resuspension sample), and increasingly faint in well 6 and 7 as the IPTG concentration decreases, it is difficult to draw any conclusions whether nuclease is soluble or not.
Demonstrating efficient biofilm inhibition by Nuc
A crystal assay is conducted to evaluate how Nuc inhibits biofilm growth by P. aeruginosa and S. aureus, respectively. Induced BL21(DE3) cell lysate samples (both debris pellet resuspension and supernatant) are used for the experiment.
S. aureus was cultured in BHI media and P. aeruginosa PAO in LB media. After an overnight incubation, the cell density is measured at OD 600. Also, 200 µl of the liquid culture is added into each well and treated with Nuc of four different volumes; 1, 5, 10 and 20 µl. The biofilm is allowed to develop for 48 hours with subsequent staining. Absorbance is then measured at 595 nm. Cell lysates of BL21(DE3) cells are used as negative control. Differences between the negative control and Nuc is evaluated using the Student’s t-test. A p-value <0.05 is considered statistically significant.
Biofilm assay: First Attempt [❌]
The samples from supernatants and pellet are labelled "Nuc S" and "Nuc P", respectively.
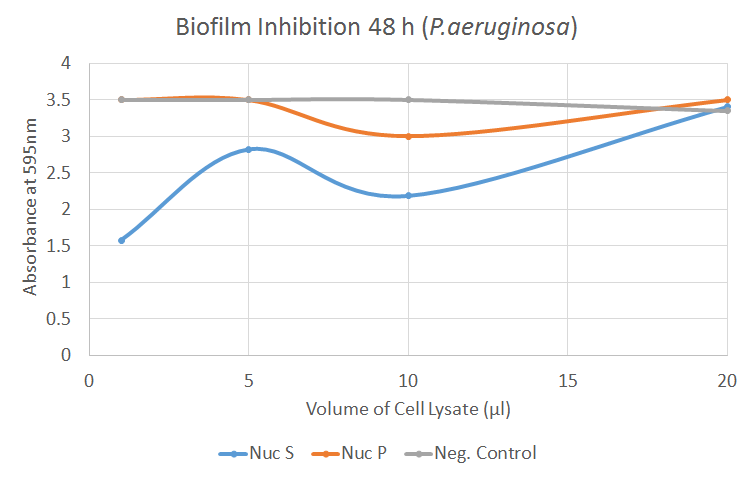
The graph illustrates how the combination of supernatant and resuspended pellet of Nuc cell lysate inhibits the formation of biofilm by P. aeruginosa. As the treatment increases, the absorbance tends to increase as well. There is a significant difference (p=0.02) between the negative control and Nuc S for the 1 µl treatment.
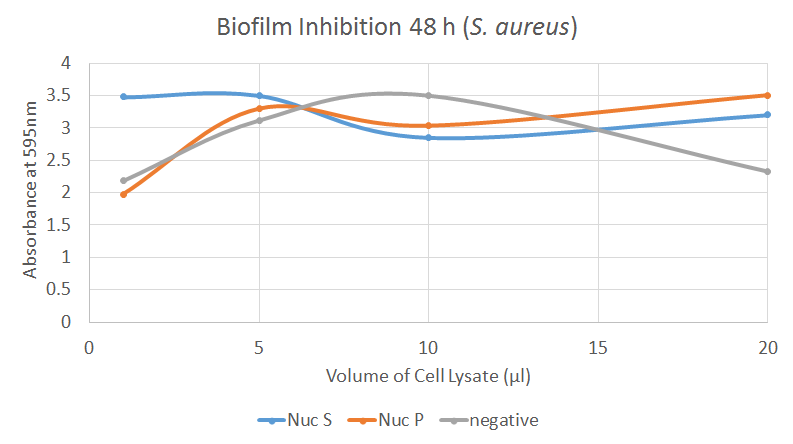
The graph illustrates how the combination of supernatant and resuspended pellet of Nuc cell lysate inhibits the formation of biofilm by S. aureus. The negative control seems inconsistent; it may be that it is dose dependent in S. aureus or that it has been contaminated. This experiment showed a significant difference between 1 µl of negative control and Nuc S, as well as between 20 µl of negative control and Nuc P. However, these results may not be reliable.
Biofilm assay: Second Attempt [❌]
The second attempt of inhibiting biofilm growth was similar to the first. However, this time a combination of pellet and supernatant was used as treatment with the ratio 1:1, e.g. for 5 µl treatment, 2.5 µl of each was used. For this attempt the biofilm was treated with 5 µl, 20 µl and 50 µl of Nuc. The samples were labelled "Nuc" and the negative control was labelled "Neg". Only one volume of negative control was used.
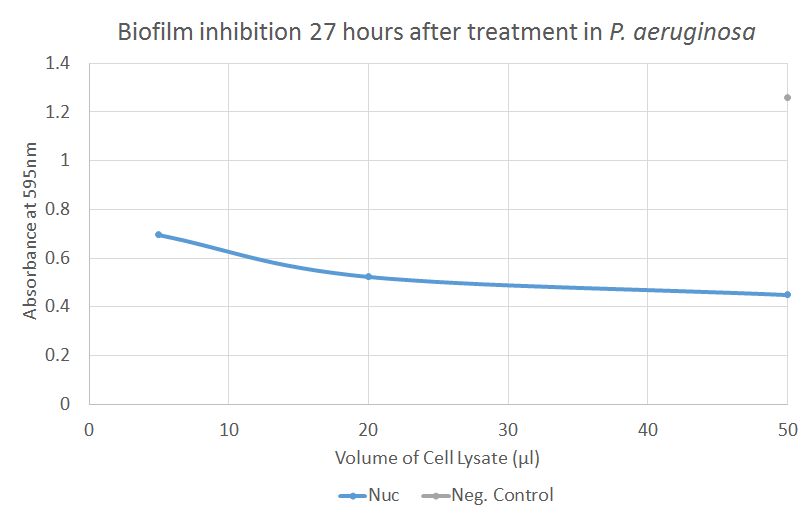
The figure illustrates how Nuc (supernatant and pellet in a 1:1 ratio) inhibits biofilm formation by P aeruginosa. These results show that absorbance decreases as the volume of treatment increases. There is a significant difference between the negative control and 20 µl and 50 µl of Nuc treatment, respectively.
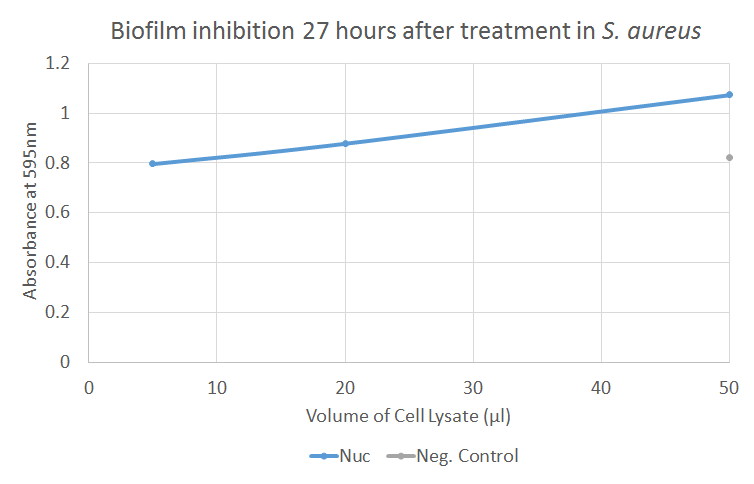
The figure illustrates how Nuc (supernatant and pellet in a 1:1 ratio) inhibits biofilm formation by S. aureus. The poor readout of the negative control implicates that the test is invalid. However, the absorbance of biofilm increases as volume of Nuc increases, and the negative control shows low values. There is a significant difference between the negative control and 50 ul of Nuc.
Demonstrating efficient biofilm dispersal by Nuc
Biofilm dispersal by Nuc is demonstrated using crystal violet assays; one with P. aeruginosa as the biofilm-producer, and the other with S. aureus. Induced BL21(DE3) cell lysate samples (both debris pellet resuspension and supernatant) are used for the experiment. The biofilm is treated with 1 µl, 5 µl, 10 µl, or 20 µl of Nuc sample. Differences between the negative control and Nuc are evaluated using the student’s t-test. A p-value <0.05 is considered statistically significant.
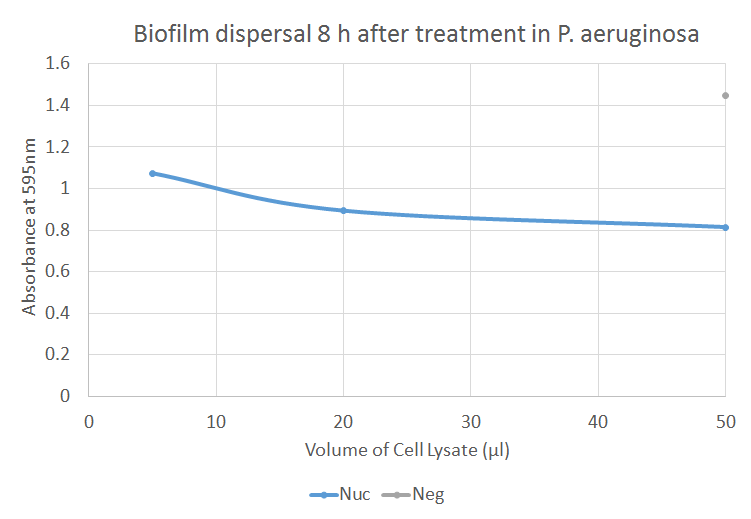
Biofilm assay: First attempt [❌]
The samples from supernatants are labelled "Nuc S". The samples from the pellets were contaminated and are not shown in the results.
The graph illustrates how different volumes of Nuc dispersed biofilm formed by P. aeruginosa. There is a significant difference (p=0.023) between the negative control and 1 µl of Nuc treatment. Notably, the absorbance, associated with the amount of biofilm present, decreases as the amount of negative control increases. This may be due to contamination or elution or dispersal of biofilm because of the increased amount of fluid per se in the treatment.
The graph illustrates how different volumes of Nuc dispersed biofilm formed by S. aureus. There is a significant difference between 5 µl of negative control and 5 µl of Nuc S.
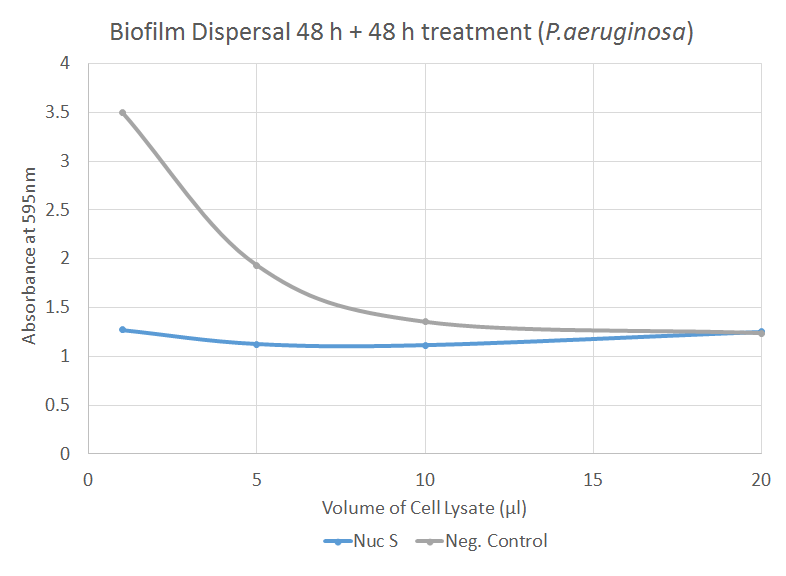
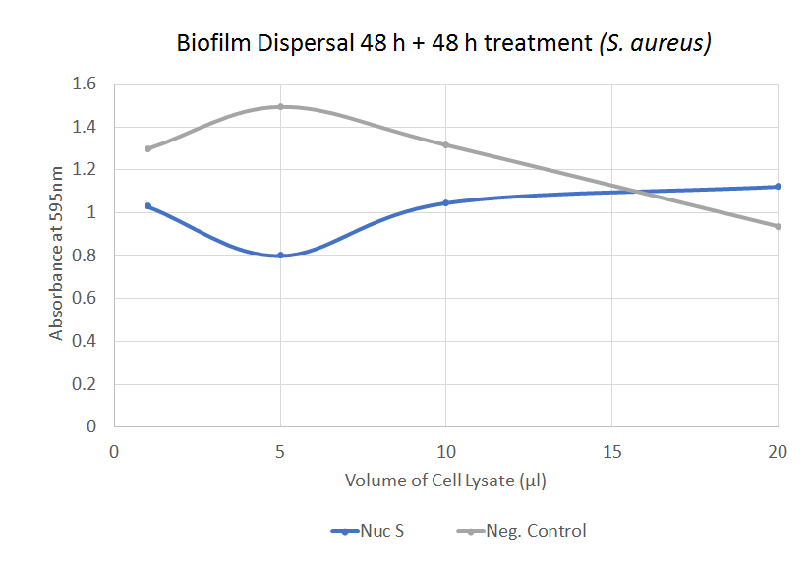
Biofilm assay: Second attempt [✔️]
The second attempt of dispersing biofilm was similar to the first. However, this time a combination of pellet and supernatant was used as treatment with the ratio 1:1, e.g. for 5 µl treatment, 2.5 µl of each was used. For this attempt the biofilm was treated with 5 µl, 20 µl and 50 µl of Nuc. The samples were labelled "Nuc" and the negative control was labelled "Neg". Only one volume of negative control was used.
The figure illustrates how Nuc dispersed biofilm produced by P. aeruginosa. There is a significant difference between the negative control and each of the three volumes of Nuc. As the volume of Nuc increases, the absorbance at 595 nm tends to decrease. This implicates that Nuc significantly dispersed biofilm compared to the negative control.
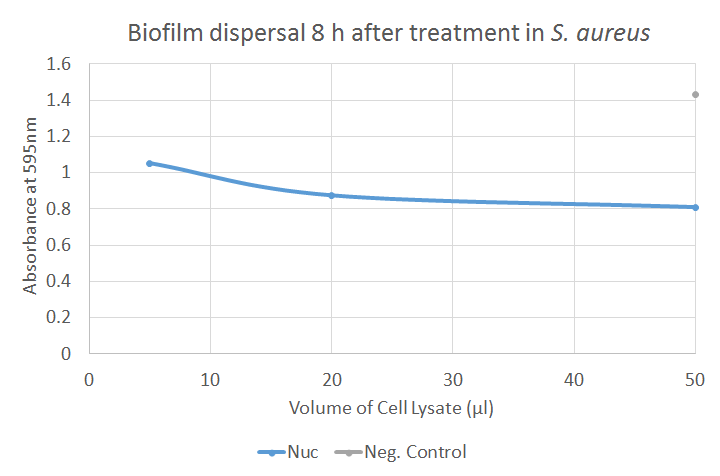
The figure illustrates how Nuc dispersed biofilm produced by S. aureus. There is a significant difference between the negative control and each of the three volumes of Nuc. This implicates that Nuc significantly dispersed biofilm compared to the negative control.
Demonstrating bacteriolytic activity of Nuc
A Kirby-Bauer test is suitable to perform to test the bacteriolytic activity. For this particular test, the E. coli TOB1 strain is used. The bacteria are streaked on antibiotic-free agar plates onto which small circular filter papers impregnated with the bactericide are placed. Additionally to the cell lysate samples containing the combat protein, a positive control in the form of an antibiotic are applied as a reference. The bactericidal activity can then be measured by measuring the “halo” around the impregnated Whatman paper. The larger halo, the higher bactericidal activity.
Kirby-Bauer: First attempt [❌]
The growth of the bacteria was unevenly distributed on the agar plates which made it difficult to observe any clear results from most of the impregnated filter papers. The filter papers that were actually surrounded with cells did not show any signs of impeding growth.
Troubleshooting
A higher concentration of the initial liquid culture of TOB1 cells will be used for the test to make sure that the entire area of the agar plate will be covered with sufficient amount of cells. Also, the filter paper used were not optimal for the experiment, which could have affected the dispersion of the nuclease.
Kirby-Bauer: Second attempt [❌]
The same cell lysates were used for this attempt. However, it was unsuccessful. There were no signs of impeded growth around the nuclease impregnated Whatman papers. There are three possible explanations to this result; i) the nuclease did not have a bactericidal effect on the TOB1 E. coli strain, ii) the concentration of nuclease in the cell lysate was too low or iii) the plasmid construct present in the BL21(DE3) cells used for expressing was not correct or had been unintentionally altered.
Troubleshooting
The IPTG induction time when expressing nuclease in BL21(DE3) could have been too short. This time will be increased in future expressions.
Kirby-Bauer test with TOB1: Third attempt [❓]
The results from the third attempt were inconclusive since it was difficult to determine whether the growth of TOB1 around the impregnated Whatman papers was actually impeded. More clear results of the activity of nuclease were obtained from the biofilm assay of the same cell lysate samples.
Adding Sortase and His tags to the expression construct
In order to purify and attach nuclease to the spider silk using Sortase A, a DNA sequence coding for a His-tag and a cognition motif (LPETGG) are added downstream to Nuc in the assembled expression construct. This sequence is called linker-tags (LT) in our documentation. BamHI is employed for the ligation of Nuc and tag sequence. BamHI restriction site is introduced downstream to Nuc through overhang PCR of the T7-Nuc sequence, as the first step. 3A assembly is then applied where the PCR amplified part is then digested with EcoRI and BamHI, the backbone with EcoRI and PstI, and the tag sequence with BamHI and either SpeI or PstI. This new final construct is transformed into TOP10 cells for optimum transformation efficiency.
Assembly: First attempt [❓]
Gel electrophoresis showed no band at expected sizes and several contaminations at smaller sizes. Result of analysis of the extracted plasmid after transformation were also negative, showing several bands but none of them corresponding to the expected size of approximately 900 bp. However, since there actually were colonies on the plates after transformation, the possibility of a successful ligation can not be rejected.
Troubleshooting
An variant to the 3A assembly process will be performed with only one insert where the entire pSB1C3-T7-Nuc plasmid will be PCR amplified with an BamHI overhang primer, and used as a linearized backbone in the ligation. This way, the T7-Nuc sequence will already be fused with the backbone. The linker-tag (LT) sequence will then be the only insert to be ligated, hopefully increasing the probability if a successful ligation.
Assembly: Second to Tenth Attempt [❌]
The assembly method with Phusion overhang PCR amplified pSB1C3-T7-Nuc plasmid discussed in the troubleshooting prior to these attempts was further discussed and modified to only involve on ligation step of both ends (BamHI and PstI). The first step in the modified assembly method was to PCR amplify the whole pSB1C3-T7-Nuc plasmid with the SuffixF and NucR overhang primer (with BamHI sequence). This linearized sequence were then to be digested at the ends (BamHI and PstI) and PCR purified prior to ligation with the tag sequence digested with at the same restriction sites, resulting in a 1 to 1 fusion (one backbone and one insert). The amplification of the pSB1C3-T7-Nuc construct were performed with a Phusion polymerase and the corresponding protocol. However, the original protocol (from NEB) was very general and a majority of the parameters had to be adjusted according to the specific experiment. This turned out to be very difficult and complicated. Adjustments of the reaction buffer, annealing temperature, extension time, and concentration of DMSO were found to be the major factors affecting the outcome of the PCR. These were set in different combinations where the annealing temperature and the extension time was increased if there were many small sized contaminations (relative the expected size of 2672 bp), and lowered with added DMSO if the results showed no bands. These attempts were unsuccessful since none of the PCR program setups resulted in a product of the correct size.
Troubleshooting
According to the result in the last attempt (see figure) there are no contamination. However, the one visible band is not of the expected size, it is smaller. No contaminations indicate a specific binding of the primers, hence a suitable annealing temperature was set. Parameters that could be adjusted further is then the extension time but also the denaturation time. If the reason for the too short sequence is the limit of in extension time or not enough denaturation, increasing these two factors would then probably solve the problem.