| Line 32: | Line 32: | ||
</div> | </div> | ||
<div class="col-md-3"> | <div class="col-md-3"> | ||
| − | <ul id="sidemenu" style="width: | + | <ul id="sidemenu" style="width:100%"> |
<li><a href="#" onclick="return toEvent('sec1');">Overview</a></li> | <li><a href="#" onclick="return toEvent('sec1');">Overview</a></li> | ||
<li><a href="#" onclick="return toEvent('sec2');">Prediction & Quantifying</a></li> | <li><a href="#" onclick="return toEvent('sec2');">Prediction & Quantifying</a></li> | ||
Revision as of 02:58, 11 October 2016
One of the main aspect of our project U-KNOW is to measure the exact urine glucose concentration by the fluorescent intensity of glucose-induced RFP. We did it successfully and precisely.
From the data of fluorescent intensity, we approached and analyzed it both numerically by mathematical fitting and theoretically by modeling with enzyme kinetics. As a result, we derived a prediction formula, that can use fluorescent intensity as input, to output the glucose concentration. To verify the formula we performed a test to determine whether U-KNOW can quantify the concentration of glucose. Result: Compared The theoretical value to the actual value with n=63, the average recovery rate is 104% 〈95% ~114%〉
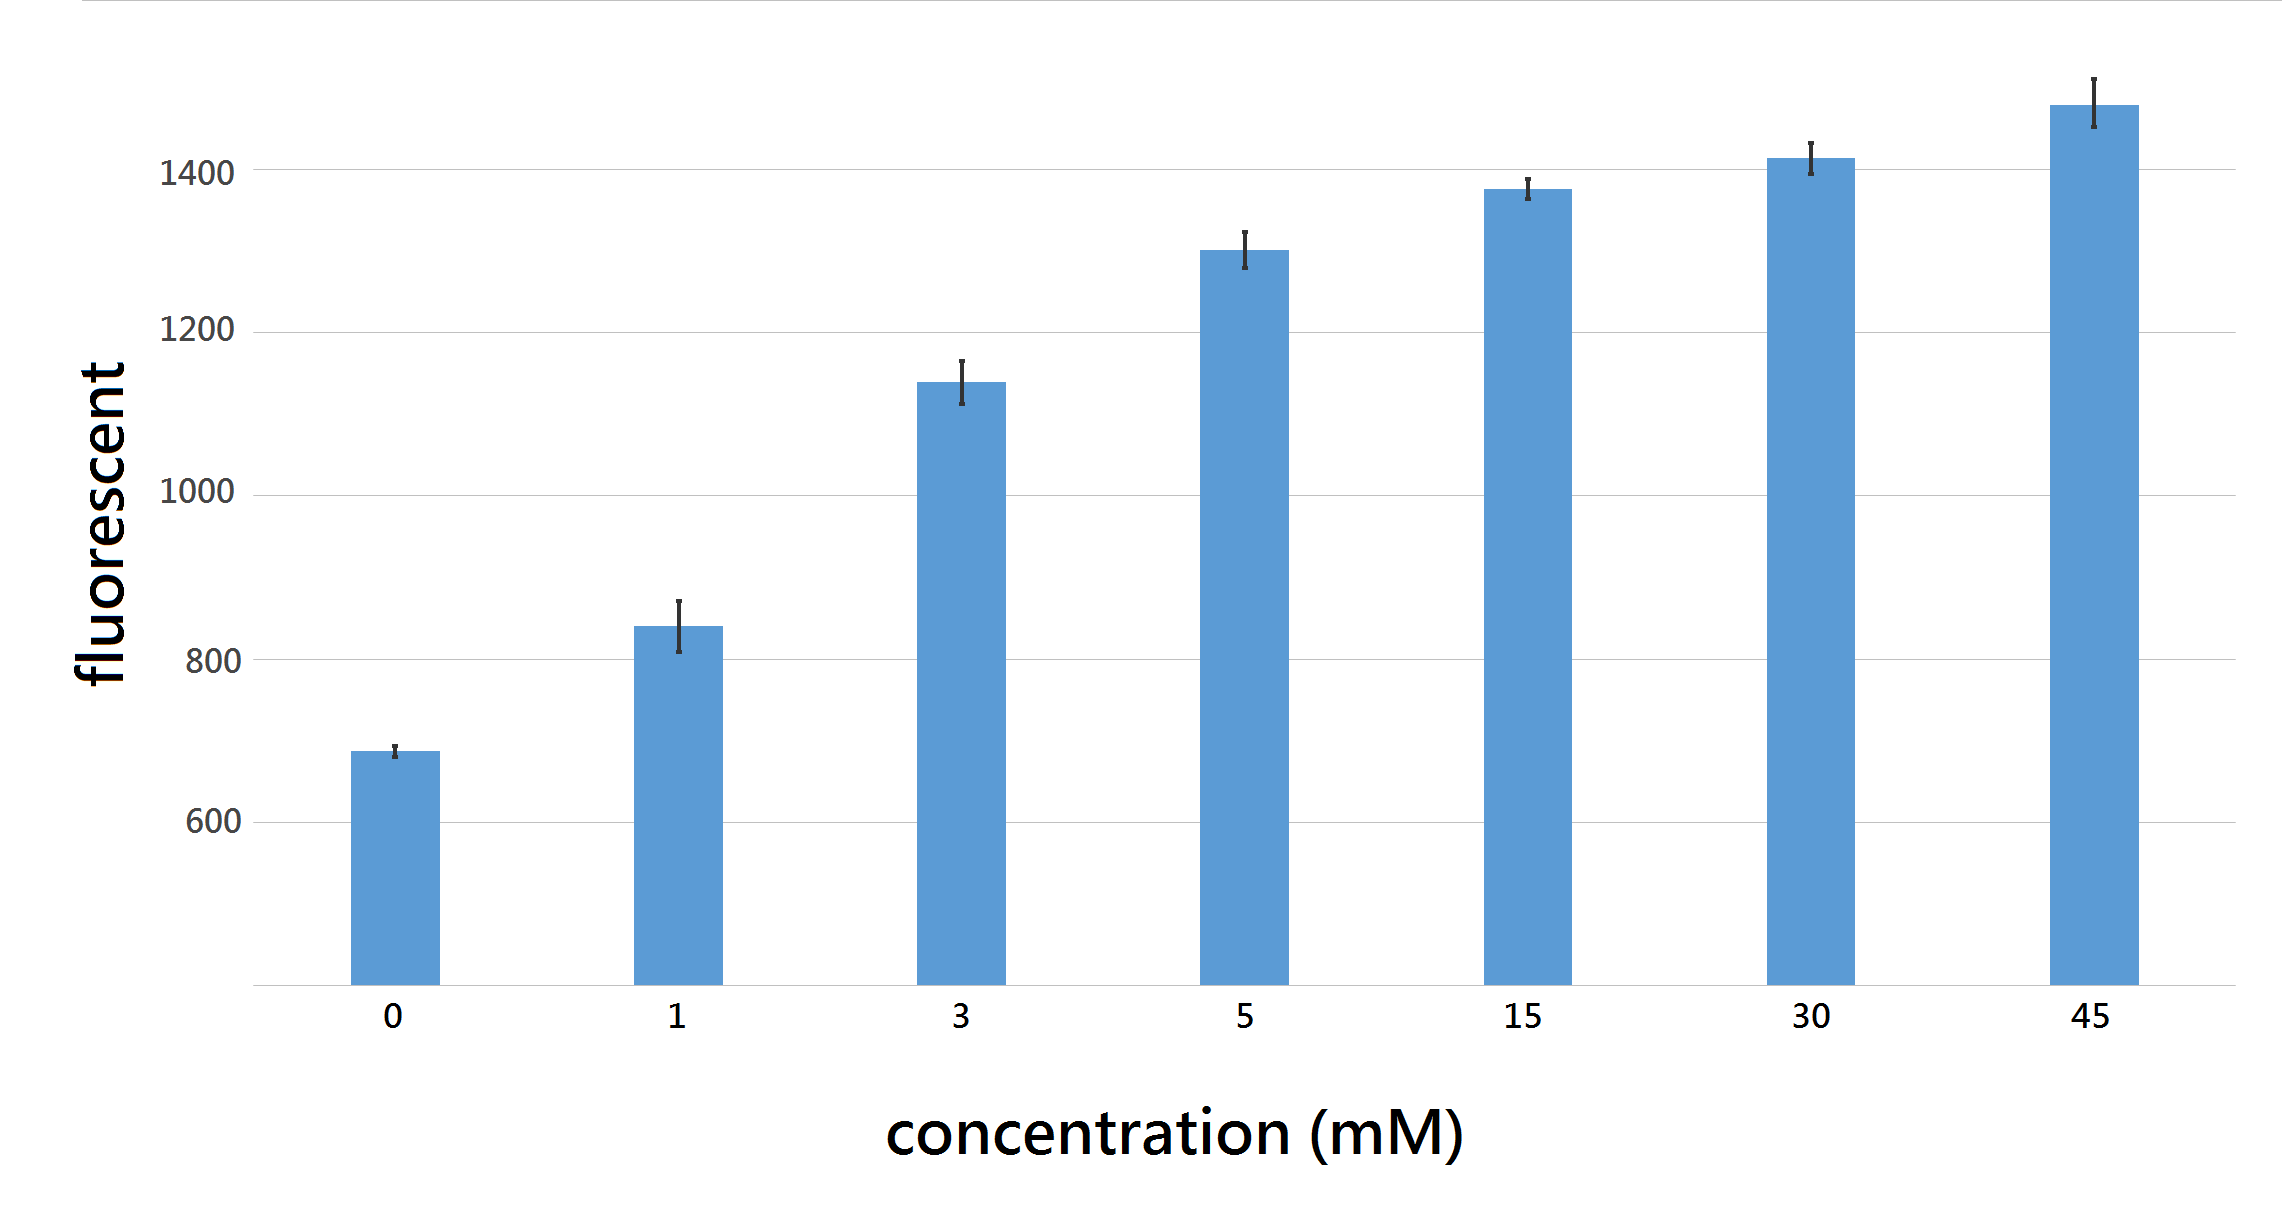
Our goal is to determine the amount of glucose present in urine sample. Thus, we used final glucose concentration of: 0,1,3,5,15,30,45 mM/L to induce our U.coli for 12 hours in 96 well and measure the fluorescent intensity at excitation/emission wavelength 562nm/599nm, the difference of fluorescent intensity between each group were significant at T (time) = 8hr.

Figure 5: fluorescence intensity with 95% confidence interval after 8 hour induction with final glucose concentration 0,1,3 5,15,30,45 mM/L, all differences between each group shows statistical significance with P < 0.05, proving that out U.coli do differentiate urine sample containing various amount of glucose, ranging from 0~45 mM/L.
Based on the results above, we derived a prediction formula, to calculate the urine glucose concentration.

Figure 6: $$\frac{dY}{dt}=\frac{17.05\times [Glucose]^{1.18}+16.07}{[Glucose]^{1.18}+4.04}$$
To verify the formula, we performed a test to clarify whether our U.coli can predict and quantify the concentration of urine glucose.
Reuslt: with n=63, the average recovery rate is 104%〈95% ~114%, which proved that our U.coli do predict and quantify the concentration of urine glucose
In conclusion, by applying this prediction formula, it shown that our U.coli could predict and quantify the concentration of urine glucose.

