Difference between revisions of "Team:NCKU Tainan/Results"
| Line 30: | Line 30: | ||
<p>Within the preliminary test, we induced our U.coli to function our Detection circuit. After 12 hours, the glucose concentrations are 0,5,15,30,60 mM/L </p> | <p>Within the preliminary test, we induced our U.coli to function our Detection circuit. After 12 hours, the glucose concentrations are 0,5,15,30,60 mM/L </p> | ||
| − | <img src="wiki/images/9/91/T--NCKU_Tainan--image001.png" alt="fig2 result: PI_RBS_RFP_TT"> | + | <img src="/wiki/images/9/91/T--NCKU_Tainan--image001.png" alt="fig2 result: PI_RBS_RFP_TT"> |
<p><b>Figure 2:</b> PI_RBS_RFP_TT transformed in <i>E.coli</i> BL21 DE3. After 12-hour induction with final glucose concentration of : 0,5,15,30,60 mM/L, the fluorescence is observed under excitation ray of 470 nm and with the filter “LEE filter 019”</p> | <p><b>Figure 2:</b> PI_RBS_RFP_TT transformed in <i>E.coli</i> BL21 DE3. After 12-hour induction with final glucose concentration of : 0,5,15,30,60 mM/L, the fluorescence is observed under excitation ray of 470 nm and with the filter “LEE filter 019”</p> | ||
| Line 76: | Line 76: | ||
<p>The goal for our Safety circuit is to protect our U.coli user as well as the environment. When arabinose presenting in our column-by-column reading device, the promoter pBAD is activated to lyse and kill the U.coli. Also, the growth curve and performed CFU assay were measured to determine the efficacy of the Safety circuit.</p> | <p>The goal for our Safety circuit is to protect our U.coli user as well as the environment. When arabinose presenting in our column-by-column reading device, the promoter pBAD is activated to lyse and kill the U.coli. Also, the growth curve and performed CFU assay were measured to determine the efficacy of the Safety circuit.</p> | ||
| − | <img src="wiki/images/c/c6/T--NCKU_Tainan--image005.png" alt="fig6.5"> | + | <img src="/wiki/images/c/c6/T--NCKU_Tainan--image005.png" alt="fig6.5"> |
<img src="/wiki/images/2/26/T--NCKU_Tainan--image007.png" alt="fig6.5"> | <img src="/wiki/images/2/26/T--NCKU_Tainan--image007.png" alt="fig6.5"> | ||
<p><b>Figure 6.5:</b></p> | <p><b>Figure 6.5:</b></p> | ||
Revision as of 17:27, 10 October 2016
Result / Proof of concept
1. We constructed and submitted our Detection circuit and Safety circuit that serve as a glucose sensor and function the suicide system.
2. We successfully differentiated diabetic urine samples with control with statistical significance and great sensitivity.
3. We characterized the relation between the glucose concentration and RFP fluorescent intensity; furthermore, the prediction formula to quantify the amount of glucose in a urine glucose level was derived.
4. We validated our bio-safety suicide system.
5.We built functional prototypes to let our U.coli work in a real world condition
Experiment Design
The goals for our Detection circuit are to detect and indicate the presence of urine glucose with promoter PI. To measure the precise level of urine glucose, we need to look at the fluorescence intensity of RFP.
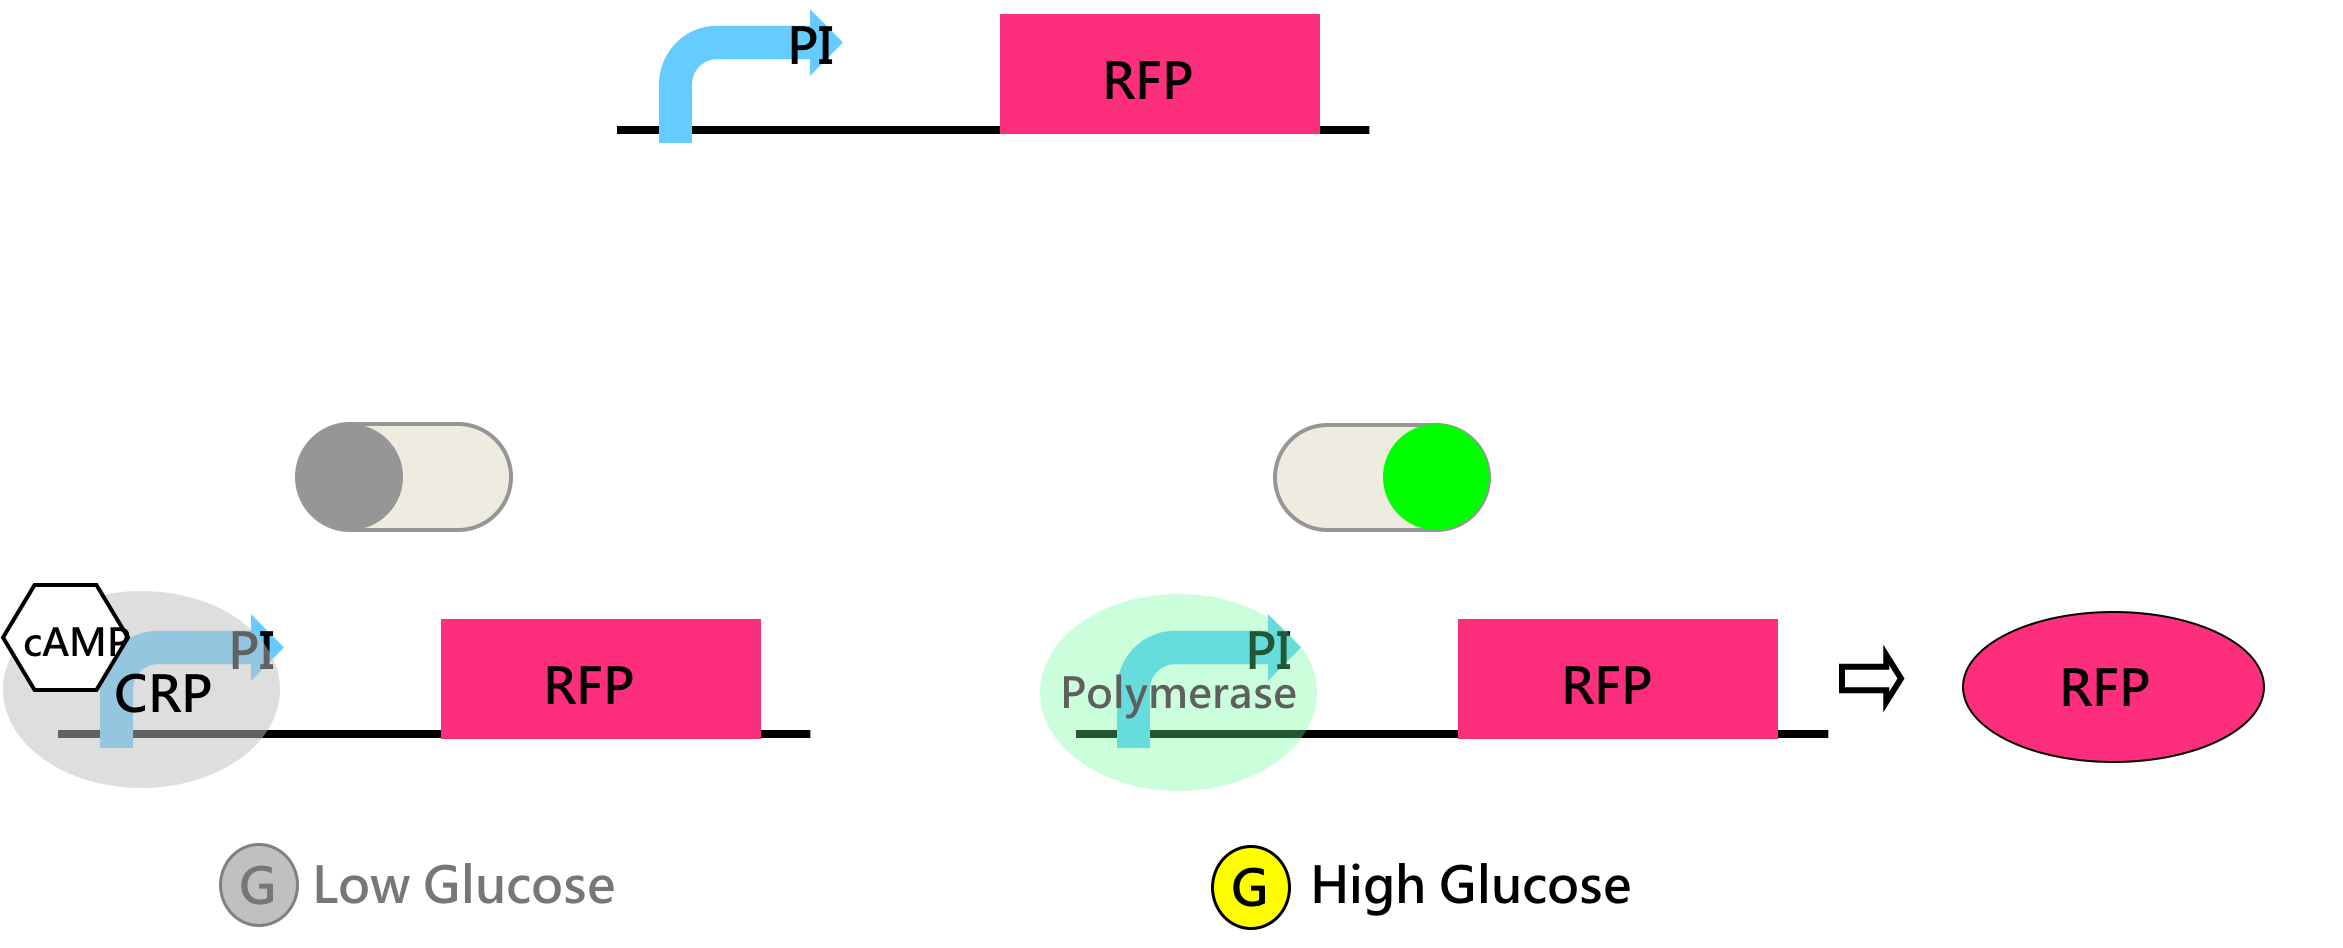
Figure 1: We induce our U.coli detection circuit with urine samples containing different glucose level and measure the fluorescent intensity kinetically at different timepoints.
Characterization of glucose induced RFP expression
Within the preliminary test, we induced our U.coli to function our Detection circuit. After 12 hours, the glucose concentrations are 0,5,15,30,60 mM/L
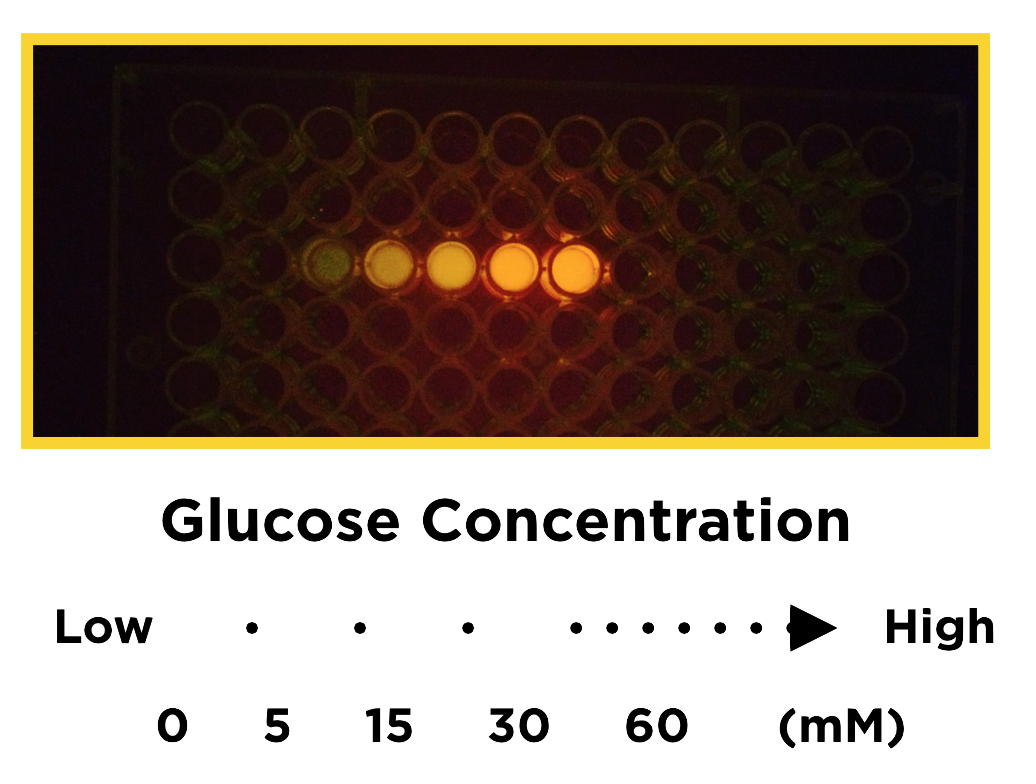
Figure 2: PI_RBS_RFP_TT transformed in E.coli BL21 DE3. After 12-hour induction with final glucose concentration of : 0,5,15,30,60 mM/L, the fluorescence is observed under excitation ray of 470 nm and with the filter “LEE filter 019”
To further quantify the fluorescent intensity, and simultaneously the growth curve of U.coli, we used final glucose concentration of: 0,5,15,30 mM/L to induce our U.coli for 8 hours with total volume of 20 ml, and measure the fluorescent intensity at excitation/emission wavelength 562nm/599nm and OD600 for growth curve.
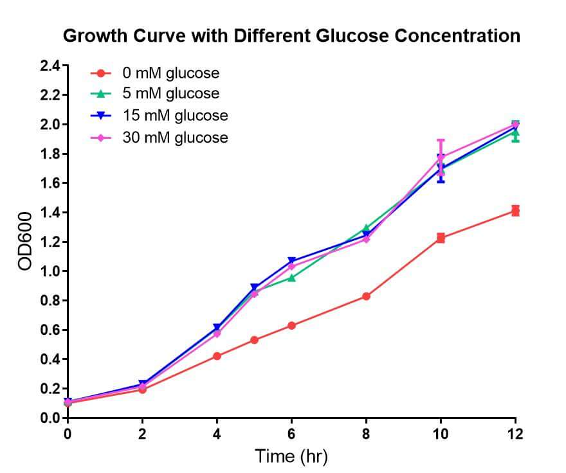
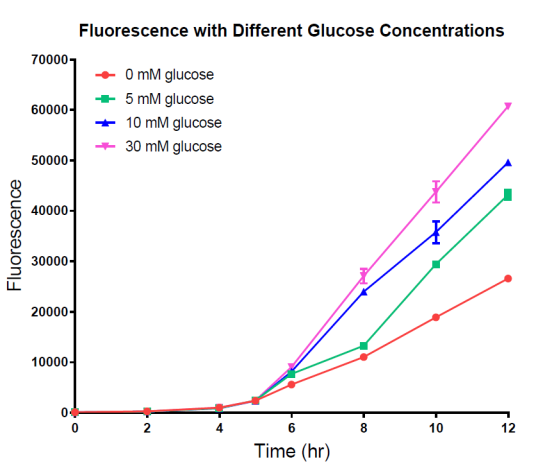
Figure 3: above is the growth curve and fluorescent intensity, the experiments were done in E.coli BL21 DE3 in modified M9 medium, the cell were cultured in modified M9 medium for 2 hours and glucose of final concentration: 0, 5, 15, 30 mM/L were add to induce the expression of RFP. The fluorescent intensity were measured every 2 hours, after total time exceeds 10 hours, experiments with 5, 15, 30 mM/L glucose has 2~4 fold induction compared to control 〈0 mM/L〉. The presence of glucose also affects the growth curve of our U.coli compared to control, but the growth curves of 5, 15, 30 mM/L does not show significant difference.
Proof of Concept: Differentiating diabetic urine with normal
To proof that our U.coli serves the purpose to differentiate between diabetic and normal urine samples, we calculated the average prediction interval for fluorescent intensity on each glucose concentration. The upper control limit is considered as the threshold of “positive”. When the fluorescent intensity in a urine sample surpasses the upper control limit, we can refer to the urine sample as diabetic urine. Furthermore, the diabetic test on U-KNOW has sensitivety : / spreciticity :

Figure 4: the 95% prediction interval of glucose positive 〈5mM/L〉urine sample 〈green〉and glucose negative〈0.1mM/L〉 urine sample〈red〉,the two intervals can be separated after T> 101 mins. To verify the function, by applying the upper limit of the 95% prediction interval of glucose negative urine sample〈red〉as the “diabetic threshold“, we performed a test to clarify whether our U.coli can differentiate diabetes from control. At time T= 101mis with n= 84, our result shows sensitivity= 95% and if we delay the testing time to T=120mins, the sensitivity will be 100%.〈n=84〉, which proved that our U.coli do Differentiate diabetic urine with norma
To further elaborate our proof of concept, we have a statistical calculation
Proof of Concept: Prediction and Quantifying the amount of urine glucose
After successfully differentiating diabetic urine sample with control, we aim to measure the amount of glucose in urine sample. Thus, we used final glucose concentration of: 0,1,3,5,15,30,45 mM/L to induce our U.coli for 12 hours in 96 well and measure the fluorescent intensity at excitation/emission wavelength 562nm/599nm, the difference of fluorescent intensity between each group were significant at T (time) = 8hr.
Figure 5: fluorescence intensity with 95% confidence interval after 8 hour induction with final glucose concentration 0,1,3 5,15,30,45 mM/L, all differences between each group shows statistical significance with P < 0.05, proving that out U.coli do differentiate urine sample containing various amount of glucose, ranging from 0~45 mM/L.
Based on the results above, we derived a prediction formula, to calculate the urine glucose concentration 〈C〉

Figure 6: $$\frac{dY}{dt}=\frac{17.05\times [Glucose]^{1.18}+16.07}{[Glucose]^{1.18}+4.04}$$
To verify the formula, we performed a test to clarify whether our U.coli can predict and quantify the concentration of urine glucose.
Reuslt: with n=63, the average recovery rate is 104%〈95% ~114%, which proved that our U.coli do predict and quantify the concentration of urine glucose
In conclusion, by applying this prediction formula, it shown that our U.coli could predict and quantify the concentration of urine glucose.
Experiment Design
The goal for our Safety circuit is to protect our U.coli user as well as the environment. When arabinose presenting in our column-by-column reading device, the promoter pBAD is activated to lyse and kill the U.coli. Also, the growth curve and performed CFU assay were measured to determine the efficacy of the Safety circuit.

Figure 6.5:
Growth Inhibition and Lysis activation
Promoter pBAD, is activated by arabinose and repressed by glucose. When activated the downstream lysis gene, it can lyse and kill the U.coli. In a preliminary safety circuit test, we induced our U.coli 3 hours with the following condition and kinetically measured the OD 600 as the indicator of bacteria concentration

Figure 7: expression of promoter pBAD in different arabinose and gucose concentration, the prescense of glucose will repress promoter pBAD even when arabionse is present
| Group | Final ara. Conc. mM/L | Final glu. Conc. mM/mol |
|---|---|---|
| Blue | 0 | 0 |
| Orange | 10 | 0 |
| Gray | 10 | 50 |
Figure 8: pBAD-RBS-lysis-TT transformed in E.coli BL21 DE3, was culture for 6 hr and transfferd〈1%〉to modified M9 meduim containing different concentration of arabionse and glucose, and OD600 was measured kinetically by 96well plate reader. Compared to control, arabinose significantly inhibited the growth of U.coli after time T>50 mins. In addition, when glucose and arabinose are both present, glucose will repress the growth inhibitory effect of arabinose, making the cells continue to growth. Still, compared to control, the growth rate is slightly decreased by arabinose, even with the presence of glucose.
To further validate the effect of our Safety circuit, we performed a CFU assay.