| Line 1: | Line 1: | ||
<html><head> | <html><head> | ||
| − | <meta charset="utf-8"><link rel="shortcut icon" href="/wiki/images/8/80/T--NCKU_Tainan--favicon.png" type="image/x-icon"><link rel="icon" type="image/png" href="/wiki/images/8/80/T--NCKU_Tainan--favicon.png"><link rel="icon" type="image/x-icon" href="/wiki/images/8/80/T--NCKU_Tainan--favicon.png"><meta name="viewport" content="width=device-width, initial-scale=1.0"><meta property="og:title" content=" | + | <meta charset="utf-8"><link rel="shortcut icon" href="/wiki/images/8/80/T--NCKU_Tainan--favicon.png" type="image/x-icon"><link rel="icon" type="image/png" href="/wiki/images/8/80/T--NCKU_Tainan--favicon.png"><link rel="icon" type="image/x-icon" href="/wiki/images/8/80/T--NCKU_Tainan--favicon.png"><meta name="viewport" content="width=device-width, initial-scale=1.0"><meta property="og:title" content="Project Modeling - iGEM NCKU"><meta property="og:site_name" content="Project Modeling - iGEM NCKU"><meta property="og:description" content=""><title>Project Modeling - iGEM NCKU</title><meta http-equiv="Content-Type" content="text/html" charset="utf-8"><meta property="og:image" content=""><meta property="og:image:type" content="image/png"><link rel="stylesheet" href="/Team:NCKU_Tainan/css/frame/T--NCKU_Tainan--bootstrap_min_css?ctype=text/css&action=raw"><link href="/Team:NCKU_Tainan/font/T--NCKU_Tainan--NotoSans_css?ctype=text/css&action=raw" rel="stylesheet" type="text/css"><link rel="stylesheet" href="/Team:NCKU_Tainan/font/T--NCKU_Tainan--font-awesome_min_css?ctype=text/css&action=raw"> <link rel="stylesheet" href="/Team:NCKU_Tainan/css/T--NCKU_Tainan--Layout_css?ctype=text/css&action=raw"> |
</head> | </head> | ||
<body> | <body> | ||
| Line 7: | Line 7: | ||
</style> | </style> | ||
<div class="container-fluid" style="margin-top:100px"> | <div class="container-fluid" style="margin-top:100px"> | ||
| − | <div class="head"> | + | <div class="head">PROJECT / Model</div> |
<div class="content row"> | <div class="content row"> | ||
| − | + | <div class="col-md-9"> | |
| − | <div class="head2"> | + | <div class="head2">Model</div> |
| − | + | <div class="title-line" id="fitting">Fitting Theory</div> | |
| − | + | <p>To detect the concentration of inputted numerically, a dependable formula for transformation is absolutely needed. Pl is a glucose induced promoter but with complicated regulation pathway. In this section, we derive a formula using quasi-steady state with the method of enzyme kinetics.</p> | |
| − | + | <p>When all compounds reach its steady concentration, the production rate of protein should be a constant and be in form as the following equation:</p> | |
| − | + | // TODO: 放公式 | |
| − | + | <p>And the fitting result also show its accuracy and limitation:</p> | |
| − | + | <img src="/images/3/36/T--NCKU_Tainan--project-modeling-fitting-image5.jpg"> | |
| − | + | <p>(<a href="/Team:NCKU_Tainan/Model_Fitting_Theory">Read more...</a>)</p> | |
| − | + | ||
| − | + | ||
| − | + | ||
| − | + | ||
| − | + | ||
| − | + | ||
| − | + | ||
| − | + | <div class="title-line" id="statistics">Statistics Analysis</div> | |
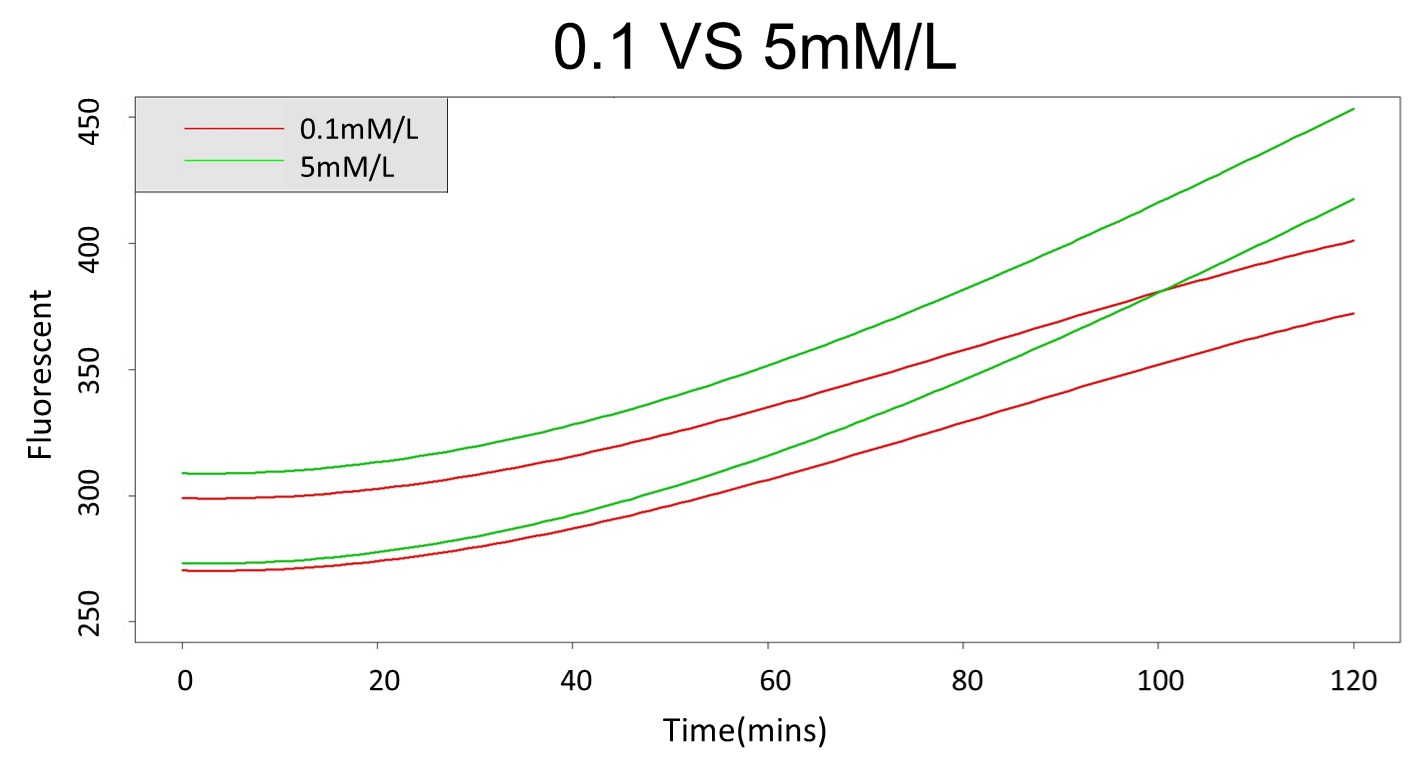
| − | + | <p>In medicine, the blood glucose exceeding 5mM/L implies having diabetes, and it exceeding 120mM/L implies being a severe patient. Finding the person whose glucose concentration is over 5mM/L or 120mM/L is our target.</p> | |
| − | + | <div class="img" style="width:32%;display:inline-block;margin-left:8px"> | |
| − | + | <img src="/wiki/images/c/c0/T--NCKU_Tainan--project-modeling-statistic-image1.jpg"> | |
| − | + | <div>0.1 vs 5 mM/L</div> | |
| − | + | </div> | |
| − | + | <div class="img" style="width:32%;display:inline-block"> | |
| − | + | <img src="/wiki/images/c/c0/T--NCKU_Tainan--project-modeling-statistic-image1.jpg"> | |
| − | + | <div>0.1 vs 120 mM/L</div> | |
| − | + | </div> | |
| − | + | <div class="img" style="width:32%;display:inline-block"> | |
| − | + | <img src="/wiki/images/a/a3/T--NCKU_Tainan--project-modeling-statistic-image3.jpg"> | |
| − | + | <div>0.1 model plot</div> | |
| − | + | </div> | |
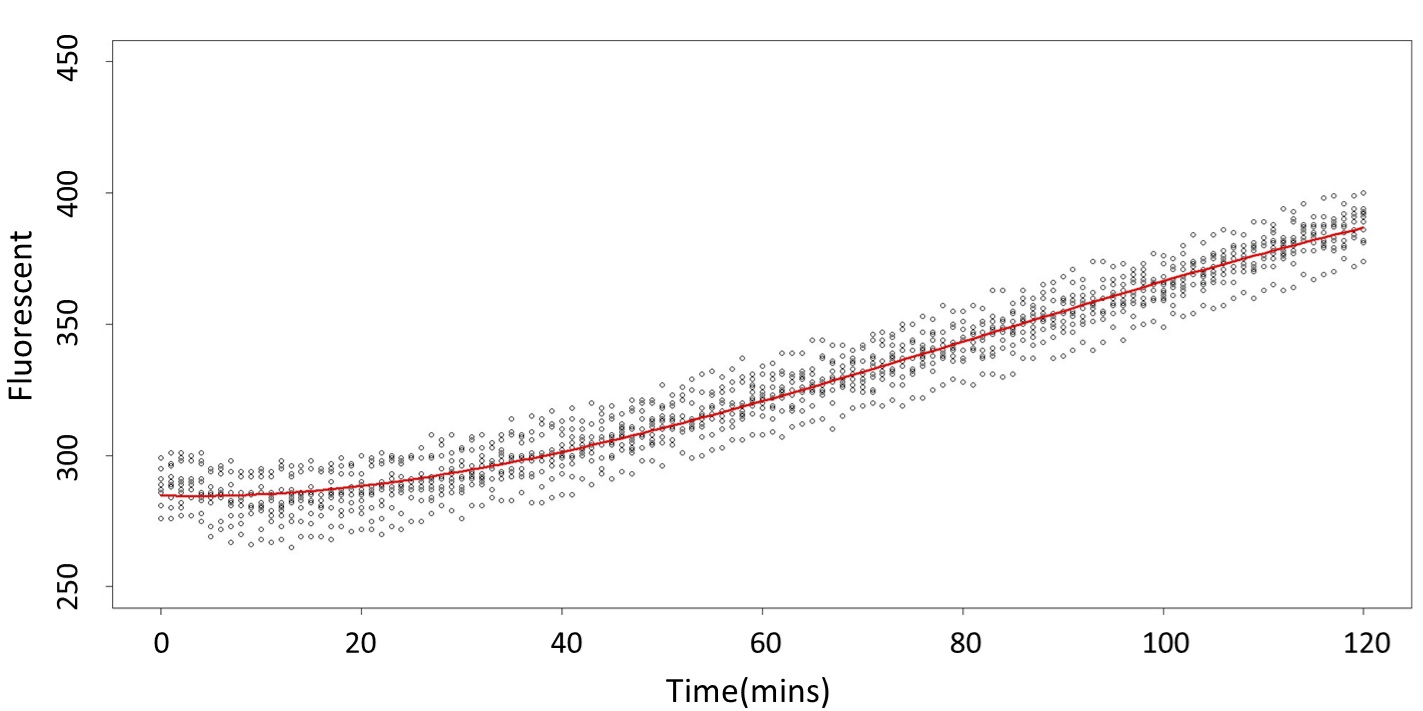
| − | + | <p>First, we prove that there has difference between 0.1mM/L and 5mM/L (120mM/L) in the paired-difference T test part. And, we use the regression and prediction intervals to distinguish exceeding 120mM/L and 5mM/L from exceeding 0.1mM/L. From the result, 5mM/L can be distinguished from 0.1mM/L after 101 minutes, and 120mM/L can be distinguished from 0.1mM/L after 88 minutes.</p> | |
| − | + | ||
| − | + | <p>(<a href="/Team:NCKU_Tainan/Model_Statistics_Analysis">Read more...</a>)</p> | |
| − | + | ||
| − | + | ||
| − | + | ||
| − | + | ||
| − | + | ||
| − | + | ||
| − | + | ||
| − | + | ||
| − | + | ||
| − | + | ||
| − | + | ||
| − | + | ||
| − | + | ||
| − | + | ||
| − | + | ||
| − | + | ||
| − | + | ||
</div> | </div> | ||
<div class="col-md-3"> | <div class="col-md-3"> | ||
<ul id="sidemenu"> | <ul id="sidemenu"> | ||
| − | <li><a href="#" onclick="return toEvent(' | + | <li><a href="#" onclick="return toEvent('fitting');">Fitting Theory</a></li> |
| − | <li><a href="#" onclick="return toEvent(' | + | <li><a href="#" onclick="return toEvent('statistics');">Statistics Analysis</a></li> |
| − | + | ||
</ul> | </ul> | ||
</div> | </div> | ||
</div> | </div> | ||
</div> <!-- /.container-fluid --> | </div> <!-- /.container-fluid --> | ||
| + | <script>document.getElementById("line-left2").style.display="none";</script> | ||
<script src="/Team:NCKU_Tainan/js/frame/T--NCKU_Tainan--jquery-1_12_0_min_js?ctype=text/javascript&action=raw"></script><script src="/Team:NCKU_Tainan/js/frame/T--NCKU_Tainan--bootstrap_min_js?ctype=text/javascript&action=raw"></script><script src="/Team:NCKU_Tainan/js/T--NCKU_Tainan--MathjaxConfigIgem_js?ctype=text/javascript&action=raw"></script><script src="/common/MathJax-2.5-latest/MathJax.js?config=TeX-AMS-MML_HTMLorMML"></script><script src="/Team:NCKU_Tainan/js/T--NCKU_Tainan--common_js?ctype=text/javascript&action=raw"></script><script>(function() { /* change icon */ var link = document.createElement('link'); link.type = 'image/x-icon'; link.rel = 'shortcut icon'; link.href = '/wiki/images/8/80/T--NCKU_Tainan--favicon.png'; document.getElementsByTagName('head')[0].appendChild(link);}());</script> | <script src="/Team:NCKU_Tainan/js/frame/T--NCKU_Tainan--jquery-1_12_0_min_js?ctype=text/javascript&action=raw"></script><script src="/Team:NCKU_Tainan/js/frame/T--NCKU_Tainan--bootstrap_min_js?ctype=text/javascript&action=raw"></script><script src="/Team:NCKU_Tainan/js/T--NCKU_Tainan--MathjaxConfigIgem_js?ctype=text/javascript&action=raw"></script><script src="/common/MathJax-2.5-latest/MathJax.js?config=TeX-AMS-MML_HTMLorMML"></script><script src="/Team:NCKU_Tainan/js/T--NCKU_Tainan--common_js?ctype=text/javascript&action=raw"></script><script>(function() { /* change icon */ var link = document.createElement('link'); link.type = 'image/x-icon'; link.rel = 'shortcut icon'; link.href = '/wiki/images/8/80/T--NCKU_Tainan--favicon.png'; document.getElementsByTagName('head')[0].appendChild(link);}());</script> | ||
</body></html> | </body></html> | ||
Revision as of 19:24, 9 October 2016
To detect the concentration of inputted numerically, a dependable formula for transformation is absolutely needed. Pl is a glucose induced promoter but with complicated regulation pathway. In this section, we derive a formula using quasi-steady state with the method of enzyme kinetics.
When all compounds reach its steady concentration, the production rate of protein should be a constant and be in form as the following equation:
// TODO: 放公式And the fitting result also show its accuracy and limitation:

In medicine, the blood glucose exceeding 5mM/L implies having diabetes, and it exceeding 120mM/L implies being a severe patient. Finding the person whose glucose concentration is over 5mM/L or 120mM/L is our target.


First, we prove that there has difference between 0.1mM/L and 5mM/L (120mM/L) in the paired-difference T test part. And, we use the regression and prediction intervals to distinguish exceeding 120mM/L and 5mM/L from exceeding 0.1mM/L. From the result, 5mM/L can be distinguished from 0.1mM/L after 101 minutes, and 120mM/L can be distinguished from 0.1mM/L after 88 minutes.

