Team:NCKU Tainan/Software
In order to make U.coli works automatically, we develop software that can calculate the data obtained by our device and translate into the glucose concentration with a user-friendly interface.
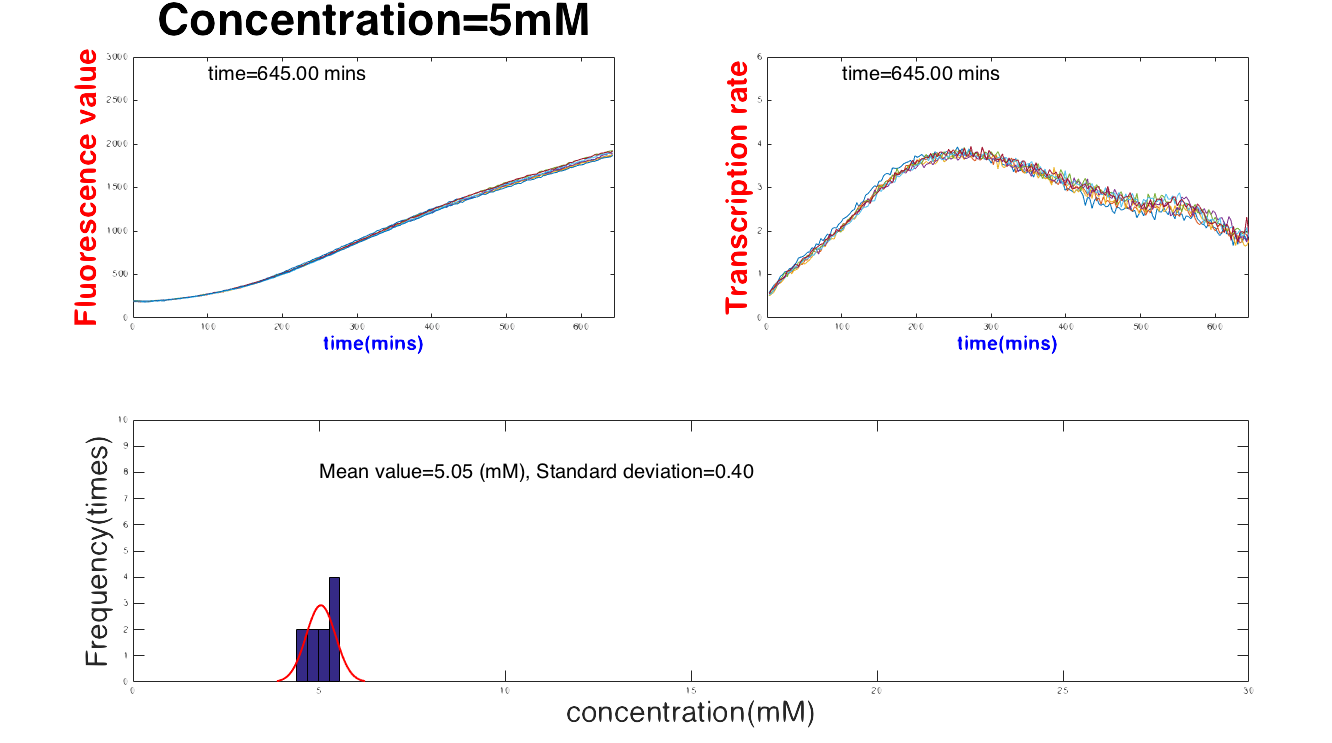
The logic of the code is as follow: Calculating the production rate whenever a new data is inputted, when the production rate starts to decline, automatically find out the value production rate and calculate the corresponding glucose concentration value by the formula we introduce in model.
The result can be divided into three parts: Safe, In danger and Emergency. As you can see in Figure 1, when glucose concentration is between 1 mg/μL and 30 mg/μL, our device can numerically report the glucose concentration with mean value and standard deviation, see Figure 2.

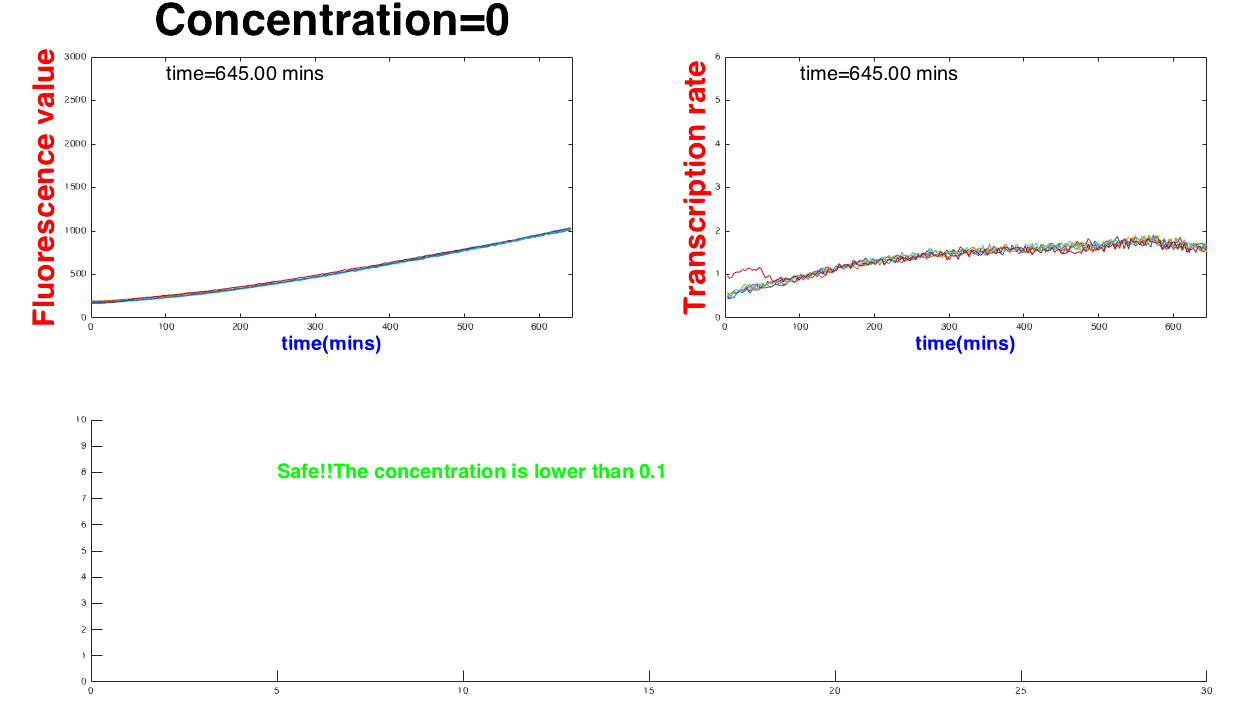
If the concentrate is outside of this range, the software will report ‘‘Safe” if the concentration is too low or ‘‘Emergency’’ if the concentration is too high, see Figure 3.
 (b)
(b)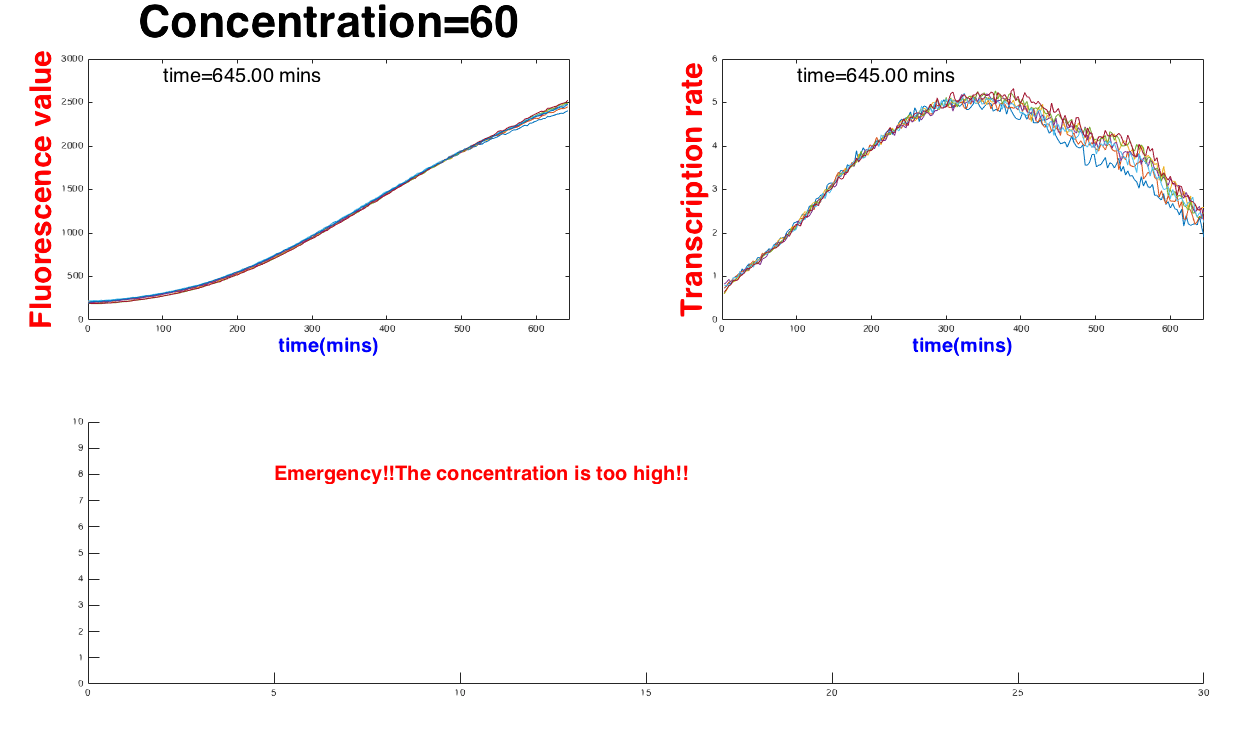
By using this code, we can let computer automatically analysis the data and give a report weekly so that our user can adjust their life style by knowing the body condition.