| Line 11: | Line 11: | ||
<div class="col-md-9"> | <div class="col-md-9"> | ||
<div class="head2">Model</div> | <div class="head2">Model</div> | ||
| + | <p>To analyze the data obtained from U. coli, we adopted two methods to estimate the glucose concentration efficiently and accurately. With the statistical method, the glucose can be differentiated from the user's urine in 2 hours. On the the hand, the theory-dependent fitting method is used to numerically analyze the urine glucose concentration in 6 hours.</p> | ||
<div class="title-line" id="fitting">Fitting Theory</div> | <div class="title-line" id="fitting">Fitting Theory</div> | ||
| − | + | ||
<p>When all compounds reach its steady concentration, the production rate of protein should be a constant and be in form as the following equation:</p> | <p>When all compounds reach its steady concentration, the production rate of protein should be a constant and be in form as the following equation:</p> | ||
<p>$$\frac{[Protein]}{dt}=\frac{c1[Glucose]+c2}{[Glucose]+c3}$$</p> | <p>$$\frac{[Protein]}{dt}=\frac{c1[Glucose]+c2}{[Glucose]+c3}$$</p> | ||
Revision as of 12:26, 19 October 2016
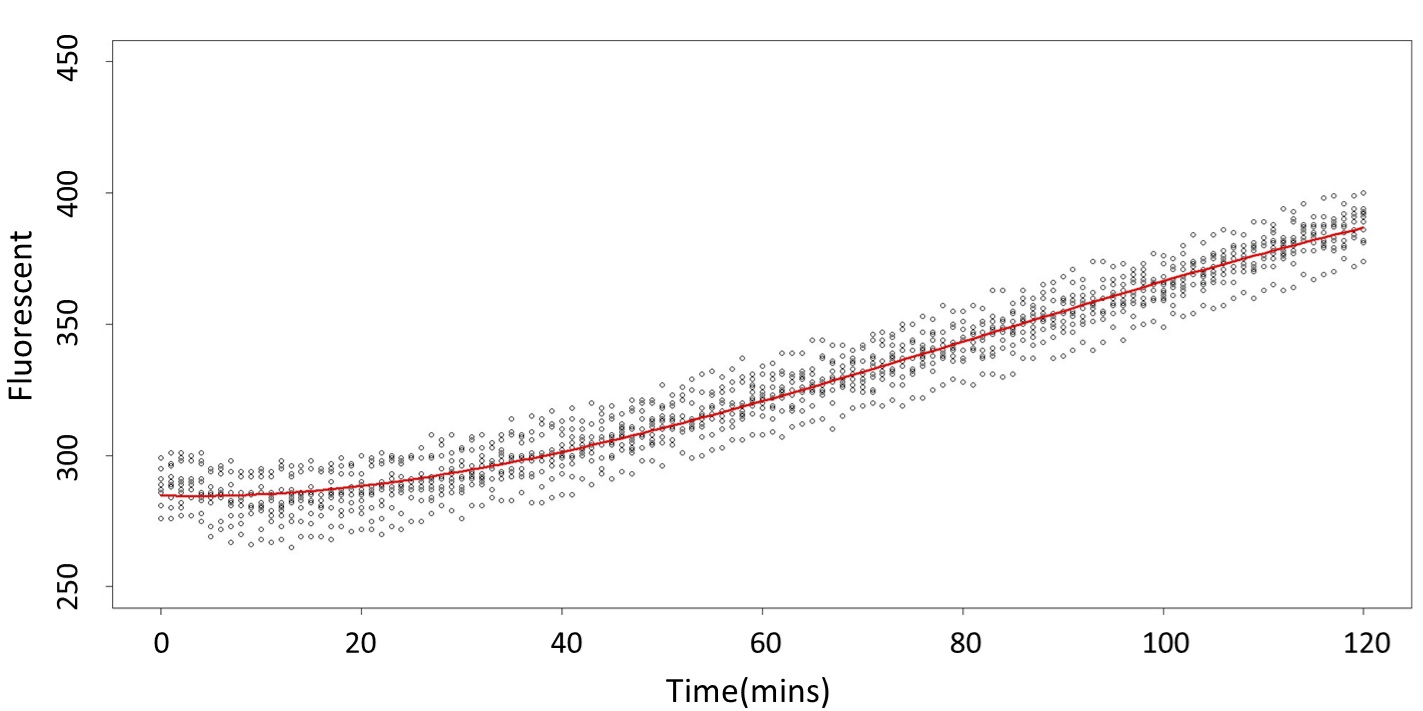
To analyze the data obtained from U. coli, we adopted two methods to estimate the glucose concentration efficiently and accurately. With the statistical method, the glucose can be differentiated from the user's urine in 2 hours. On the the hand, the theory-dependent fitting method is used to numerically analyze the urine glucose concentration in 6 hours.
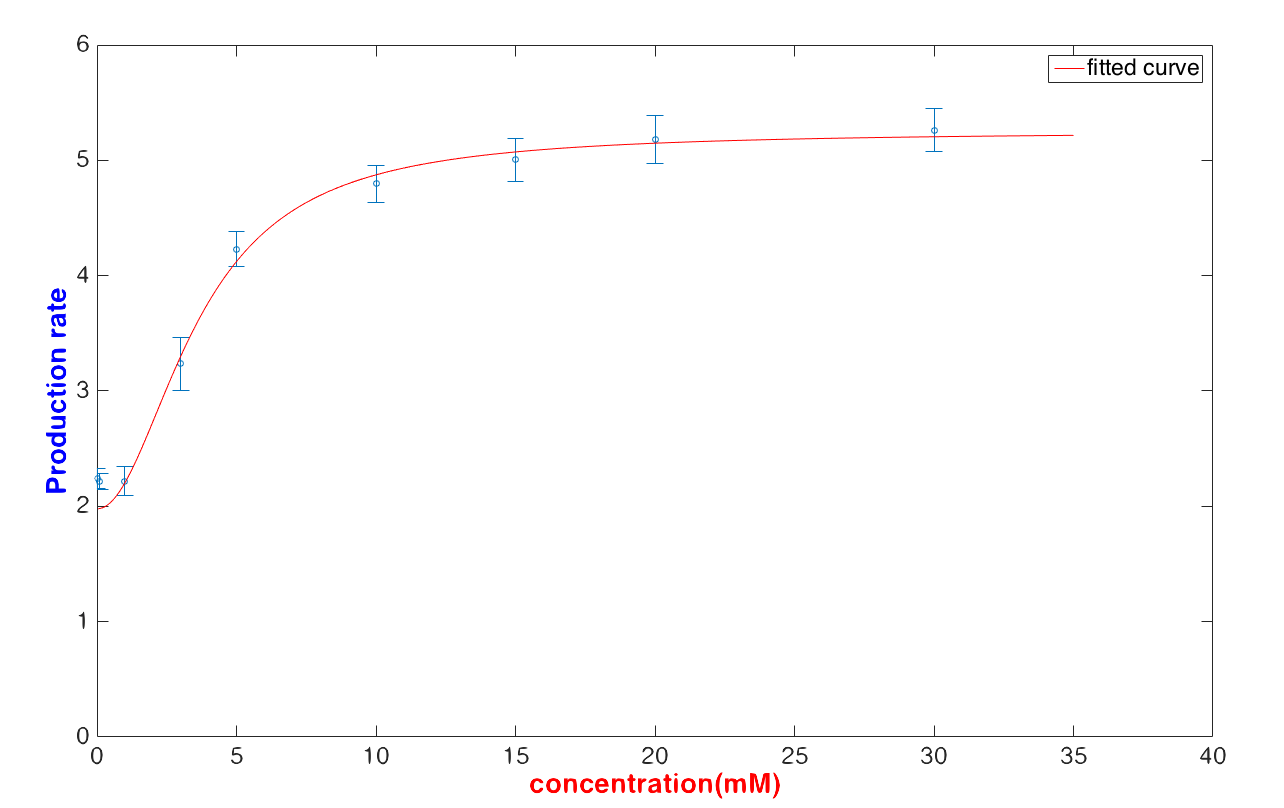
When all compounds reach its steady concentration, the production rate of protein should be a constant and be in form as the following equation:
$$\frac{[Protein]}{dt}=\frac{c1[Glucose]+c2}{[Glucose]+c3}$$
And the fitting result also show its accuracy and limitation:

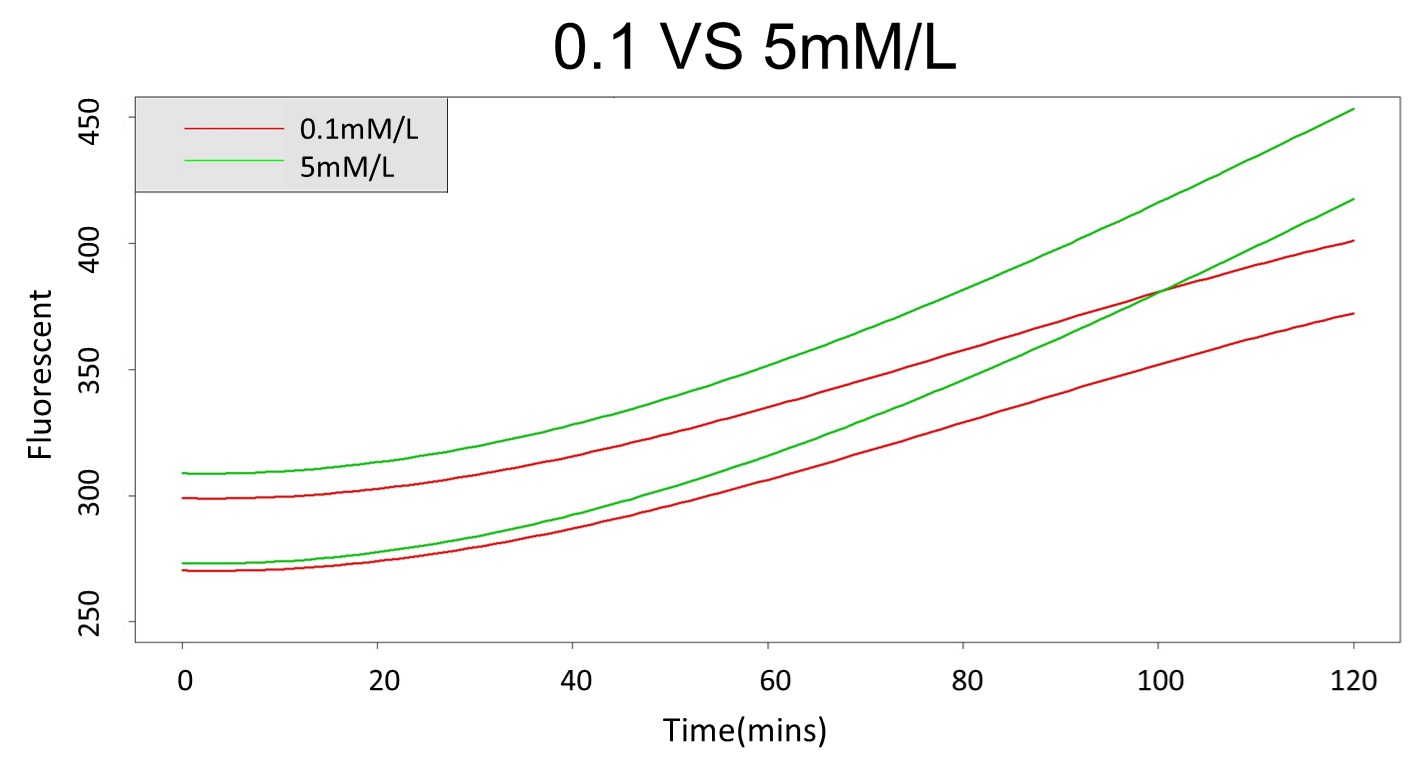
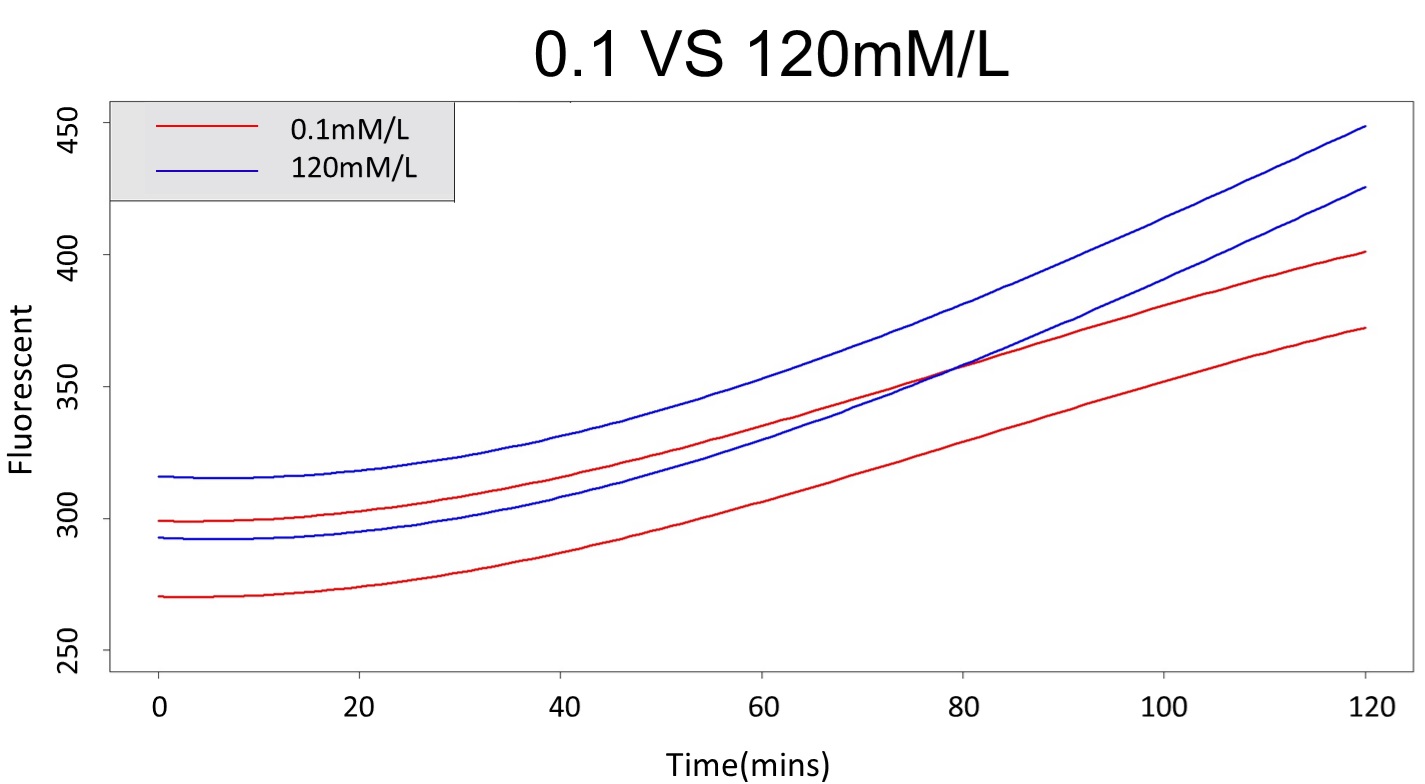
In medicine, when the presence of urine glucose exceeds 5mM/L, it implies pre-diabetes or diabetes. However, we refer to people whose urine glucose exceeds 120mM/L as sever diabetic patients. Consequently, finding the person whose urine glucose concentration is over 5mM/L or 120mM/L is our target for prevention and early detection.


First, we prove that there is a difference between 0.1mM/L and 5mM/L (120mM/L) in the paired-difference T test part. And, we use the regression and prediction intervals to distinguish exceeding 120mM/L and 5mM/L from exceeding 0.1mM/L. From the result, 5mM/L can be distinguished from 0.1mM/L after 101 minutes, and 120mM/L can be distinguished from 0.1mM/L after 88 minutes.

