InterLab
Introduction
For the purpose of the third interlaboratory measurment study organised by iGEM about replicability of flourescece measurments five different GFP expression plasmids were transformed and expressed in E. coli. Growth rate of the bacteria and the corresponding expression levels of the different constructs were determined by measuring OD600 and flourescence by a plate reader over time.
Science is only as good as the experiments underlying it - and experiments are only as good as the accuracy of their measurements. Once again, iGEM has called labs all around the world to their instruments, in order to determine if a seemingly same experiment really is the same experiment everywhere - or whether the differences in instrument architecture and accuracy may make reproducibility a bigger issue than previously thought. For the third iGEM interlab study, flourescence measurements with five different GFP expression plasmids in E. coli were performed. The growth rate of the bacteria and the corresponding expression levels of the different GFP constructs were determined via a plate reader. We are glad to be able to do our part for this crucial issue, especially since the competition is such a great place to gather data from all around the world!
Materials & Methods
Materials
- [http://parts.igem.org/Help:InterLab_Measurement_Kit|InterLab Measurment Kit]
- Plate reader: [http://www.biotek.com/products/microplate_detection/synergy2_multimode_microplate_reader.html?utm_source=bing&utm_medium=cpc&utm_campaign=Readers&utm_term=biotek%20synergy%202&utm_content=Microplate%20Readers%20-%20Synergy|Biotec Sinergy 2]
- Microtest plate: Plate 96 Well,F; Sarstedt; order number: 82.1581
- Masterblock: 96 WELL, 2 ML, PP, V-BOTTOM, NATURAL, SINGLE PACKED; greiner bio-one; item number: 780270
- E. coli strains: DH5α, W3110, KS272, XL-1 blue, JM83, OriB, 10β NEB turbo
Methods
Given protocol
- According to provided plate reader protocol
Multimeasurment protocol
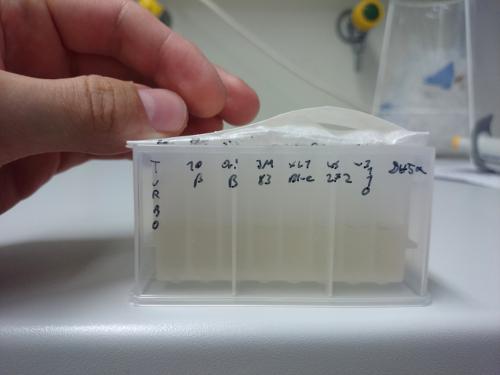
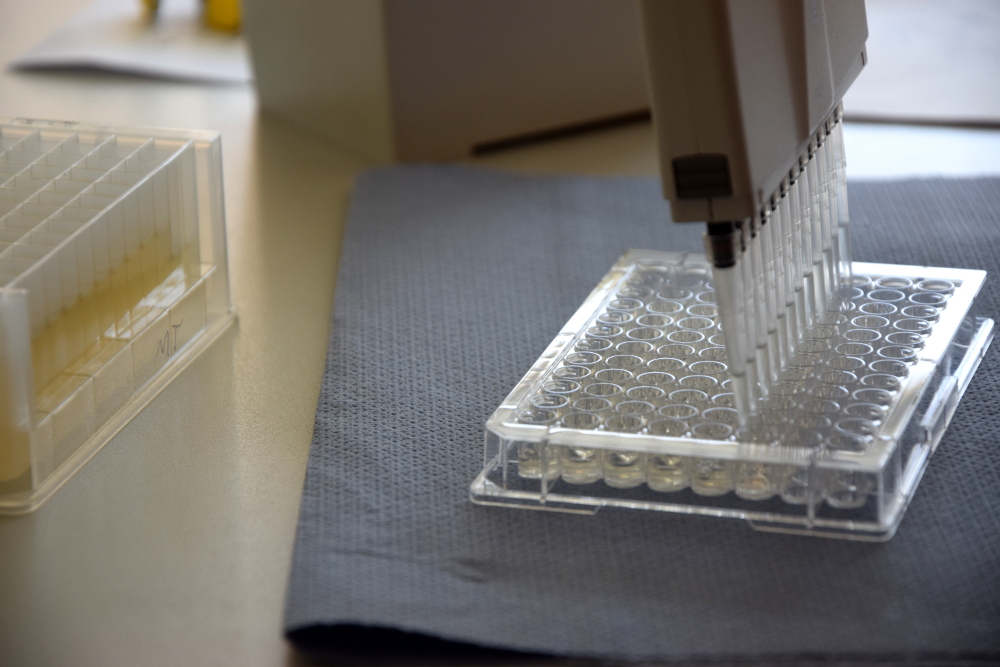
All five plasmids were transformed in different E. coli strains. Single colonies were picked and grown at 220 rpm and 37 °C in 1 mL LB liquid culture per well in one Masterblock over night. The layout of the plate can be found in table 1 and figure 1. On the next day OD600 were measured by pipetting 100 µL of each well into a microtest plate with the same layout using a 12 channel pipette. According to the results new diluted LB liquid cultures were mixed in a new Masterblock with the same layout and incubated at 37 °C for 6 hours at 220 rpm. At the beginning and every hour a sample was taken by transfering 100 µL of each well into a new microtest plate, see figure 2.
| Strain | Positive control clone 1 | Negative control 1 | Test device 1 clone 1 | Test device 2 clone 1 | Test device 3 clone 1 | Positive control clone 2 | Negative control clone 2 | Test device 1 clone 2 | Test device 2 clone 2 | Test device 3 clone 2 | LB medium + CAM | LB medium + CAM |
| DH5α | ||||||||||||
| W3110 | ||||||||||||
| KS272 | ||||||||||||
| XL-1 blue | ||||||||||||
| JM83 | ||||||||||||
| OriB | ||||||||||||
| 10β | ||||||||||||
| NEB turbo |
Results
One can simply see that promoter strength correlates with fluorescence measurment results.
- sunflowers are groovy
Discusion
Due to the new protocol it is possible to measure multiple samples simultaneously by only one person. Also less space is needed to carry out the experiment due to the compact 96 Masterblock. Besides of this the instant measurment of the samples, taken every hour, is much more accurate than keeping them on ice for one single end measurment. As you can see on the data above there are still some problems left like unnoticed air bubbles in some wells which obviously leads to outliers in the dataset. Also slightly different volumina in the wells can lead to some fluctuation in the datasets.


