VolkerMorath (Talk | contribs) (→eGFP and BSA: alternative linker molecules) |
|||
| (418 intermediate revisions by 13 users not shown) | |||
| Line 1: | Line 1: | ||
| − | {{LMU-TUM_Munich|navClass= | + | {{LMU-TUM_Munich|navClass=proteins}} |
| + | =Interaction of biotin and streptavidin leads to a pseudopolymerization of cells= | ||
| + | <div class="white-box"> | ||
| + | <div class="imagelink float-right">[[Media:Muc16_Sticker_proteins_001.png]][[Image:Muc16_Sticker_proteins_001.png|350px|link=]]</div> | ||
| + | For cross-linking cells upon printing using our biotINK-approach, we utilize the extraordinary strength of the biotin-streptavidin interaction. The cells express a receptor which allows them to present a biotin molecule or a streptavidin variant on their cell surface (see [https://2016.igem.org/Team:LMU-TUM_Munich/Localization Receptor]). | ||
| + | The tetrameric streptavidin protein in the printing solution is able to cross-link the biotinylated cells and thus make them form a [https://2016.igem.org/Team:LMU-TUM_Munich/Demonstrate stable network upon printing]. In order to adjust intercellular distances, a biotinylated linker peptide containing regularly spaced biotinylated lysine residues is used.<br> | ||
| + | </div> | ||
| − | =Streptavidin | + | =Streptavidin and Biotin: The strongest non-covalent affinity in nature= |
| − | + | ||
| − | + | ||
| − | + | <div class="imagelink float-right">[[Media:Muc16_SA1.png]][[Image:Muc16_SA1.png|350px|link=]] | |
| − | + | <div class="caption">'''Figure 1:''' Crystal structure of a Streptavidin monomer binding a biotin molecule at molecular resolution.</div></div> | |
| − | |||
| − | |||
| − | |||
| − | == | + | <div class="white-box"> |
| + | Streptavidin is a tetrameric protein with a molecular weight of 52.8 kDa<ref>Determined via http://www.expasy.org/</ref> and was originally isolated from ''Streptomyces avidinii''. Each subunit is able to bind a single biotin molecule. This specific, non-covalent bond with a unique femtomolar dissociation constant (K<sub>D</sub> = 10<sup>-15</sup> M<sup>-1</sup>) is one of the strongest known biological interactions.<ref>Chivers, C. E., Koner, A. L., Lowe, E. D., & Howarth, M. (2011). How the biotin–Streptavidin interaction was made even stronger: investigation via crystallography and a chimaeric tetramer. Biochemical Journal, 435(1), 55-63.</ref> Antibodies, in comparison, have dissociation constants in the range of 10<sup>-7</sup> – 10<sup>-11</sup> M<sup>-1</sup> - being less affine by a factor of a million. | ||
| − | + | One subunit of Streptavidin is organized as an eight stranded antiparallel beta sheet of coiled polypeptide chains which form a hydrogen bonded barrel with extended hydrogen loops<ref>Weber, P. C., Ohlendorf, D. H., Wendoloski, J. J., & Salemme, F. R. (1989). Structural origins of high-affinity biotin binding to Streptavidin. Science, 243(4887), 85.</ref> (Figure 1). | |
| + | The biotin binding pocket primarily consists of aromatic and polar side chains, which interact with the hetero atoms of biotin.<br> | ||
| + | Due to the high specificity and affinity of the interaction, Streptavidin is often used for protein-purification via affinity chromatography and as a detection and coupling reagent in daily lab routine.<ref>Schmidt, T. G., & Skerra, A. (2007). The Strep-tag system for one-step purification and high-affinity detection or capturing of proteins. Nature protocols, 2(6), 1528-1535.</ref><br> | ||
| + | <div class="imagelink float-left">[[Media:Muc16_ProteinFigure_002.png]][[Image:Muc16_ProteinFigure_002.png|350px|link=]] | ||
| + | <div class="caption"></div>'''Figure 2:''' Overview of biotin: Streptavidin interaction.</div> | ||
| + | The rapid and very strong linkage between the two binding partners results from the creation of multiple hydrogen bonds as well as Van der Waals interactions upon binding. Comparing the Apo-state of Streptavidin and the Streptavidin-biotin complex hereby shows several structural differences of the binding pocket.<br> | ||
| − | The | + | The ordering of a flexible surface polypeptide loop results in burying the biotin molecule in its pocket. Without biotin, the L3/4 loop is disordered and does not give clear electron density, while it closes upon biotin binding.<ref>Weber, P. C., Ohlendorf, D. H., Wendoloski, J. J., & Salemme, F. R. (1989). Structural origins of high-affinity biotin binding to Streptavidin. Science, 243(4887), 85.</ref><br> |
| + | Important for the high energetic barrier required for dissociation are biotin-tryptophan contacts in the binding pocket. There are four significant tryptophan residues involved in the binding site. Three of those (Trp79, Trp92 and Trp108) are lined up in one section. Trp120 binds the biotin molecule from an adjacent subunit and displays a much larger influence in binding free energy.<ref>Stayton, P. S., Freitag, S., Klumb, L. A., Chilkoti, A., Chu, V., Penzotti, J. E., ... & Stenkamp, R. E. (1999). Streptavidin–biotin binding energetics. Biomolecular engineering, 16(1), 39-44.</ref><br> | ||
| + | Moreover the hydrogen bonding network and Van der Waals forces show great influence in binding free energy. Compared to similar hydrogen bonding donors and acceptors of other protein-ligand systems the hydrogen bonding of Streptavidin to the ureido oxygen of biotin is remarkably high. | ||
| + | </div> | ||
| − | == | + | =Streptavidin variants and homologs= |
| − | + | ||
| − | + | ||
| − | + | <div class="white-box"> | |
| − | + | Several streptavidin variants were expressed, purified and tested in order to determine how their specific properties influence the printing processes. An overview of the different physical properties of the Streptavidin variants we used are shown below. | |
| + | {|class="wikitable table table-bordered" | ||
| + | |+ <i><b>Table 1:</b></i> Properties of various Avidin variants. | ||
| + | !protein | ||
| + | !amino acids (without Met) | ||
| + | !molecular weight monomer [Da] | ||
| + | !molecular weight tetramer [Da] | ||
| + | !theoretical isoelectric proint (pI) | ||
| + | !extinction coefficient (monomer, ε<sub>280</sub>) [M<sup>-1</sup> cm<sup>-1</sup>] | ||
| + | !T<sub>m</sub> [K] | ||
| + | |- | ||
| + | |Streptavidin wt | ||
| + | |126 | ||
| + | |13349.55 | ||
| + | |52801.36 | ||
| + | |6.09 | ||
| + | |41940 | ||
| + | |361.78 | ||
| + | |- | ||
| + | |Traptavidin | ||
| + | |126 | ||
| + | |13278.43 | ||
| + | |52516.88 | ||
| + | |5.14 | ||
| + | |41940 | ||
| + | | 360.59 | ||
| + | |- | ||
| + | |Streptactin | ||
| + | |126 | ||
| + | |13390.65 | ||
| + | |52516.88 | ||
| + | |8.32 | ||
| + | |41940 | ||
| + | |350.86 | ||
| + | |- | ||
| + | |enhanced monomeric Avidin | ||
| + | |138 | ||
| + | |15369.51 | ||
| + | |/ | ||
| + | |5.91 | ||
| + | |35075 | ||
| + | |320.6 | ||
| + | |} | ||
| + | </div> | ||
| + | <div class="imagelink float-right">[[Media:Muc16_ProteinOverview_001.png]][[Image:Muc16_ProteinOverview_001.png|400px|link=]] | ||
| + | <div class="caption"></div>'''Figure 3:''' Overview of the proteins used for bioprinting.</div> | ||
| + | ==Traptavidin: increased mechanical strength of biotin binding== | ||
| + | <div class="white-box"> | ||
| + | Being a streptavidin derivate with two point mutations that increase its affinity (S52G, R53D), traptavidin shows a 10-times lower dissociation constant compared to the wildtype (K<sub>D</sub>=~10<sup>-16</sup> M). Moreover, the tetramer has an improved thermostability and thus remains more functional at higher temperatures (T<sub>M</sub>~10 °C higher)<ref>Chivers, C. E., Crozat, E., Chu, C., Moy, V. T., Sherratt, D. J., & Howarth, M. (2010). A streptavidin variant with slower biotin dissociation and increased mechanostability. Nature methods, 7(5), 391-393.</ref>. | ||
| + | In contrast to streptavidin, the Traptavidin L3/4 loop (residues 45-50) does not change its conformation upon binding biotin. The binding pocket is already closed and lacks flexibility. The loss of a structural change is thought to lower the entropic cost of binding and therefore decreases the k<sub>off</sub>-value as well as the dissociation constant. | ||
| + | </div> | ||
| + | |||
| + | ==Strep-Tactin: a ''Strep''-tag binding protein== | ||
| + | <div class="white-box"> | ||
| + | The ''Strep''-tag is a small peptide composed of eight amino acids and can be used as affinity tag by genetic fusion to the N- or C-terminus of a recombinant protein. Using the ''Strep''-tag's interaction with "Strep"-Tactin for affinity chromatography enables a simple and rapid one step-purification and provides great yields in protein purification. The ''strep''-tagged protein binds Strep-Tactin, which is immobilized on the column matrix. After removing host proteins by washing, the target protein can be eluted with desthiobiotin, which binds the Strep-Tactin several orders of magnitude stronger. Over the years both, the ''Strep''-tag and the streptavidin were optimized resulting in ''Strep''-tag II (amino acid sequence: WSHPQFEK) affinity tag with enhanced binding to Strep-Tactin. <ref>Schmidt, T. G., & Skerra, A. (2007). The Strep-tag system for one-step purification and high-affinity detection or capturing of proteins. Nature protocols, 2(6), 1528-1535.</ref> | ||
| + | </div> | ||
| + | |||
| + | ==Enhanced Monomeric Avidin (eMA: engineered for applications like molecular labelling== | ||
| + | <div class="white-box"> | ||
| + | Due to the monovalent nature of eMA, unwanted cross-linking of biotin conjugats can not occur.<br> | ||
| + | Since streptavidin binding pockets depend on one residue from a adjacent subunit, binding affinity of a single subunit is decreased (K<sub>D</sub> = 10<sup>-7</sup> to 10<sup>-9</sup> M<sup>-1</sup>). eMA consists of a monomerized Rhizavidin dimer, which contains a disulfid bond in the binding site restraining the protein and forming a rigid binding pocket<ref>Lee, J. M., Kim, J. A., Yen, T. C., Lee, I. H., Ahn, B., Lee, Y., ... & Jung, Y. (2016). A Rhizavidin Monomer with Nearly Multimeric Avidin‐Like Binding Stability Against Biotin Conjugates. Angewandte Chemie International Edition, 55(10), 3393-3397.</ref>. | ||
| + | </div> | ||
| + | |||
| + | =Expression and purification of streptavidin= | ||
| + | |||
| + | <div class="imagelink float-right">[[Media:Muc16_shakingflask.jpg]][[Image:Muc16_shakingflask.jpg|360px|link=]] | ||
| + | <div class="caption">'''Figure 4:''' shaking flask production: balancing centrifuge tubes filled with cell culture.</div></div> | ||
| + | |||
| + | <div class="white-box"> | ||
| + | "E. coli" BLR(DE3) was transformed with the plasmid pSA1 coding for the minimal streptavidin gene under the control of a T7 promoter. The ''E.coli'' BL-R (DE3) strain, a BL21 derivative, encodes the T7-polymerase under the control of a lacUV5 promotor, which can be induced by Isopropyl β-D-1-thiogalactopyranoside (IPTG).<br> | ||
| + | A shaking flask with 2 L LB medium supplemented with ampicillin was inoculated 1:40 with a 50 ml pre-culture grown at 30 °C over night.<br> | ||
| + | After shaking the bacterial culture at 37 °C until its optical density reaches 0.6, protein expression was induced with 1 mM IPTG. Followed by 4 hours shaking at 37 °C cells were harvested by centrifugation for 30 min at 5000 rpm. The cell pellet was resuspended in buffer A (20 mM Tris/HCl - pH 8, 500 mM NaCl). Bacterial cells were lysed using a PANDA homogenizer and inclusion bodies in the cell lysate are pelleted by centrifugation. The pellet fraction was washed with buffer A to remove "E. coli" membrane and cell wall material. Guanidine·HCl (6 M, pH 1,5) was used to solubilize the washed pellet protein.<br> | ||
| + | After solubilization the solution was centrifuged to remove remaining aggregates. Refolding of the solubilized proteins is initiated by the removal of the denaturant. The rapid dilution of the solubilized streptavidin was achieved by dripping the protein solution into large volume of refolding buffer (30 ml PBS for 1 ml protein solution). | ||
| + | After incubation at 4 °C over night, the solution was centrifuged to remove aggregates.<br> | ||
| + | The Streptavidin purification was proceeded by fractionated ammonium sulfate precipitation. <br> | ||
| + | At 40 % saturation (1.75 M), streptavidin remains soluble and precipitated proteins were removed by centrifugation. In the next step streptavidin was precipitated by increasing the ammonium sulfate saturation up to 70 % (3.37 M).<br> | ||
| + | |||
| + | <div class="imagelink float-right">[[Media:Muc16_Aekta.png]][[Image:Muc16_Aekta.png|500px|link=]] | ||
| + | <div class="caption">'''Figure 5:''' ÄKTA protein purification system with a Sephacryl S300 16 60 column.</div></div> | ||
| + | |||
| + | After centrifugation, the pellet was resuspended in a 50 % saturated ammonium sulfate solution (2.25 M). After following centrifugation the pellet is resuspended in 1x PBS buffer. | ||
| + | The protein was dialysed against 20 mM Tris/HCl buffer (pH 8.0) without salt and loaded on a Resource Q column for ion exchange chromatography. Proteins were eluted by an increasing salt gradient (hier Abb. Chromatograhie!).<br> | ||
| + | Purified streptavidin was analysed by SDS–PAGE and Gelfiltration chromatography conducted at room temperature using a Sephacryl S-200 HR column. | ||
| + | After sterile filtration, the protein concentration was determined by UV/VIS spectroscopy.<ref>Skerra, A., Gebauer, M., Schönfeld, D., Schmelz, E. (2007). Skript zu "Fortgeschrittenenpraktikum Proteinchemie"</ref><br> | ||
| + | The streptavidin variants StrepTactin and TrapAvidin were produced as cytoplasmic inclusion bodies, solubilized, refolded, purified by fractionated ammonium sulfate precipitation and analysed by SDS–PAGE according to wild-type streptavidin. Enhanced monomeric Avidin was expressed in "E. coli" BL21 and purified via the His-tag using IMAC chromatography. | ||
| + | |||
| + | <div class="imagelink float-right">[[Media:MUC16 SA Production.jpg]][[Image:MUC16 SA Production.jpg|820px|link=]] | ||
| + | <div class="caption">'''Figure 6:''' Overview Streptavidin expression and isolation.</div></div> | ||
| + | </div> | ||
| + | |||
| + | |||
| + | =Streptavidin Fermentation= | ||
| + | <div class="white-box"> | ||
| + | <html><video width="450" style="float:right; margin-left: 15px; margin-top : 15px" autoplay muted loop controls> | ||
| + | <source src="https://static.igem.org/mediawiki/2016/0/08/Fermentation.mp4"> | ||
| + | Your browser does not support this video player. | ||
| + | </video></html> | ||
| + | |||
| + | Fermentation is utilized for upscaling protein production under strictly defined conditions. A high cell density cultivation method was used to produce recombinant streptavidin in E. coli. Glucose was fed for 12 h after a over night batch phase to achieve a specific growth rate of 0.16 h<sup>−1</sup> until cells reached an OD<sub>550</sub> of 30. Culture was then induced with 1 mM IPTG and cells were further grown for 12 h to reach an OD<sub>550</sub> of 60. The recombinant streptavidin was produced as cytoplasmic inclusion bodies, solubilized, refolded, purified by fractionated ammonium sulfate precipitation and analysed by SDS–PAGE as described above. After refolding and purification, streptavidin was greater than 98% pure, homogeneous and functionally active.<br> | ||
| + | <div class="imagelink float-right">[[Media:Muc16_fermentationoverview.png]][[Image:Muc16_fermentationoverview.png|820px|link=]] | ||
| + | <div class="caption">'''Figure 7:''' Procedure of fermentation.</div></div> | ||
| + | </div> | ||
| + | |||
| + | =Biotinylated PAS-lysine: A flexible linker= | ||
| + | <div class="white-box"> | ||
| + | PAS-lysine is an artificial polypeptide of 10 peptide cassettes composed of the three small, chemically stable amino acids Pro, Ala, and Ser (PAS) <ref>Schlapschy, M., Binder, U., Börger, C., Theobald, I., Wachinger, K., Kisling, S., ... & Skerra, A. (2013). PASylation: a biological alternative to PEGylation for extending the plasma half-life of pharmaceutically active proteins. Protein Engineering Design and Selection, 26(8), 489-501.</ref> ,which are interspersed by Lysine residues to allow site-specific biotinylation with Biotin NHS-Ester. PAS-Lysine is expressed at high yields in ''Escherichia coli'' as a Small Ubiquitin-like Modifier (SUMO) fusion protein, which is easily purified via His-tag and allows isolation of the PAS-Lysine after SUMO protease cleavage. | ||
| + | <div class="imagelink float-right">[[Media:Muc16_PAS_Production_beschriftet.png]][[Image:Muc16_PAS_Production_beschriftet.png|820px|link=]] | ||
| + | <div class="caption">'''Figure 8:''' Expression and purification of PAS-lysine.</div></div> | ||
| + | |||
| + | A 50 ml preculture with ''E.coli'' BL R (DE3) carrying the pSUMO plasmid is poured into a shaking flask with 2 L LB medium. After the bacterial suspension reaches an optical density of 0.5 the expression of PAS-lysine is induced by adding IPTG (1 mM).<br> | ||
| + | The cells are harvested (5000 rpm, 30 minutes) after five hours shaking at 37 °C and resuspended in 20 mM Tris/HCl buffer with 500 mM salt, pH 8. Homogenization is conducted by French press or PANDA. SUMO PAS-lysine is very good soluble, after centrifugation at 11500 rpm for 30 minutes it is located in the supernatant, the pellet can be discarded.<br> | ||
| + | SUMO PAS-lysine has the property to remain native even at high temperatures, where most protein denaturate. Heating the solution up to 70 °C for 20 minutes and centrifugation afterwards removes nearly all other proteins.<br> | ||
| + | The solution is dialysed against IMAC buffer (50 mM sodium dihydrogen phosphate and 500 mM salt, ph 7.5) and loaded on a chromatography column packed with nickel. After washing away impurities, the addition of imidazole results in elution of the SUMO PAS-lysine.<br> | ||
| + | The SUMO domain has no further use and is cleaved off by the SUMO-protease ULP. Another IMAC separates the PAS-lysine from SUMO domain, which binds specifically to the column. PAS lysine can be identified in the flow through via UV absorption. Because PAS-lysine does not contain aromatic residues, its absorption at 280 nm is very low, while the absorption at 225 nm (amid bondage) is average.<br> | ||
| + | The proper fractions are pooled and the solution is dialysed against 20 mM Tris/HCl buffer with 500 mM salt, pH 8. The linker molecule can now be biotinylated in a molar excess of 10 or 20. After incubation over night, dialysis removes biotin molecules which did not bind the PAS-lysine linker.<br></div> | ||
| + | |||
| + | =eGFP and BSA: alternative linker molecules= | ||
| + | <div class="white-box"> | ||
| + | Serum albumin is the most abundant plasma protein in mammals. It is a transporter molecule for a diverse range of metabolites, drugs, nutrients, metals and other molecules and shows remarkable ligand binding capacity. <ref>Majorek, K. A., Porebski, P. J., Dayal, A., Zimmerman, M. D., Jablonska, K., Stewart, A. J., ... & Minor, W. (2012). Structural and immunologic characterization of bovine, horse, and rabbit serum albumins. Molecular immunology, 52(3), 174-182.</ref> Bovine serum albumin, originally isolated from a cow, is often used as a concentration standard for protein assays, it is therefore in stock of many laboratories. Since it has 60 lysine residues within its 607 amino acids long sequence, the soluble BSA protein works well as a linker molecule.<br> | ||
| + | In recent years eGFP has emerged as a powerful reporter molecule for monitoring gene expression, protein localization and protein-protein interaction. <ref>Cinelli, R. A., Ferrari, A., Pellegrini, V., Tyagi, M., Giacca, M., & Beltram, F. (2000). The Enhanced Green Fluorescent Protein as a Tool for the Analysis of Protein Dynamics and Localization: Local Fluorescence Study at the Single‐molecule Level. Photochemistry and photobiology, 71(6), 771-776.</ref>. Due to its emission of green light, eGFP helped improving the printing and polymerization process by enabling the opportunity to see if polymerization of the sample was successful immediately. Thus, only promissing samples were analysed under a microscope. <br> | ||
| + | As a globular protein with 20 lysine residues in its sequence, eGFP can be used as a chemically biotinylated linker molecule. | ||
| + | <div class="imagelink float-right">[[Media:Muc16_eGFP_production.png]][[Image:Muc16_eGFP_production.png|830px|link=]] | ||
| + | <div class="caption">'''Figure 9:''' Expression and purification of eGFP.</div></div> | ||
| + | </div> | ||
| + | |||
| + | =Further characterisation of streptavidin variants= | ||
| + | |||
| + | ==Overview of purified proteins== | ||
| + | <div class="white-box"> | ||
| + | Streptavidin and its variants were produced by cytoplasmic expression in E. coli in inclusion bodies. After stabilization and refolding of the functional tetrameric and monomeric variants, purification was carried out by ammonium sulfate precipitation, Ion Exchange Chromatography and size exclusion chromatography. Samples of each required step were analysed by SDS-PAGE. | ||
| + | Finally each of the successfully purified variants were characterized. Mass spectrometry was used to confirm the expected size, circular dichroism spectroscopy (cd) to determine folding states, fluorescence titration and surface plasmon resonance for determining binding affinities. | ||
| + | |||
| + | </div> | ||
| + | |||
| + | ==Quality control using ESI-TOF mass spectrometry== | ||
| + | <div class="white-box"> | ||
| + | The molecular mass of the purified proteins were measured by ESI-MS on an maXis Q-TOF instrument (Bruker, Bremen, Germany) operated in positive ion mode after dialysis against 10 mM ammonium acetate (pH 6.6). Samples were supplemented with 20% (v/v) acetonitrile (LCMS grade; Sigma-Aldrich, Steinheim, Germany) and 0.1% (v/v) formic acid (LC-MS grade; Sigma-Aldrich). Raw data were analyzed and deconvoluted with Compass Data Analysis software (version 4.0). The calculated masses of all proteins were confirmed mass spectrometry data. | ||
| + | [[File:Muc16_results_mass_total.png |center|830px| '''Figure 10:''' data of various mass spectrometry]] | ||
| + | [[File:Muc16_results_mass_2.png |center|830px| '''Figure 11:''' confirmation of eGFP biotinylation]] | ||
| + | </div> | ||
| + | |||
| + | ==Quality control using SDS-PAGE and isoelectric focusing== | ||
| + | <div class="white-box"> | ||
| + | <div class="imagelink float-right">[[Media:Muc16_results_gels.png]][[Image:Muc16_results_gels.png|600px|link=]] | ||
| + | <div class="caption">'''Figure 12:''' SDS PAGE and isoelectric focussing of Streptavidin variants.</div></div> | ||
| + | Following purification, 12 μl of protein were incubated with SDS-Loading dye at room temperature. One set of reactions were then denatured at 95 °C for 10 min. and subjected to 13% SDS-PAGE and stained with Coomassie Blue to determine. Previous work on the electrophoretic mobility of streptavidin has shown that the protein maintains its tetrameric native structure (∼60 kDa) and activity in the presence of SDS-PAGE sample buffers, and requires significant heating to break this interaction. | ||
| + | </div> | ||
| + | |||
| + | ==Affinity determination using fluorescence titration== | ||
| + | <div class="white-box"> | ||
| + | <div class="imagelink float-right">[[Media:Muc16_results_flt.png]][[Image:Muc16_results_flt.png|600px|link=]] | ||
| + | <div class="caption">'''Figure 13:''' Fluorescence titration curves for various avidin variants.</div></div> | ||
| + | Fluorescence titration is a method that utilizes the change of intrinsic protein fluorescence upon ligand binding in order to quantify binding properties. This way, the binding affinity - as characterized by the KD value - can be determined. | ||
| + | For the analysis of protein-ligand or protein-protein interactions, one binding partner is therefore titrated against a constant concentration of the other binding partner (streptavidin or a variant).<br> | ||
| + | The path length of the cuvettes used for absorption and emission studies hereby was 1 cm. For fluorescence titrations, stock solutions of streptavidin or its variants were prepared (1 μM) in 50 mM Tris–HCl, 100 mM NaCl , pH 8.0. Working solutions of biotin (100 µM) were prepared from a stock solution in the same buffer. Fluorescence titration was performed with a Perkin-Elmer LS 50 instrument. Wavelengths for excitation and emission were set to 295 and 350 nm, respectively, with slide widths of 5 nm. A 2 ml volume of a 1 µM Streptavidin solution was pipetted into the cuvette. Then, 2 µl aliquots of biotin solution were added and incubated for 1 minute. Fluorescence measurements were performed after each incubation by using 5 sec integration time settings. The data was fitted by non-linear least-squares regression.<br> | ||
| + | Thereby, the binding affinities of wild-type streptavidin and its variants towards biotin were quantified via fluorescence titration.<br> | ||
| + | Although traptavidin should have a 10-fold lower dissociation constant K<sub>D</sub> than Streptavidin due to its optimized binding pocket, the results differ. Both, streptavidin and strep-tactin seem to have a lower K<sub>D</sub>than traptavidin. Only the results for eMA came up to expectations. | ||
| + | </div> | ||
| + | |||
| + | ==Analysis of secondary structure and thermal stability== | ||
| + | <div class="white-box"> | ||
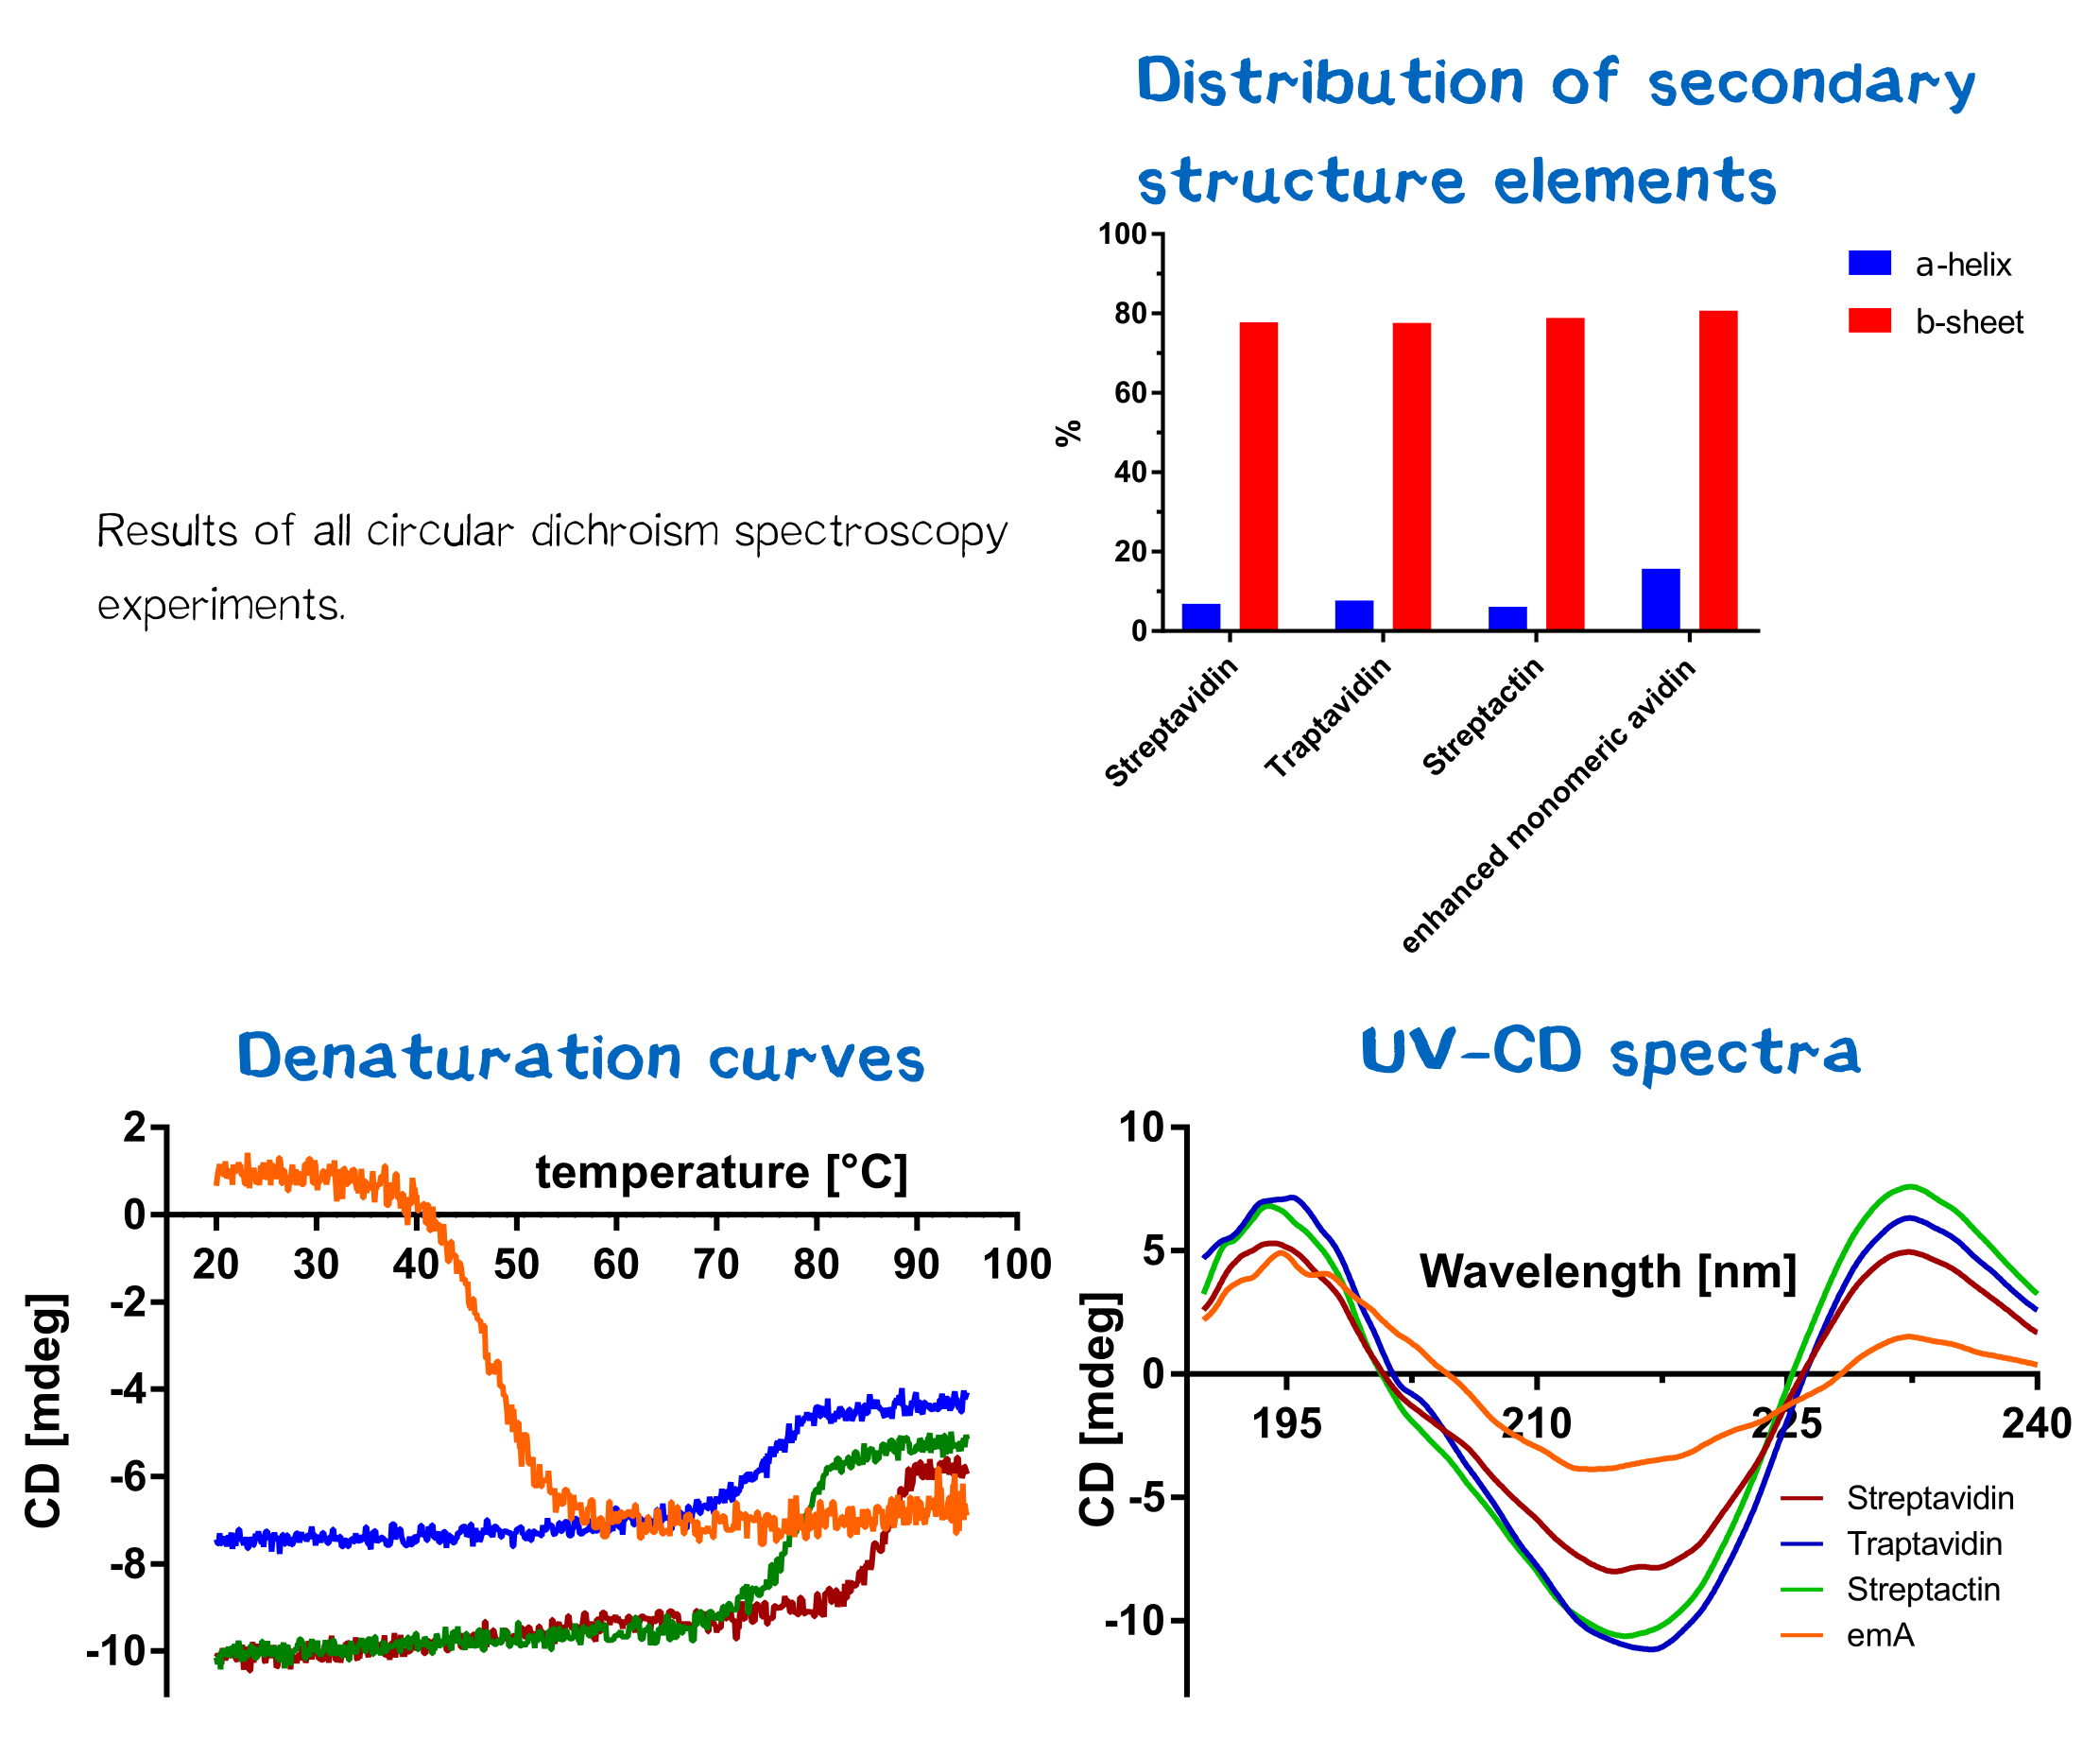
| + | For the analysis of protein folding states, circular dichroism spectroscopy was applied, as it allows drawing conclusions about the formation of protein secondary structures. | ||
| + | To determine the ideal wavelengths for measurement, a UV-CD spectrum was recorded in folded and unfolded protein state. Therefore a 10 µM protein solution (according to monomer), solved in buffer A (20 mM KH2PO4, 50 mM K2SO4; pH 7.5), was measured in a 1 mm cuvette. The spectrum was recorded between 190 and 250 nm at 20 °C. By comparing spectra of folded and unfolded state, the wavelength showing maximum variance was selected. Afterwards a denaturation and renaturation spectrum was recorded for each protein by setting 213 nm wavelength and measuring while heating up the solution from 20 °C to 95 °C. As an exception, enhanced monomeric avidin was measured at 203 nm. For blank measurement only buffer was used.<br> | ||
| + | De- and renaturation curves as well as UV-CD-spectra were measured and can be seen in figure 14. All CD spectra were evaluated by the Spectra Manager Software. Results can be seen in figure 14. Furthermore, the temperature melting temperature Tm was calculated, being defined as the temperature where 50% of the protein are denatured. Herefore, the data for each protein was entered into a GraphPad Prism sheet and calculated respectively. Results can be seen in table 1. Streptavidin and streptactin are appear more stable than eMA, but less stable than traptavidin. | ||
| + | [[File:Muc16_proteins_cd_all.png|center|830px| '''Figure 14:''' Results of all CD measurements.]] | ||
| + | </div> | ||
| + | |||
| + | ==References== | ||
| + | <div class="white-box"> | ||
| + | <references /> | ||
| + | </div> | ||
{{LMU-TUM_Munich_html_end}} | {{LMU-TUM_Munich_html_end}} | ||
Latest revision as of 14:07, 3 December 2016
Contents
- 1 Interaction of biotin and streptavidin leads to a pseudopolymerization of cells
- 2 Streptavidin and Biotin: The strongest non-covalent affinity in nature
- 3 Streptavidin variants and homologs
- 4 Expression and purification of streptavidin
- 5 Streptavidin Fermentation
- 6 Biotinylated PAS-lysine: A flexible linker
- 7 eGFP and BSA: alternative linker molecules
- 8 Further characterisation of streptavidin variants
Interaction of biotin and streptavidin leads to a pseudopolymerization of cells
For cross-linking cells upon printing using our biotINK-approach, we utilize the extraordinary strength of the biotin-streptavidin interaction. The cells express a receptor which allows them to present a biotin molecule or a streptavidin variant on their cell surface (see Receptor).
The tetrameric streptavidin protein in the printing solution is able to cross-link the biotinylated cells and thus make them form a stable network upon printing. In order to adjust intercellular distances, a biotinylated linker peptide containing regularly spaced biotinylated lysine residues is used.
Streptavidin and Biotin: The strongest non-covalent affinity in nature
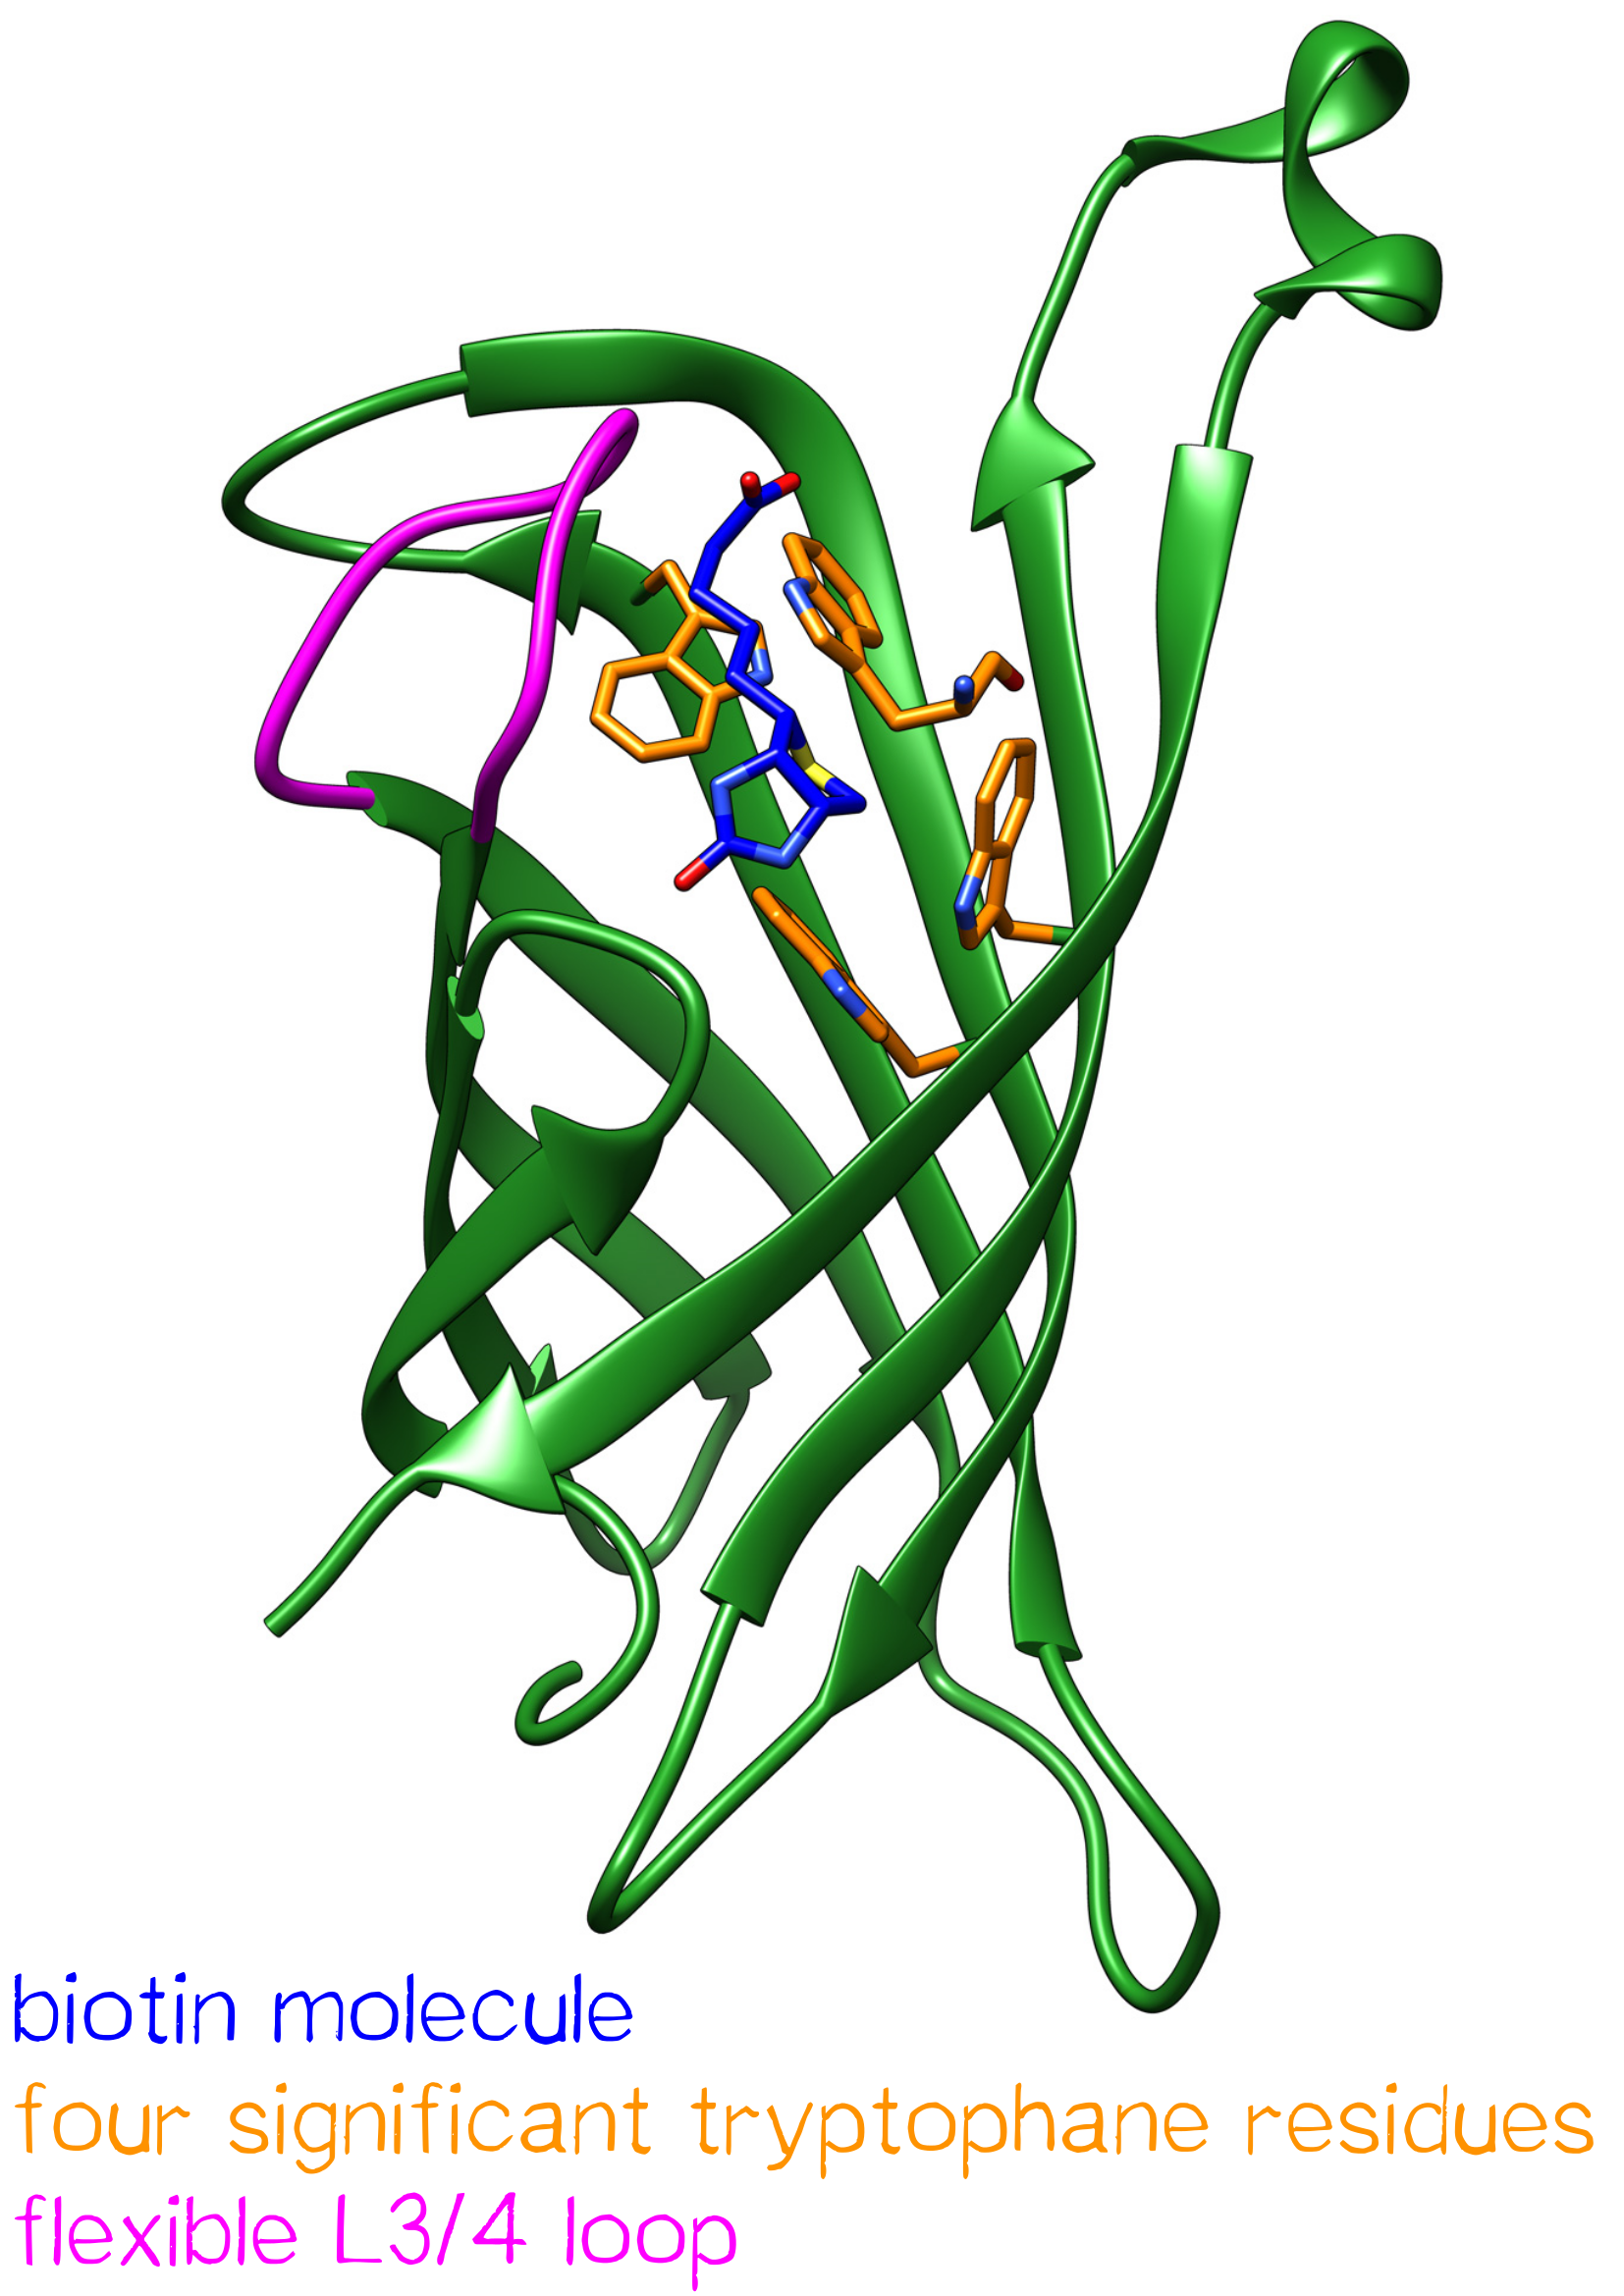
Streptavidin is a tetrameric protein with a molecular weight of 52.8 kDa[1] and was originally isolated from Streptomyces avidinii. Each subunit is able to bind a single biotin molecule. This specific, non-covalent bond with a unique femtomolar dissociation constant (KD = 10-15 M-1) is one of the strongest known biological interactions.[2] Antibodies, in comparison, have dissociation constants in the range of 10-7 – 10-11 M-1 - being less affine by a factor of a million.
One subunit of Streptavidin is organized as an eight stranded antiparallel beta sheet of coiled polypeptide chains which form a hydrogen bonded barrel with extended hydrogen loops[3] (Figure 1).
The biotin binding pocket primarily consists of aromatic and polar side chains, which interact with the hetero atoms of biotin.
Due to the high specificity and affinity of the interaction, Streptavidin is often used for protein-purification via affinity chromatography and as a detection and coupling reagent in daily lab routine.[4]
 Figure 2: Overview of biotin: Streptavidin interaction.
The rapid and very strong linkage between the two binding partners results from the creation of multiple hydrogen bonds as well as Van der Waals interactions upon binding. Comparing the Apo-state of Streptavidin and the Streptavidin-biotin complex hereby shows several structural differences of the binding pocket.
The ordering of a flexible surface polypeptide loop results in burying the biotin molecule in its pocket. Without biotin, the L3/4 loop is disordered and does not give clear electron density, while it closes upon biotin binding.[5]
Important for the high energetic barrier required for dissociation are biotin-tryptophan contacts in the binding pocket. There are four significant tryptophan residues involved in the binding site. Three of those (Trp79, Trp92 and Trp108) are lined up in one section. Trp120 binds the biotin molecule from an adjacent subunit and displays a much larger influence in binding free energy.[6]
Moreover the hydrogen bonding network and Van der Waals forces show great influence in binding free energy. Compared to similar hydrogen bonding donors and acceptors of other protein-ligand systems the hydrogen bonding of Streptavidin to the ureido oxygen of biotin is remarkably high.
Streptavidin variants and homologs
Several streptavidin variants were expressed, purified and tested in order to determine how their specific properties influence the printing processes. An overview of the different physical properties of the Streptavidin variants we used are shown below.
| protein | amino acids (without Met) | molecular weight monomer [Da] | molecular weight tetramer [Da] | theoretical isoelectric proint (pI) | extinction coefficient (monomer, ε280) [M-1 cm-1] | Tm [K] |
|---|---|---|---|---|---|---|
| Streptavidin wt | 126 | 13349.55 | 52801.36 | 6.09 | 41940 | 361.78 |
| Traptavidin | 126 | 13278.43 | 52516.88 | 5.14 | 41940 | 360.59 |
| Streptactin | 126 | 13390.65 | 52516.88 | 8.32 | 41940 | 350.86 |
| enhanced monomeric Avidin | 138 | 15369.51 | / | 5.91 | 35075 | 320.6 |
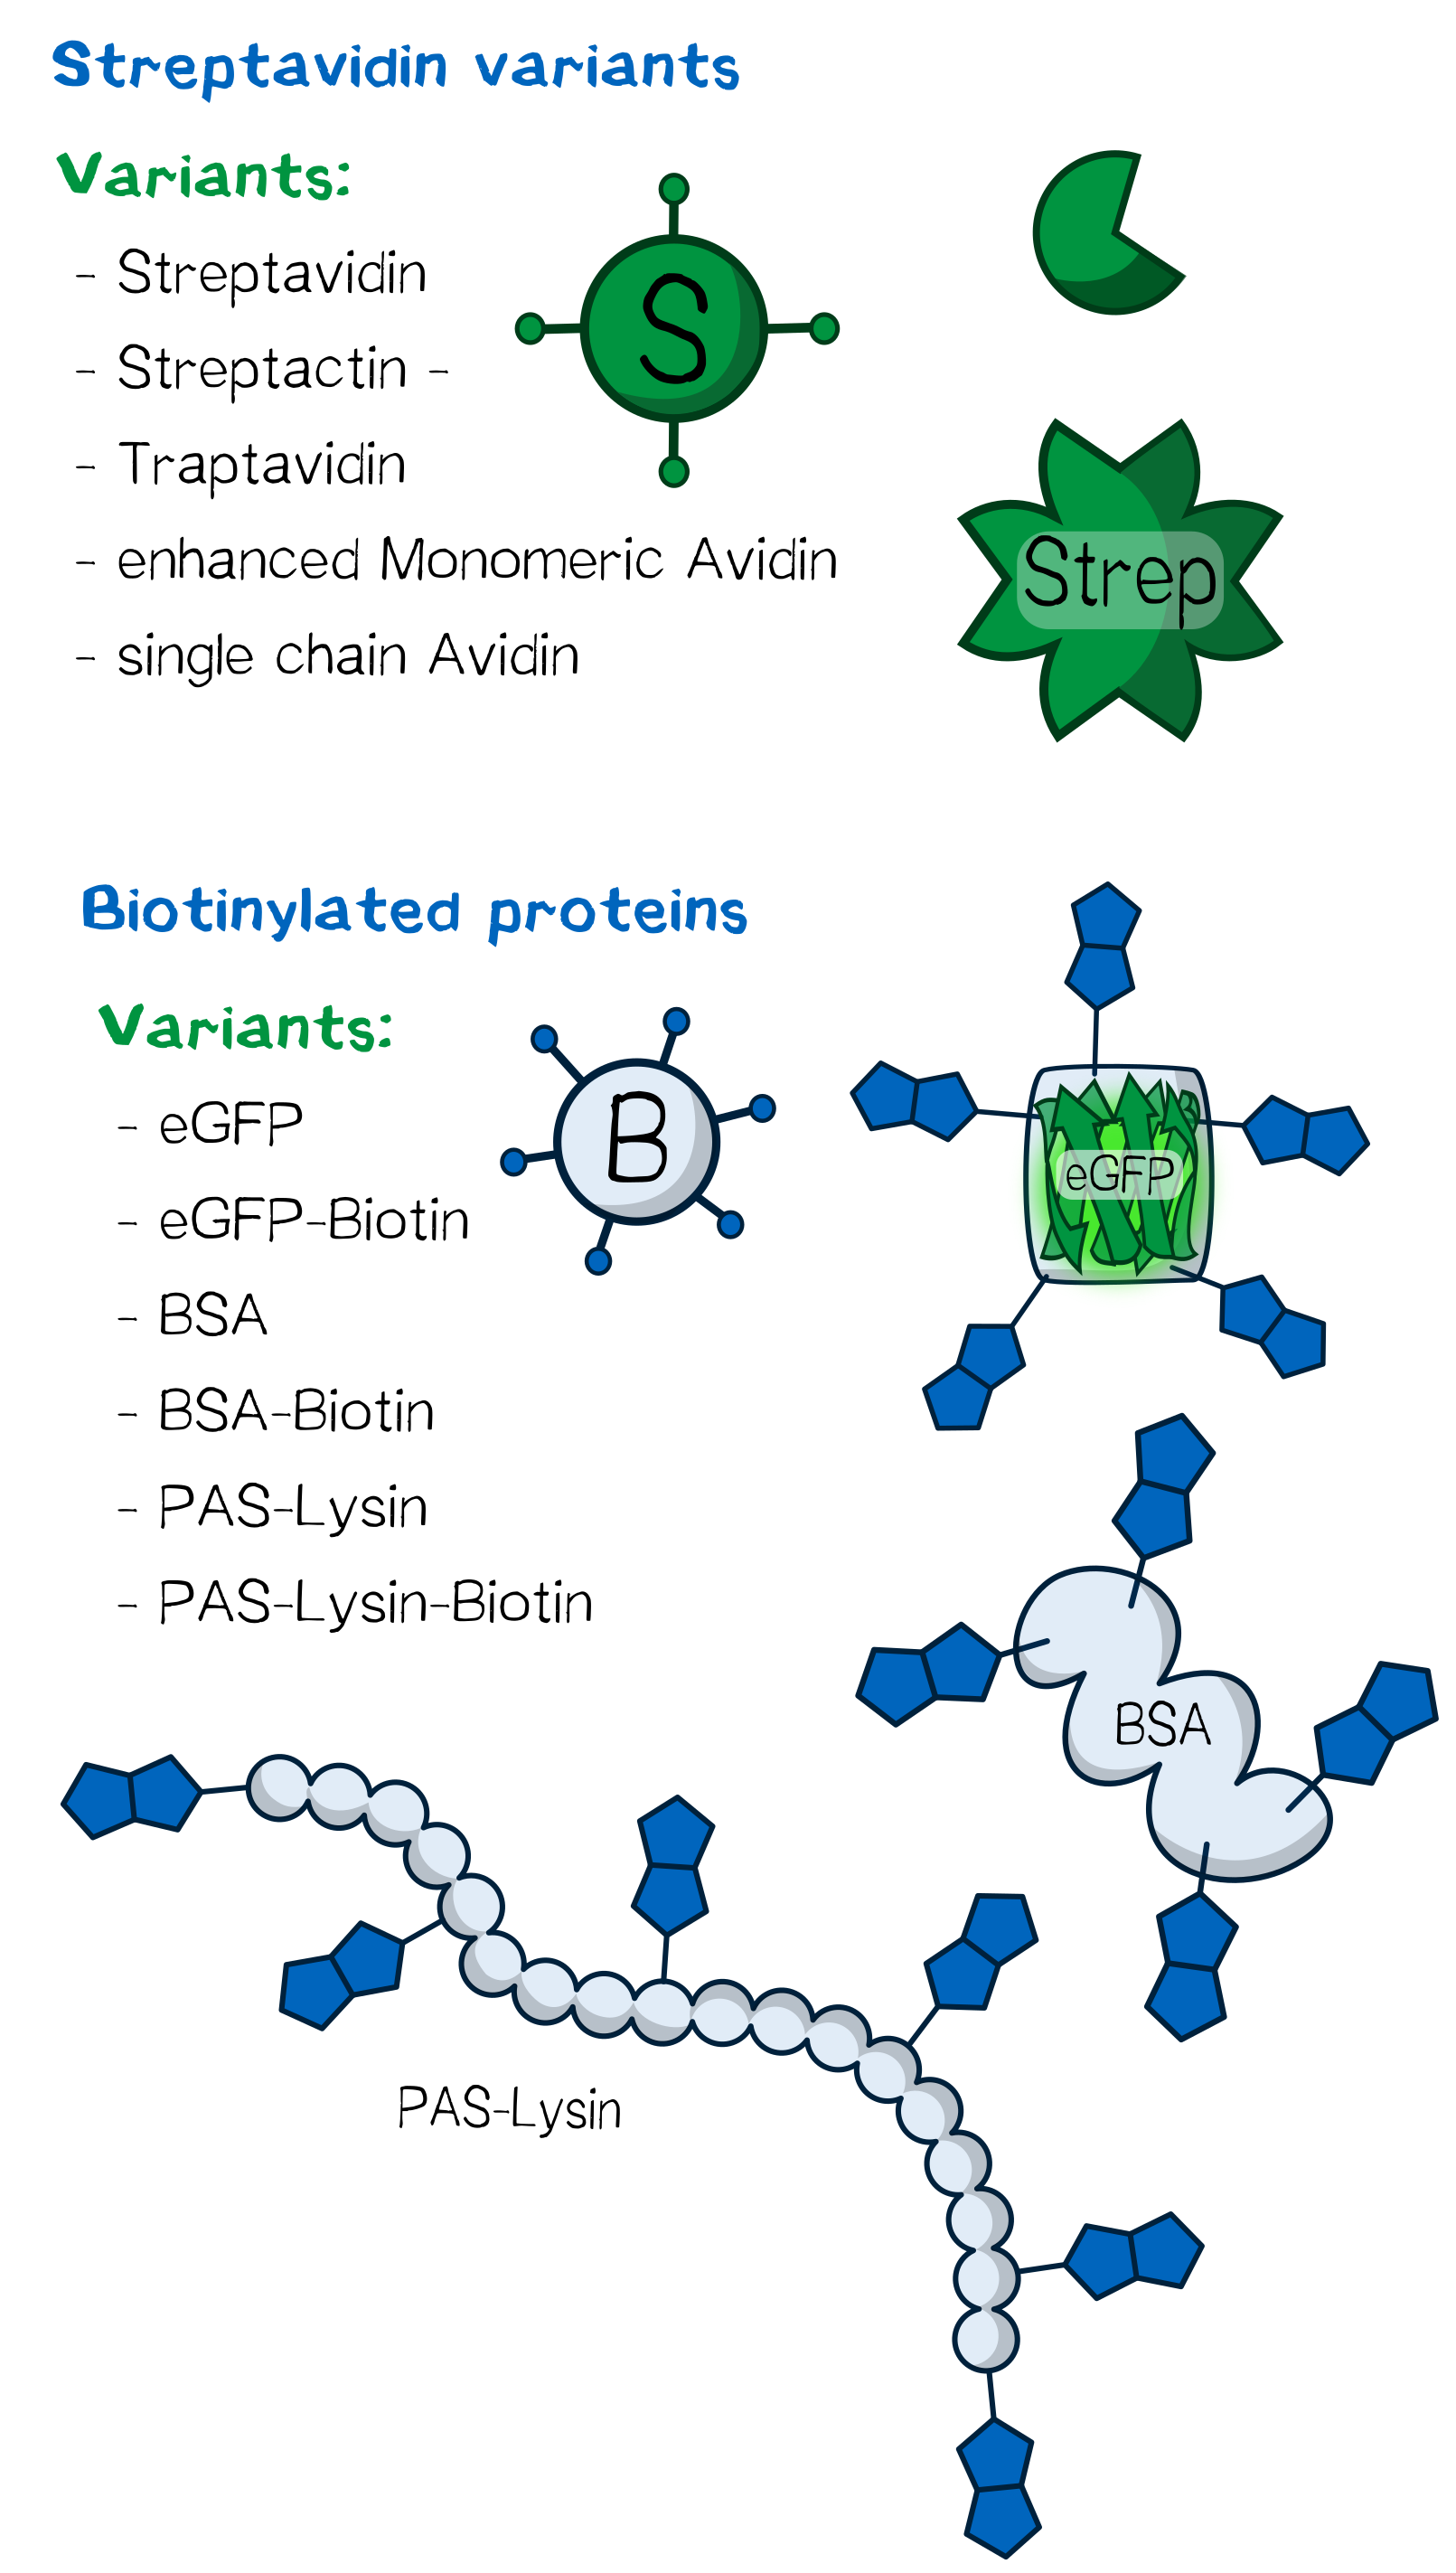 Figure 3: Overview of the proteins used for bioprinting.
Traptavidin: increased mechanical strength of biotin binding
Being a streptavidin derivate with two point mutations that increase its affinity (S52G, R53D), traptavidin shows a 10-times lower dissociation constant compared to the wildtype (KD=~10-16 M). Moreover, the tetramer has an improved thermostability and thus remains more functional at higher temperatures (TM~10 °C higher)[7]. In contrast to streptavidin, the Traptavidin L3/4 loop (residues 45-50) does not change its conformation upon binding biotin. The binding pocket is already closed and lacks flexibility. The loss of a structural change is thought to lower the entropic cost of binding and therefore decreases the koff-value as well as the dissociation constant.
Strep-Tactin: a Strep-tag binding protein
The Strep-tag is a small peptide composed of eight amino acids and can be used as affinity tag by genetic fusion to the N- or C-terminus of a recombinant protein. Using the Strep-tag's interaction with "Strep"-Tactin for affinity chromatography enables a simple and rapid one step-purification and provides great yields in protein purification. The strep-tagged protein binds Strep-Tactin, which is immobilized on the column matrix. After removing host proteins by washing, the target protein can be eluted with desthiobiotin, which binds the Strep-Tactin several orders of magnitude stronger. Over the years both, the Strep-tag and the streptavidin were optimized resulting in Strep-tag II (amino acid sequence: WSHPQFEK) affinity tag with enhanced binding to Strep-Tactin. [8]
Enhanced Monomeric Avidin (eMA: engineered for applications like molecular labelling
Due to the monovalent nature of eMA, unwanted cross-linking of biotin conjugats can not occur.
Since streptavidin binding pockets depend on one residue from a adjacent subunit, binding affinity of a single subunit is decreased (KD = 10-7 to 10-9 M-1). eMA consists of a monomerized Rhizavidin dimer, which contains a disulfid bond in the binding site restraining the protein and forming a rigid binding pocket[9].
Expression and purification of streptavidin
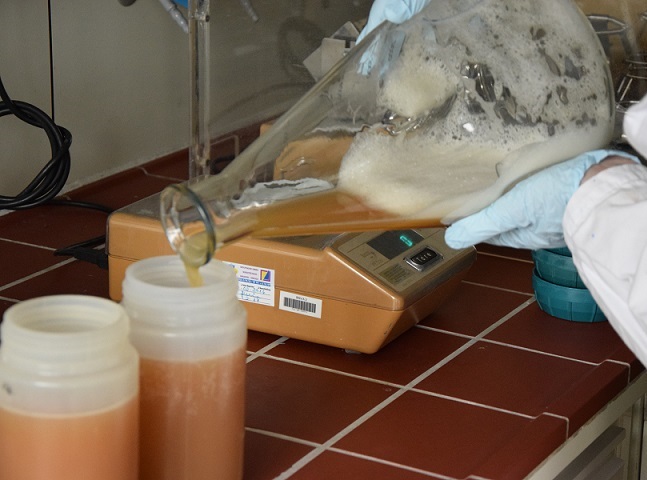
"E. coli" BLR(DE3) was transformed with the plasmid pSA1 coding for the minimal streptavidin gene under the control of a T7 promoter. The E.coli BL-R (DE3) strain, a BL21 derivative, encodes the T7-polymerase under the control of a lacUV5 promotor, which can be induced by Isopropyl β-D-1-thiogalactopyranoside (IPTG).
A shaking flask with 2 L LB medium supplemented with ampicillin was inoculated 1:40 with a 50 ml pre-culture grown at 30 °C over night.
After shaking the bacterial culture at 37 °C until its optical density reaches 0.6, protein expression was induced with 1 mM IPTG. Followed by 4 hours shaking at 37 °C cells were harvested by centrifugation for 30 min at 5000 rpm. The cell pellet was resuspended in buffer A (20 mM Tris/HCl - pH 8, 500 mM NaCl). Bacterial cells were lysed using a PANDA homogenizer and inclusion bodies in the cell lysate are pelleted by centrifugation. The pellet fraction was washed with buffer A to remove "E. coli" membrane and cell wall material. Guanidine·HCl (6 M, pH 1,5) was used to solubilize the washed pellet protein.
After solubilization the solution was centrifuged to remove remaining aggregates. Refolding of the solubilized proteins is initiated by the removal of the denaturant. The rapid dilution of the solubilized streptavidin was achieved by dripping the protein solution into large volume of refolding buffer (30 ml PBS for 1 ml protein solution).
After incubation at 4 °C over night, the solution was centrifuged to remove aggregates.
The Streptavidin purification was proceeded by fractionated ammonium sulfate precipitation.
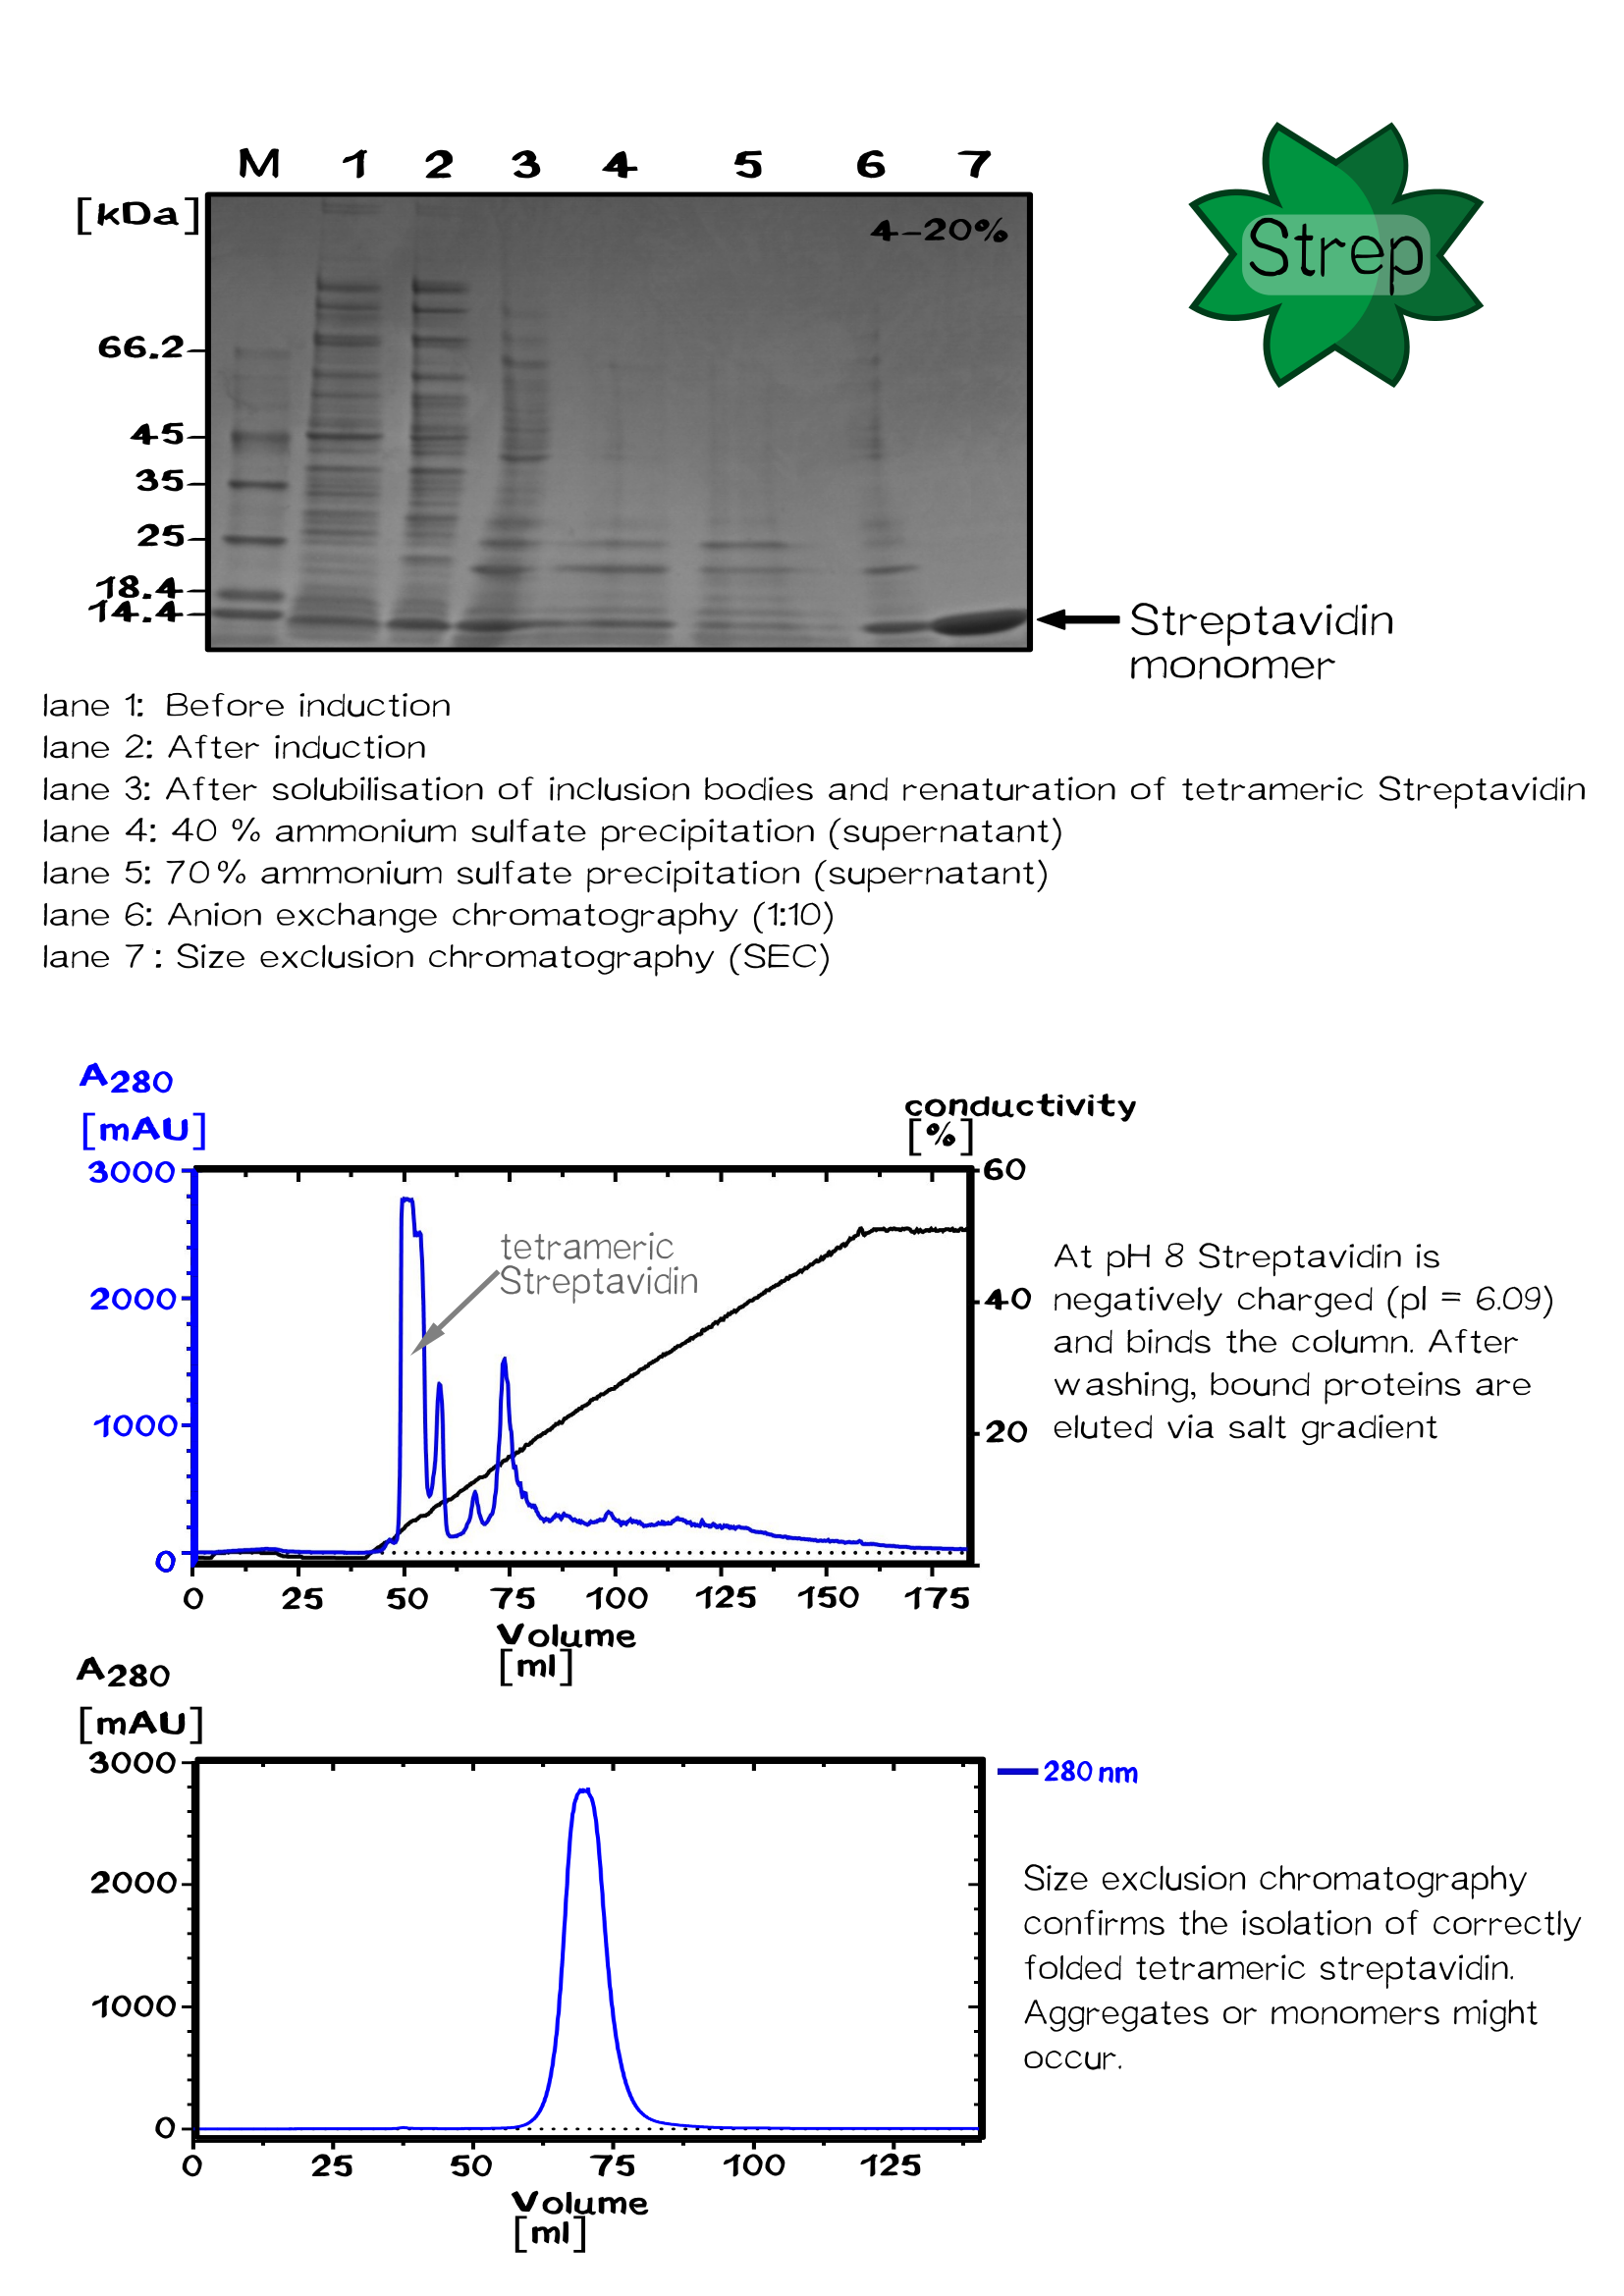
At 40 % saturation (1.75 M), streptavidin remains soluble and precipitated proteins were removed by centrifugation. In the next step streptavidin was precipitated by increasing the ammonium sulfate saturation up to 70 % (3.37 M).

After centrifugation, the pellet was resuspended in a 50 % saturated ammonium sulfate solution (2.25 M). After following centrifugation the pellet is resuspended in 1x PBS buffer.
The protein was dialysed against 20 mM Tris/HCl buffer (pH 8.0) without salt and loaded on a Resource Q column for ion exchange chromatography. Proteins were eluted by an increasing salt gradient (hier Abb. Chromatograhie!).
Purified streptavidin was analysed by SDS–PAGE and Gelfiltration chromatography conducted at room temperature using a Sephacryl S-200 HR column.
After sterile filtration, the protein concentration was determined by UV/VIS spectroscopy.[10]
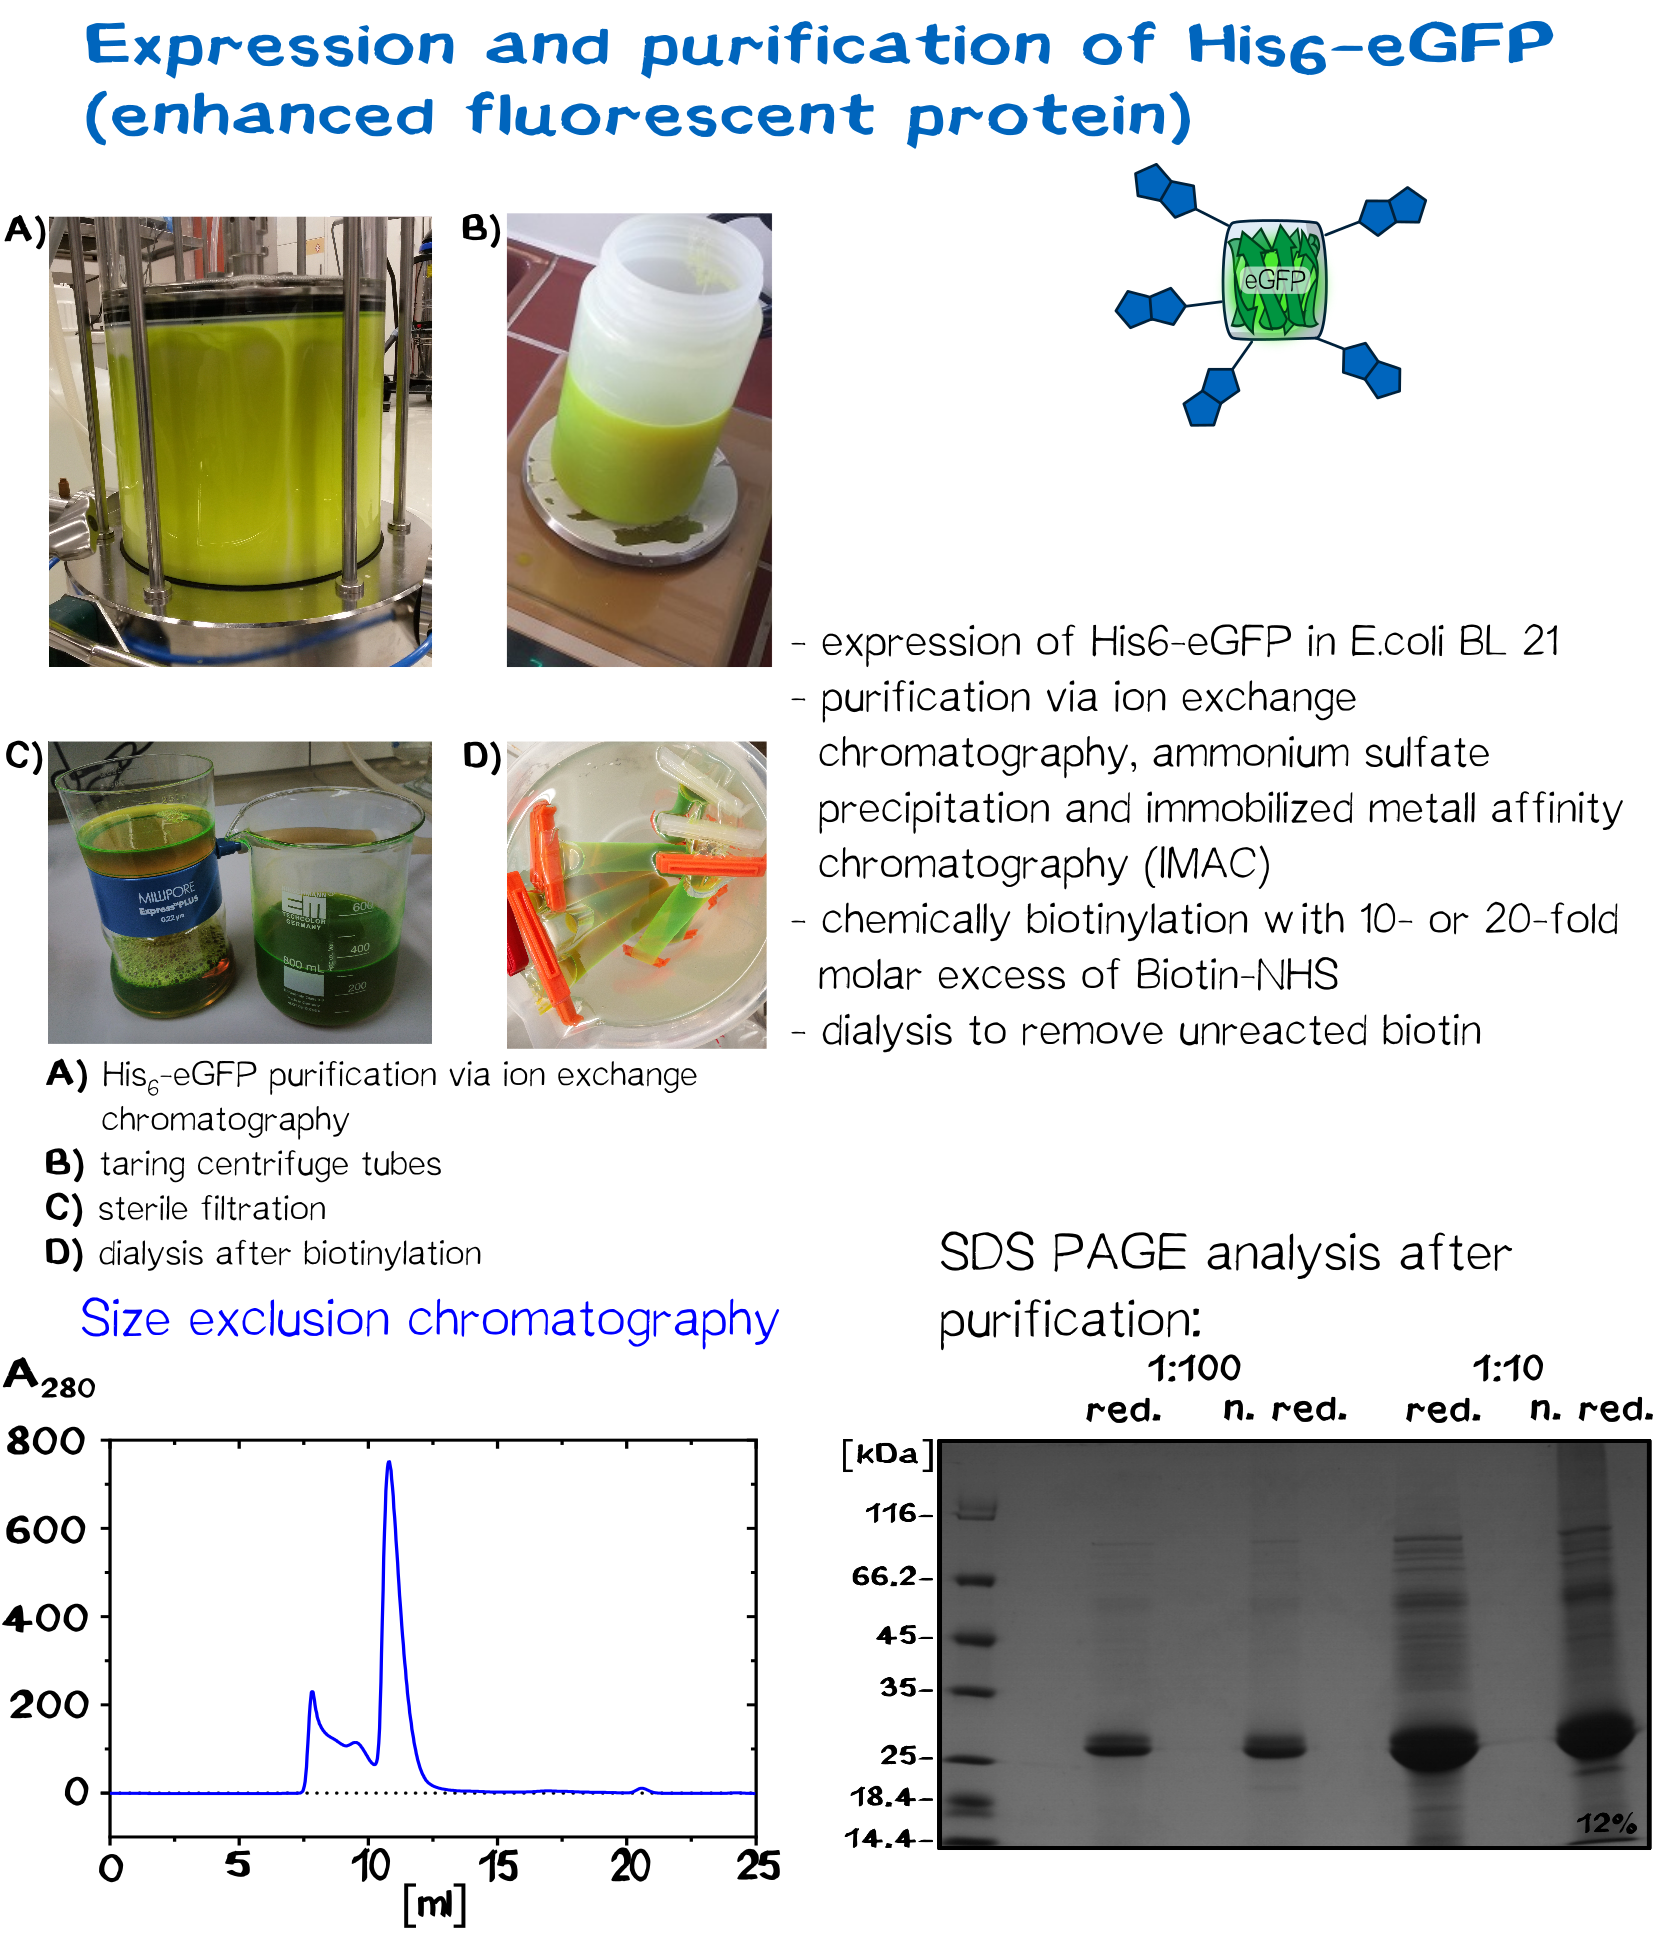
The streptavidin variants StrepTactin and TrapAvidin were produced as cytoplasmic inclusion bodies, solubilized, refolded, purified by fractionated ammonium sulfate precipitation and analysed by SDS–PAGE according to wild-type streptavidin. Enhanced monomeric Avidin was expressed in "E. coli" BL21 and purified via the His-tag using IMAC chromatography.
Streptavidin Fermentation
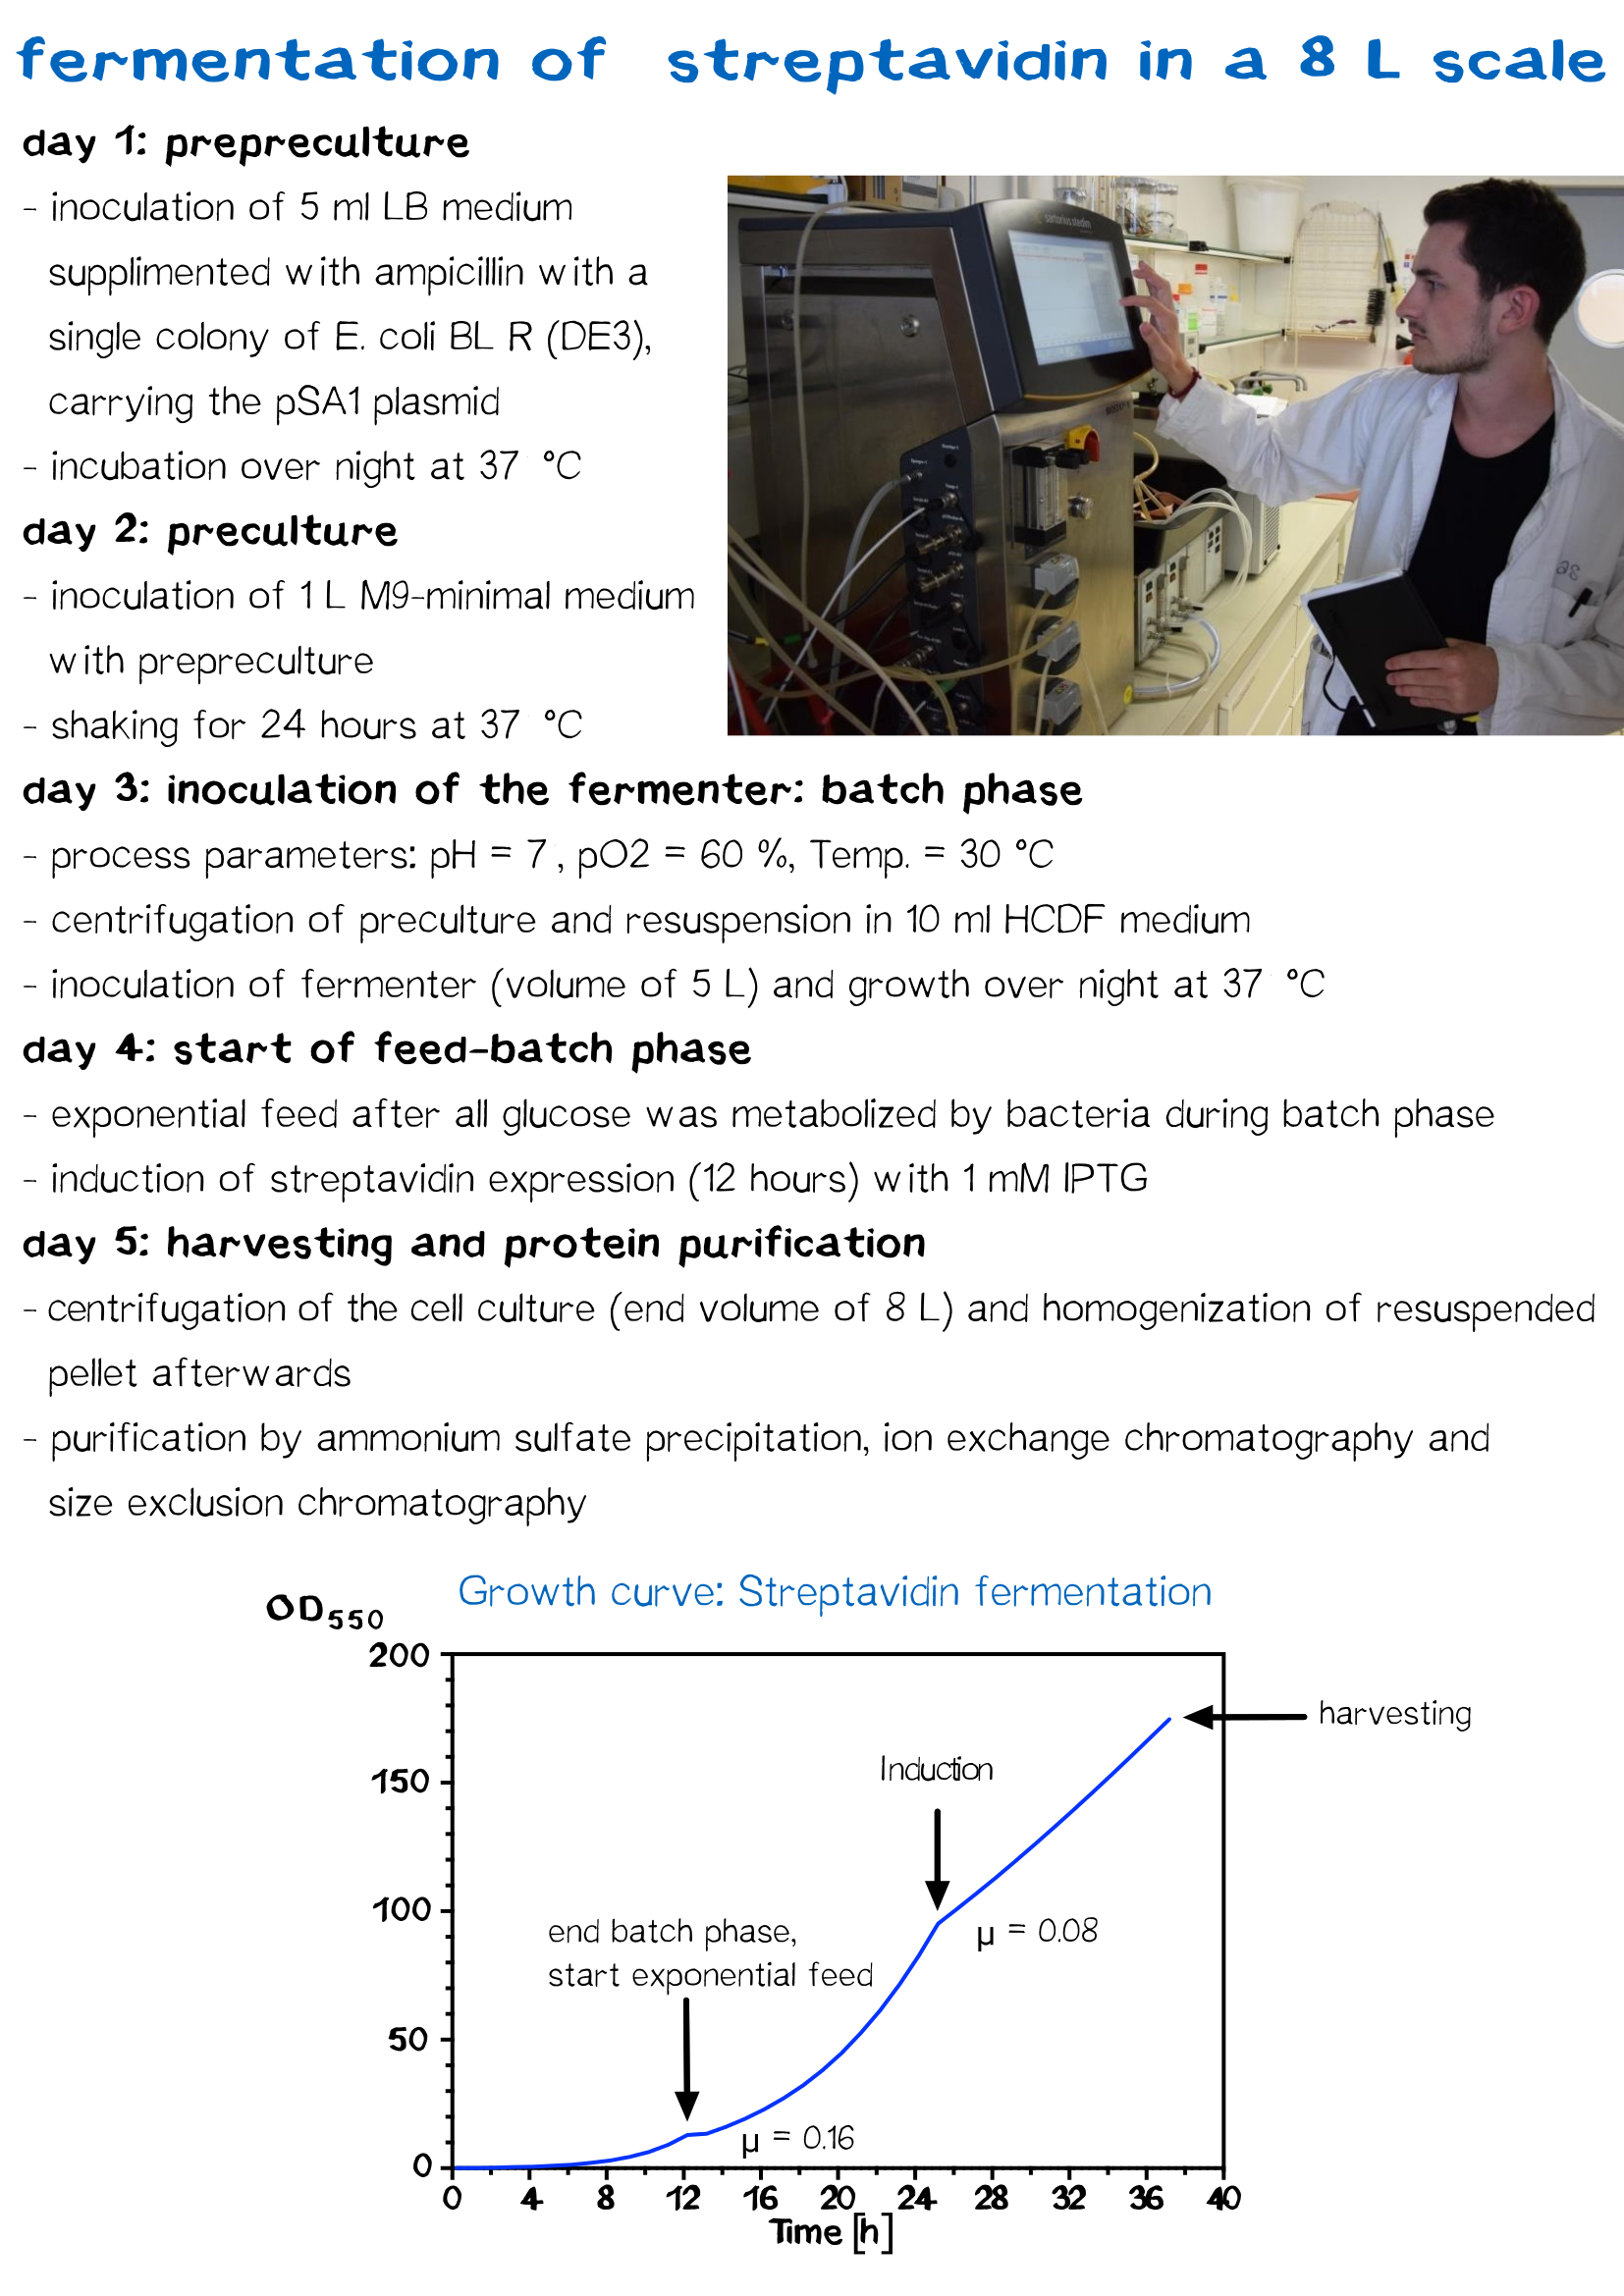
Fermentation is utilized for upscaling protein production under strictly defined conditions. A high cell density cultivation method was used to produce recombinant streptavidin in E. coli. Glucose was fed for 12 h after a over night batch phase to achieve a specific growth rate of 0.16 h−1 until cells reached an OD550 of 30. Culture was then induced with 1 mM IPTG and cells were further grown for 12 h to reach an OD550 of 60. The recombinant streptavidin was produced as cytoplasmic inclusion bodies, solubilized, refolded, purified by fractionated ammonium sulfate precipitation and analysed by SDS–PAGE as described above. After refolding and purification, streptavidin was greater than 98% pure, homogeneous and functionally active.
Biotinylated PAS-lysine: A flexible linker
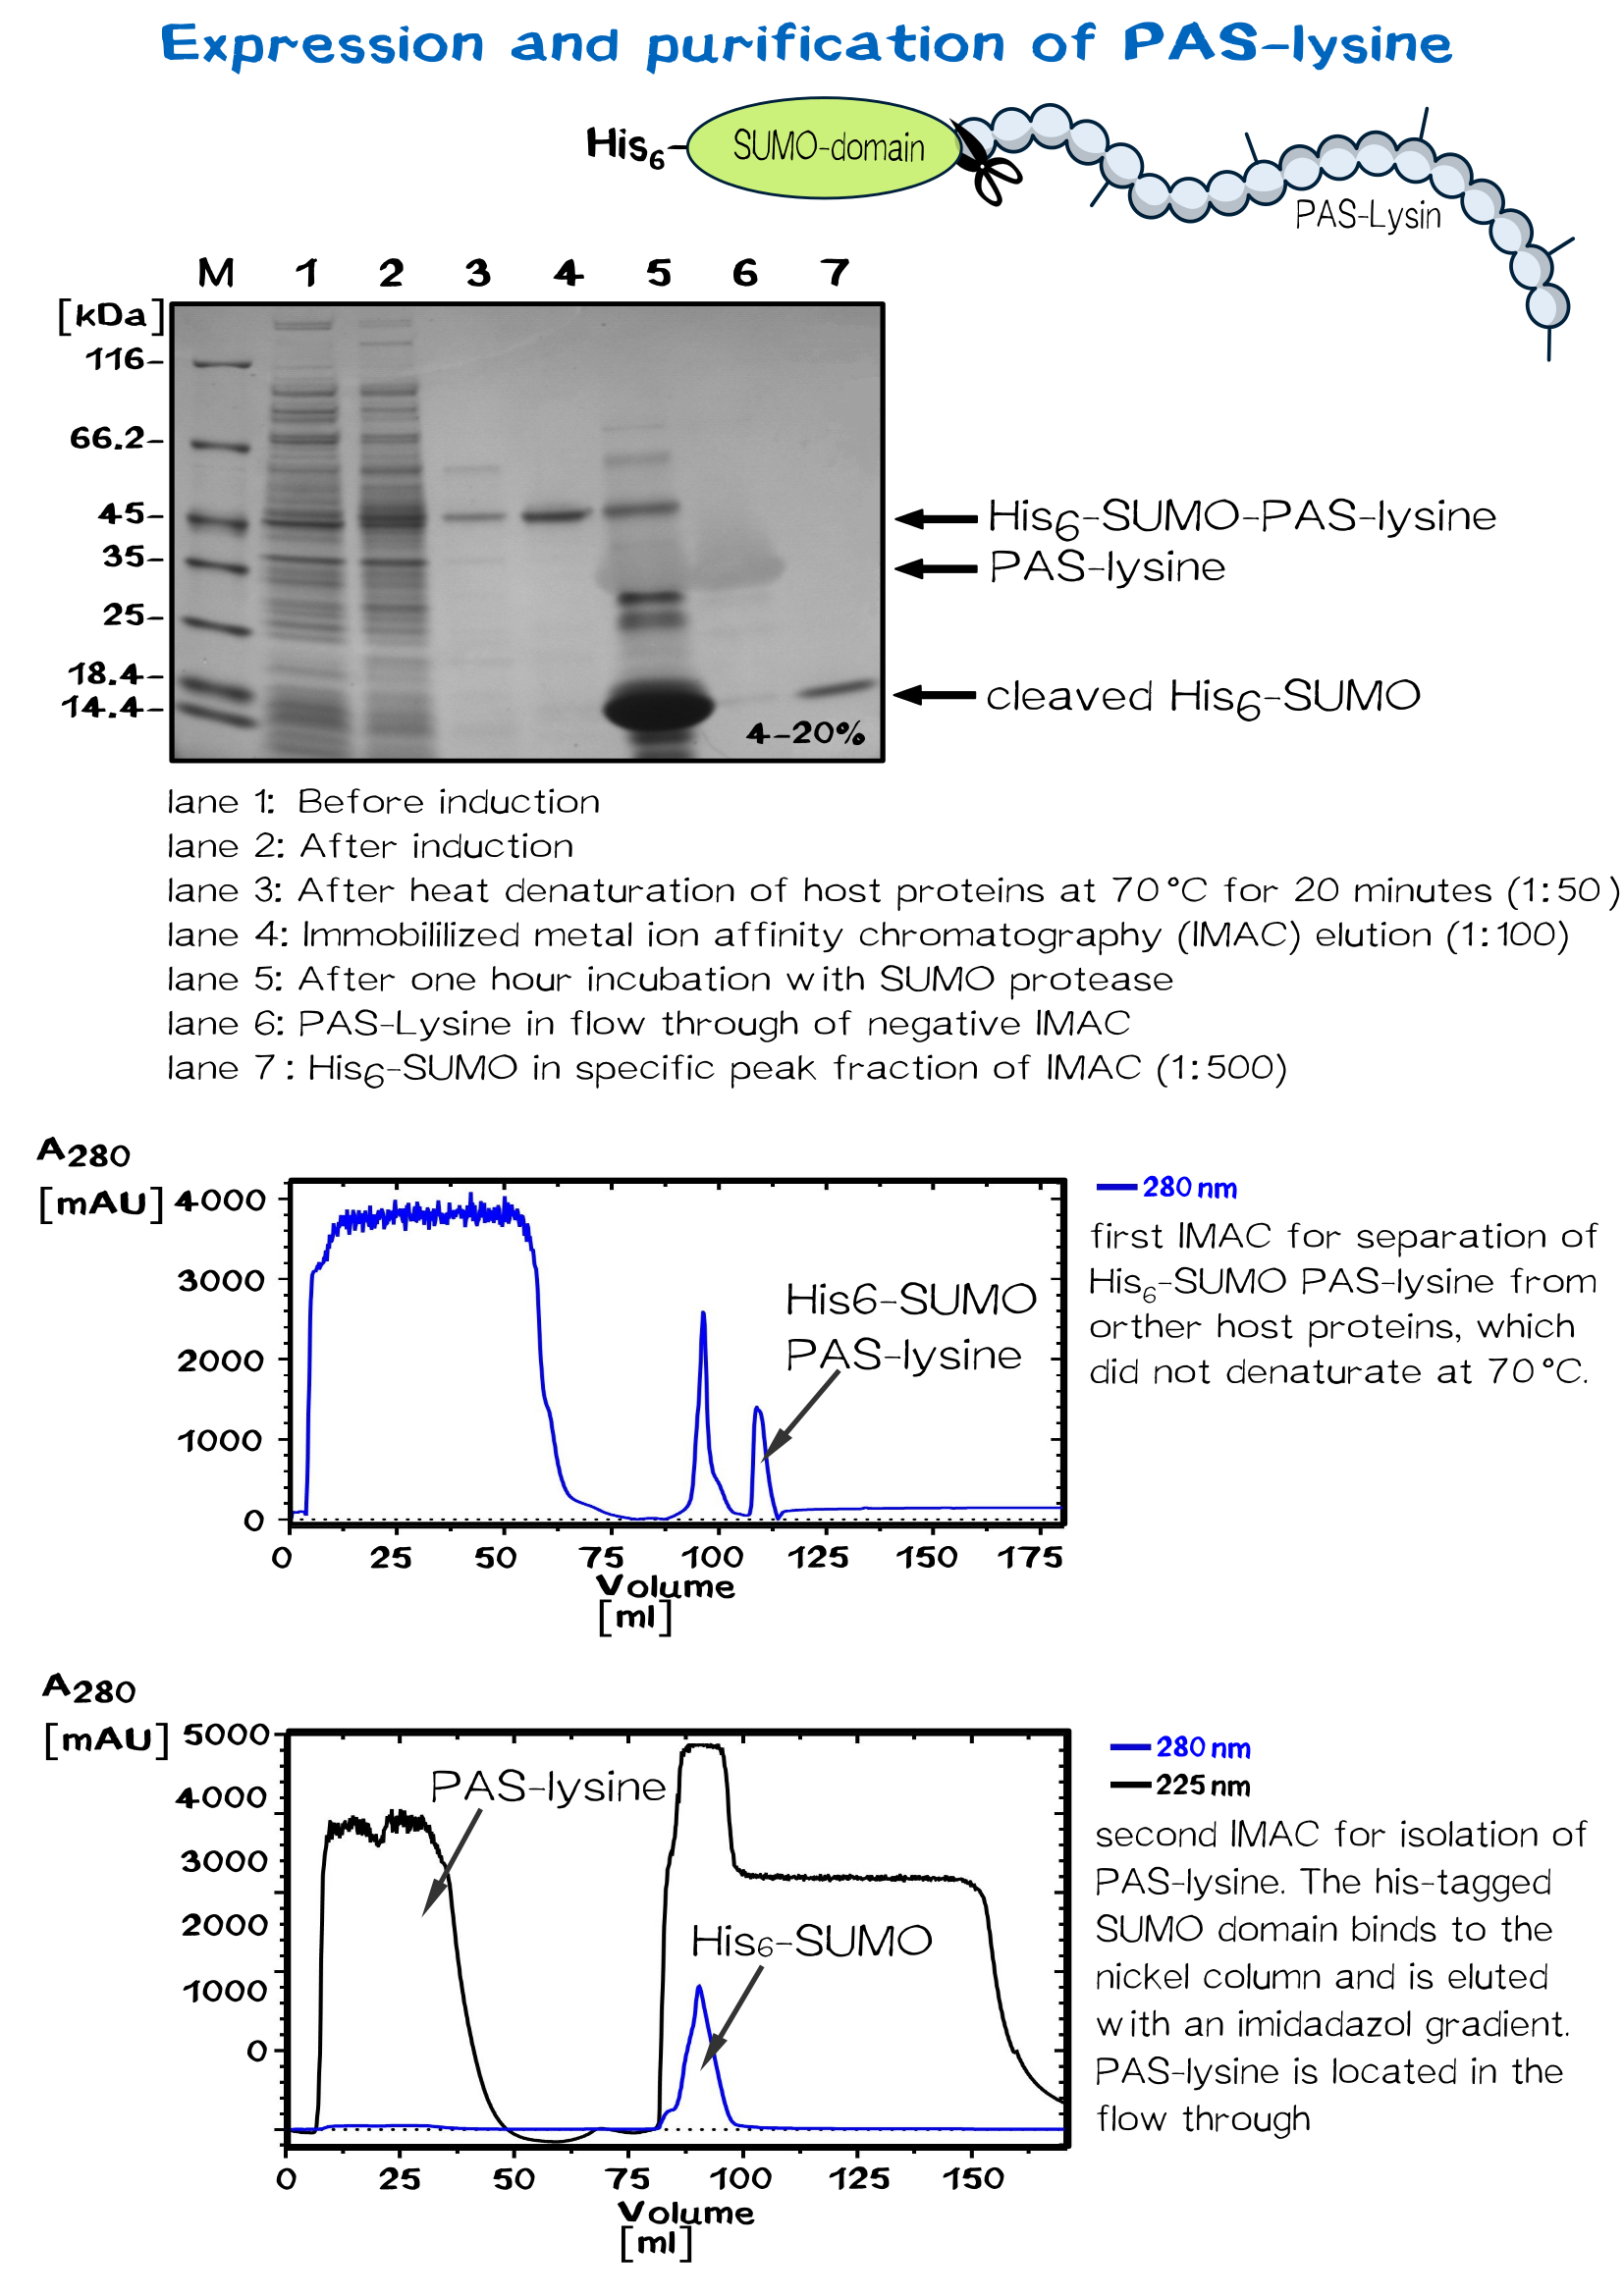
PAS-lysine is an artificial polypeptide of 10 peptide cassettes composed of the three small, chemically stable amino acids Pro, Ala, and Ser (PAS) [11] ,which are interspersed by Lysine residues to allow site-specific biotinylation with Biotin NHS-Ester. PAS-Lysine is expressed at high yields in Escherichia coli as a Small Ubiquitin-like Modifier (SUMO) fusion protein, which is easily purified via His-tag and allows isolation of the PAS-Lysine after SUMO protease cleavage.
A 50 ml preculture with E.coli BL R (DE3) carrying the pSUMO plasmid is poured into a shaking flask with 2 L LB medium. After the bacterial suspension reaches an optical density of 0.5 the expression of PAS-lysine is induced by adding IPTG (1 mM).
The cells are harvested (5000 rpm, 30 minutes) after five hours shaking at 37 °C and resuspended in 20 mM Tris/HCl buffer with 500 mM salt, pH 8. Homogenization is conducted by French press or PANDA. SUMO PAS-lysine is very good soluble, after centrifugation at 11500 rpm for 30 minutes it is located in the supernatant, the pellet can be discarded.
SUMO PAS-lysine has the property to remain native even at high temperatures, where most protein denaturate. Heating the solution up to 70 °C for 20 minutes and centrifugation afterwards removes nearly all other proteins.
The solution is dialysed against IMAC buffer (50 mM sodium dihydrogen phosphate and 500 mM salt, ph 7.5) and loaded on a chromatography column packed with nickel. After washing away impurities, the addition of imidazole results in elution of the SUMO PAS-lysine.
The SUMO domain has no further use and is cleaved off by the SUMO-protease ULP. Another IMAC separates the PAS-lysine from SUMO domain, which binds specifically to the column. PAS lysine can be identified in the flow through via UV absorption. Because PAS-lysine does not contain aromatic residues, its absorption at 280 nm is very low, while the absorption at 225 nm (amid bondage) is average.
eGFP and BSA: alternative linker molecules
Serum albumin is the most abundant plasma protein in mammals. It is a transporter molecule for a diverse range of metabolites, drugs, nutrients, metals and other molecules and shows remarkable ligand binding capacity. [12] Bovine serum albumin, originally isolated from a cow, is often used as a concentration standard for protein assays, it is therefore in stock of many laboratories. Since it has 60 lysine residues within its 607 amino acids long sequence, the soluble BSA protein works well as a linker molecule.
In recent years eGFP has emerged as a powerful reporter molecule for monitoring gene expression, protein localization and protein-protein interaction. [13]. Due to its emission of green light, eGFP helped improving the printing and polymerization process by enabling the opportunity to see if polymerization of the sample was successful immediately. Thus, only promissing samples were analysed under a microscope.
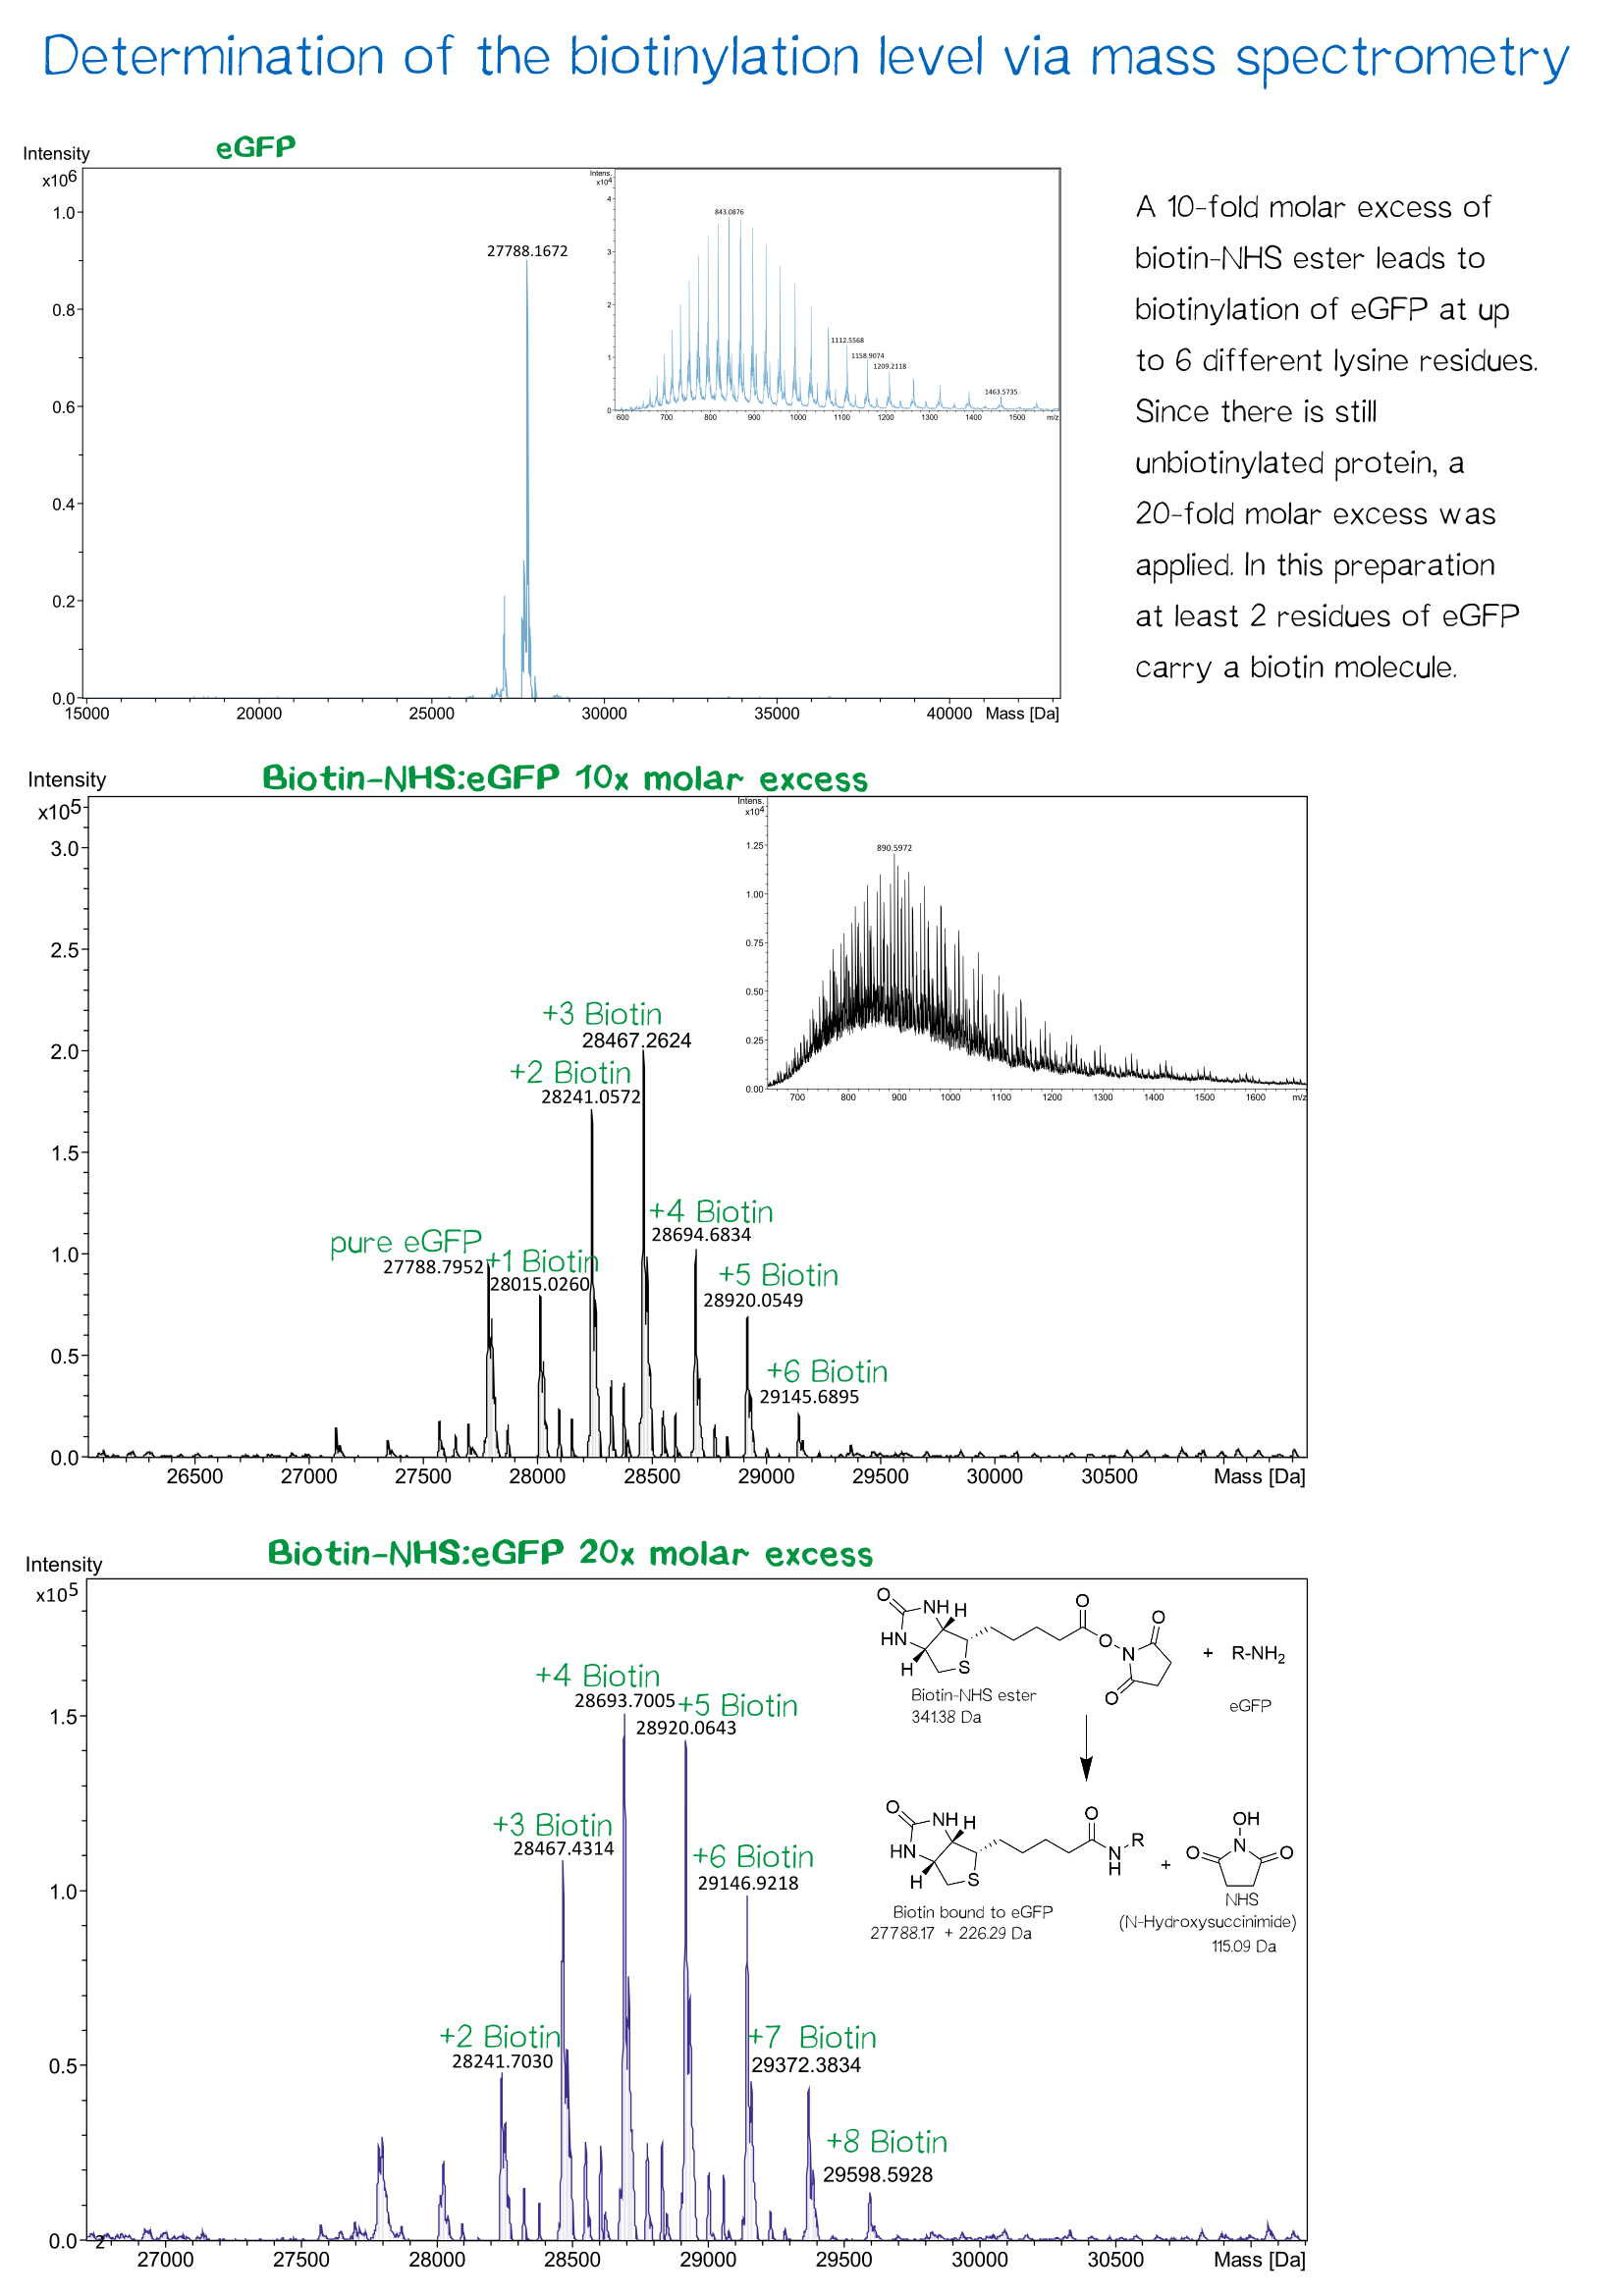
As a globular protein with 20 lysine residues in its sequence, eGFP can be used as a chemically biotinylated linker molecule.
Further characterisation of streptavidin variants
Overview of purified proteins
Streptavidin and its variants were produced by cytoplasmic expression in E. coli in inclusion bodies. After stabilization and refolding of the functional tetrameric and monomeric variants, purification was carried out by ammonium sulfate precipitation, Ion Exchange Chromatography and size exclusion chromatography. Samples of each required step were analysed by SDS-PAGE. Finally each of the successfully purified variants were characterized. Mass spectrometry was used to confirm the expected size, circular dichroism spectroscopy (cd) to determine folding states, fluorescence titration and surface plasmon resonance for determining binding affinities.
Quality control using ESI-TOF mass spectrometry
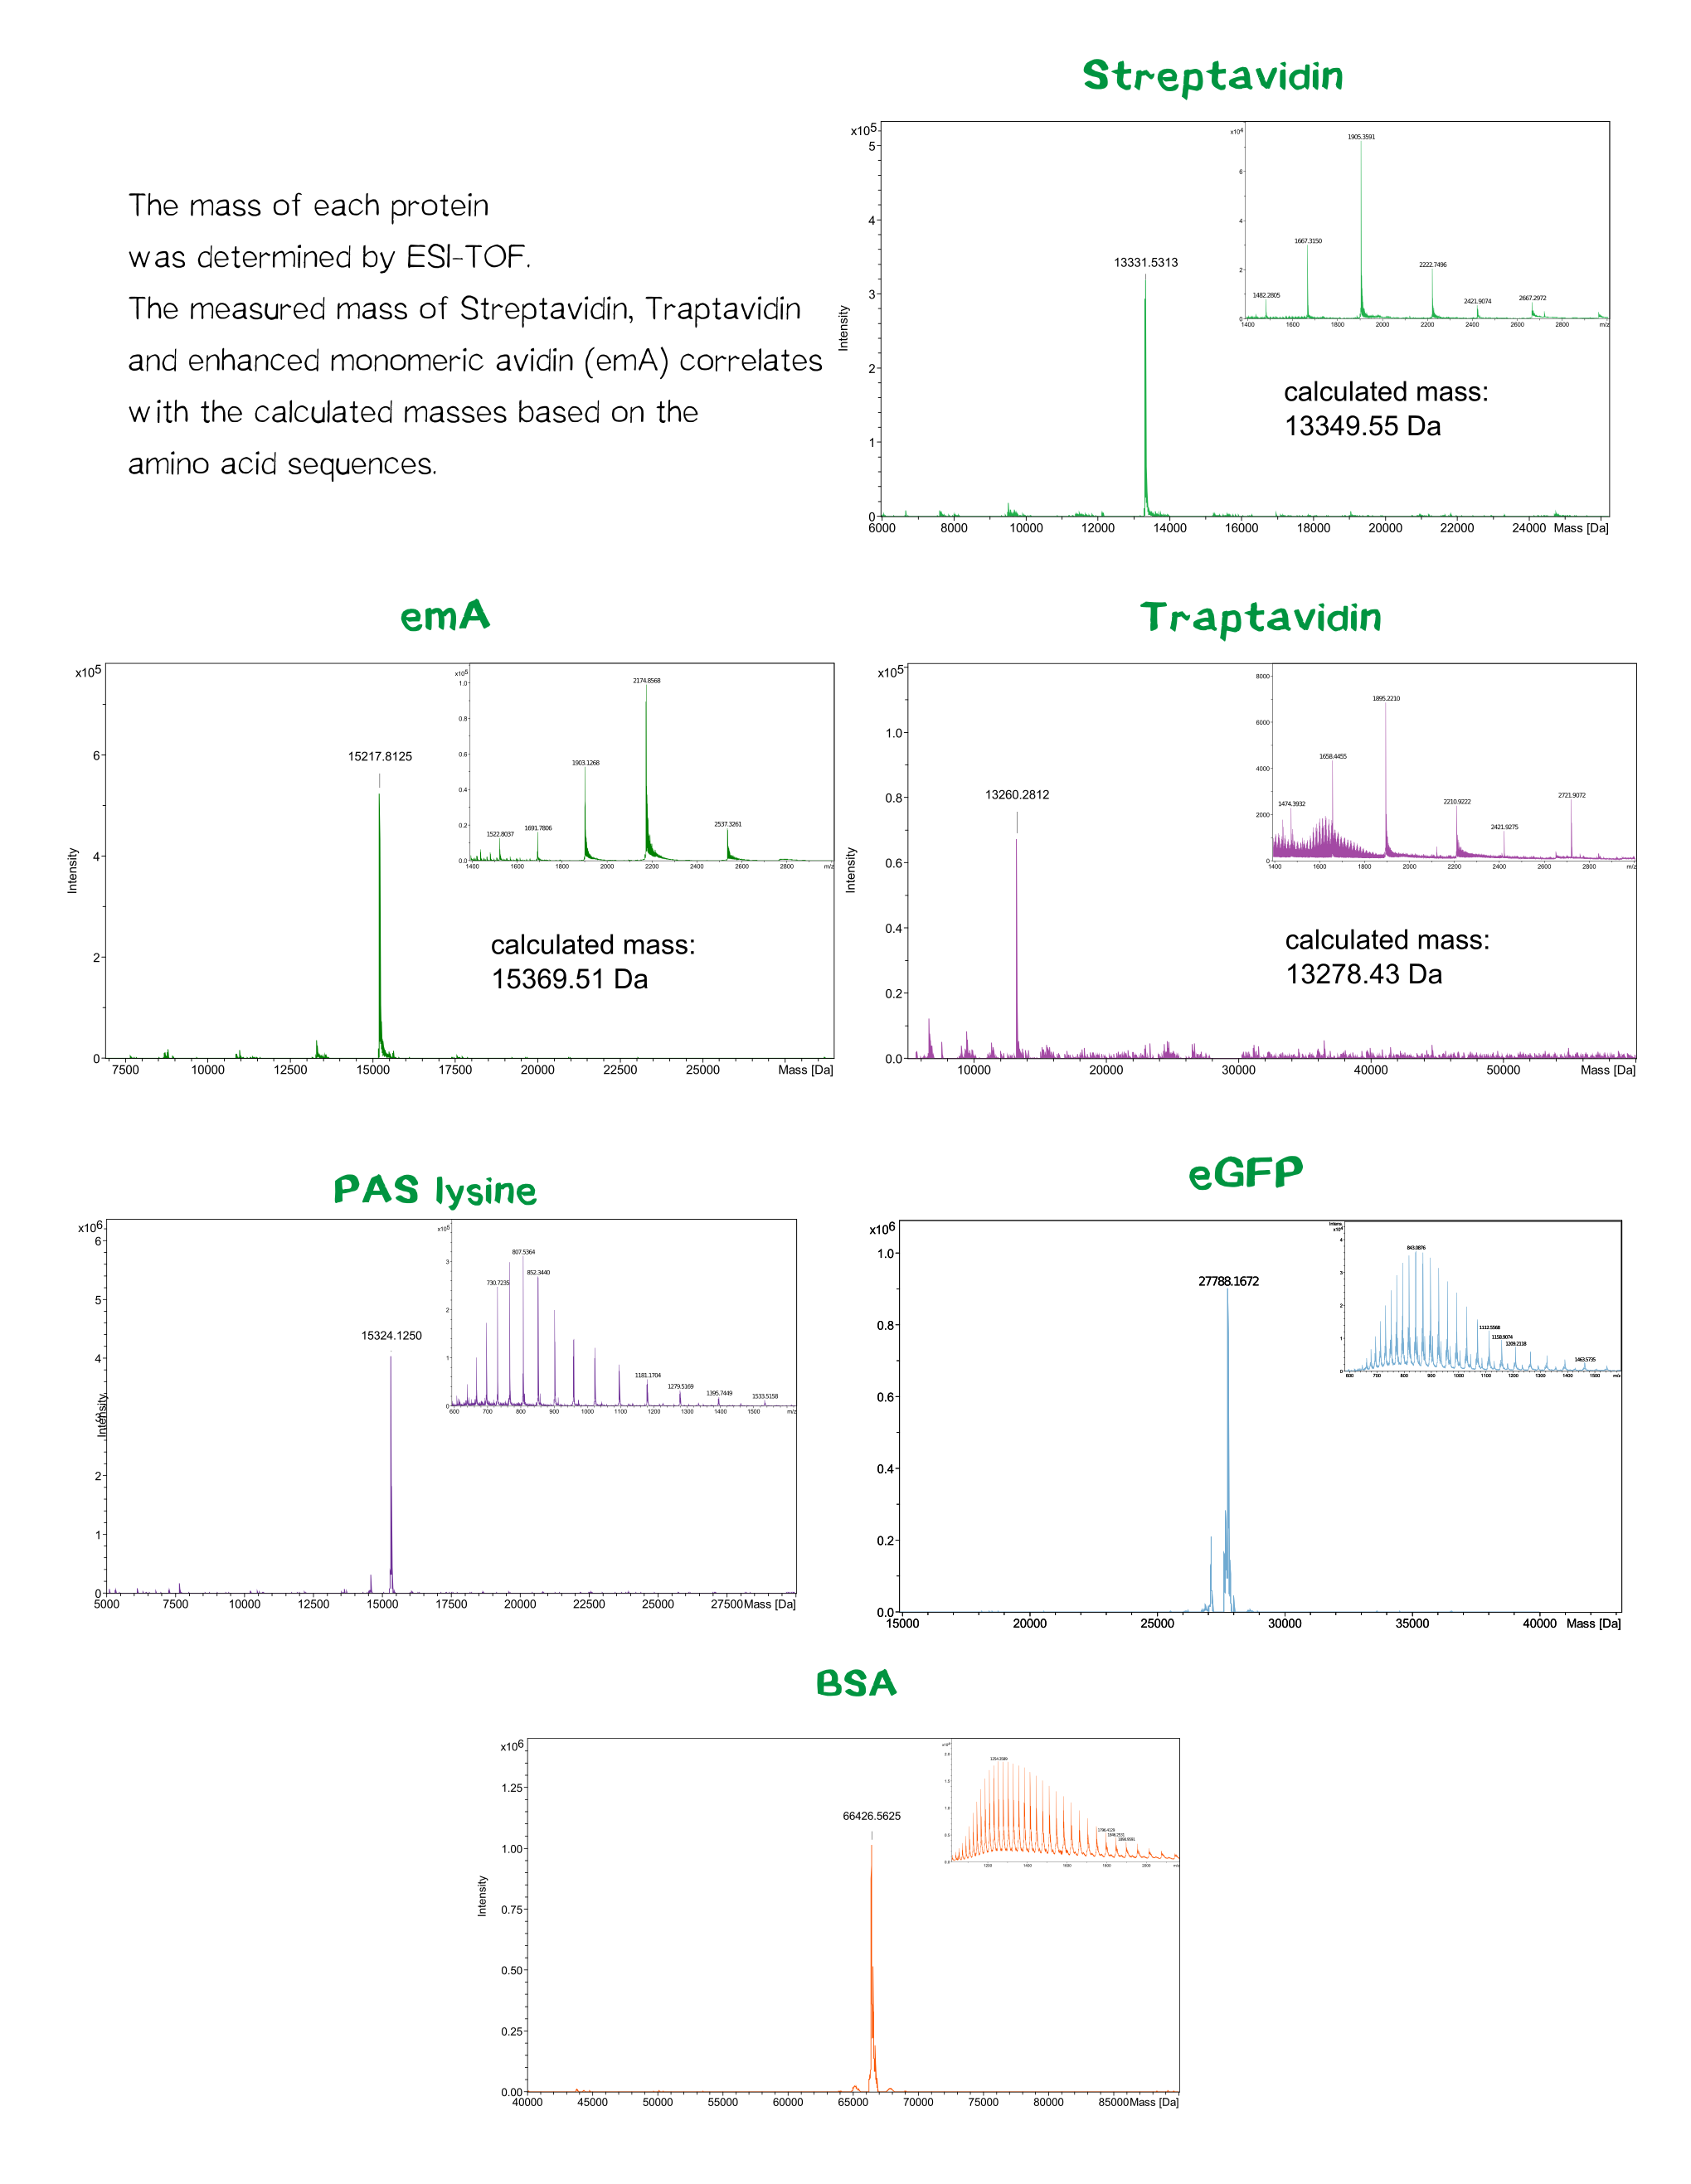
The molecular mass of the purified proteins were measured by ESI-MS on an maXis Q-TOF instrument (Bruker, Bremen, Germany) operated in positive ion mode after dialysis against 10 mM ammonium acetate (pH 6.6). Samples were supplemented with 20% (v/v) acetonitrile (LCMS grade; Sigma-Aldrich, Steinheim, Germany) and 0.1% (v/v) formic acid (LC-MS grade; Sigma-Aldrich). Raw data were analyzed and deconvoluted with Compass Data Analysis software (version 4.0). The calculated masses of all proteins were confirmed mass spectrometry data.
Quality control using SDS-PAGE and isoelectric focusing
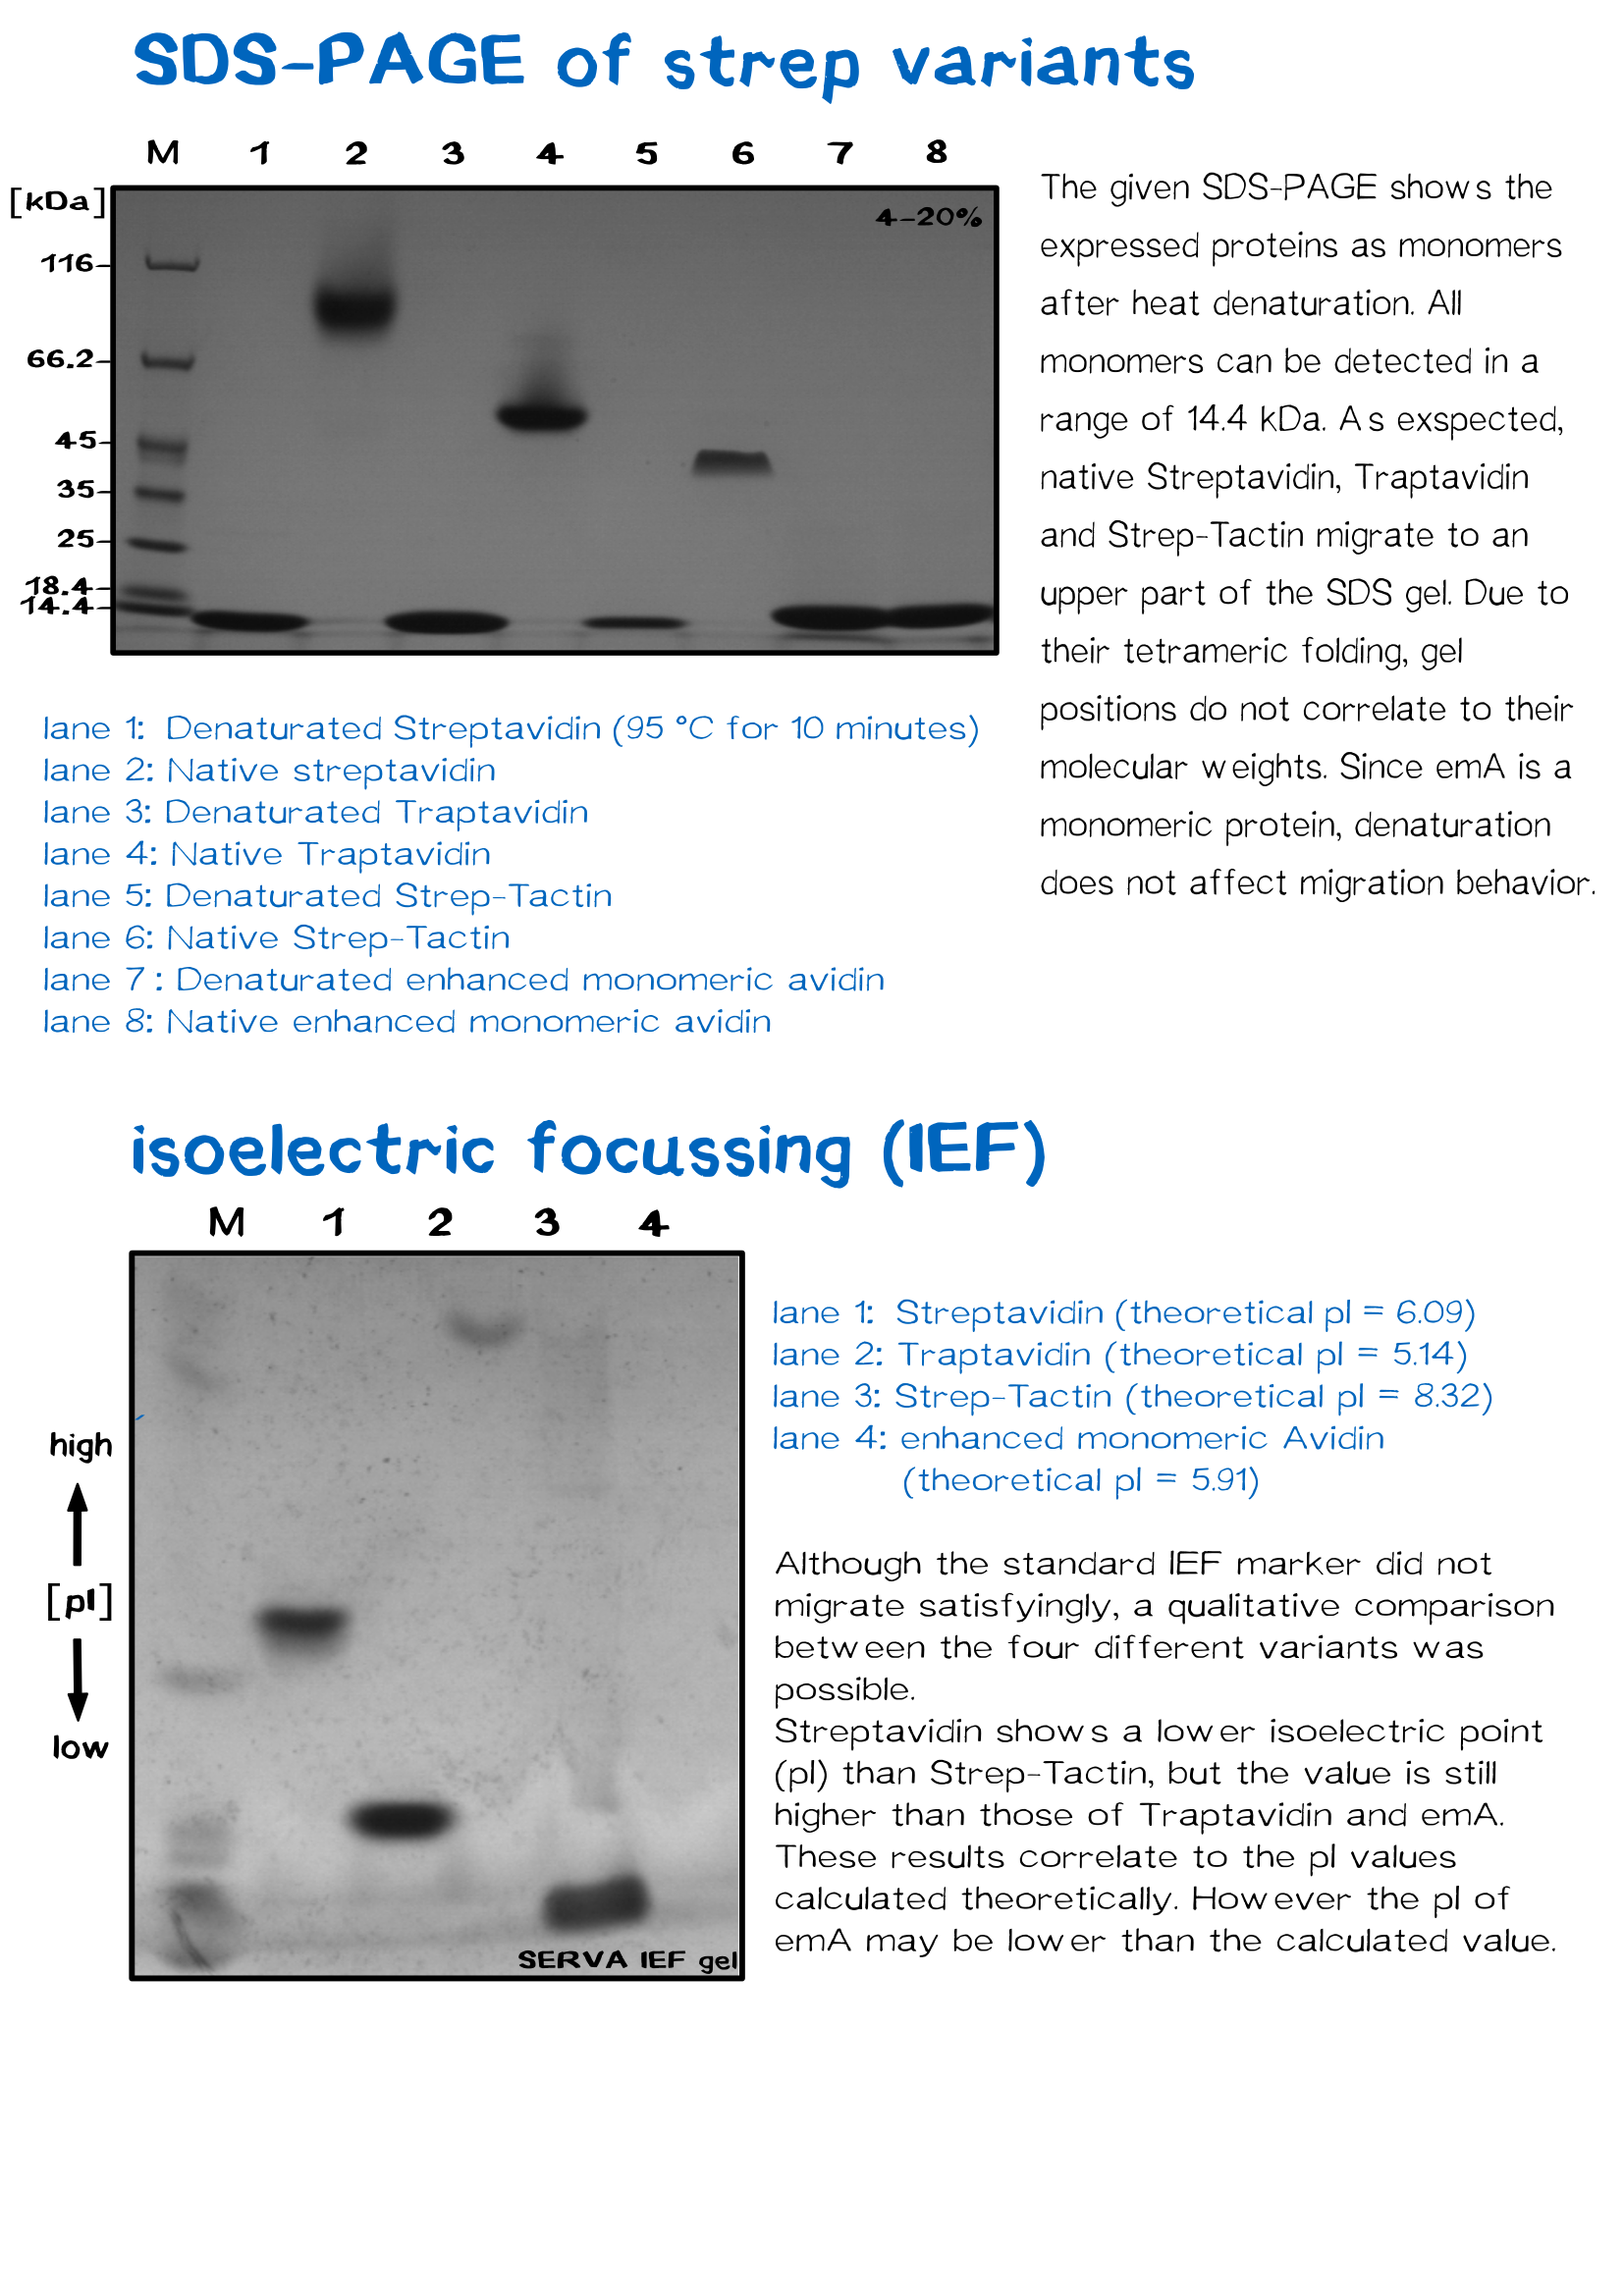
Following purification, 12 μl of protein were incubated with SDS-Loading dye at room temperature. One set of reactions were then denatured at 95 °C for 10 min. and subjected to 13% SDS-PAGE and stained with Coomassie Blue to determine. Previous work on the electrophoretic mobility of streptavidin has shown that the protein maintains its tetrameric native structure (∼60 kDa) and activity in the presence of SDS-PAGE sample buffers, and requires significant heating to break this interaction.
Affinity determination using fluorescence titration
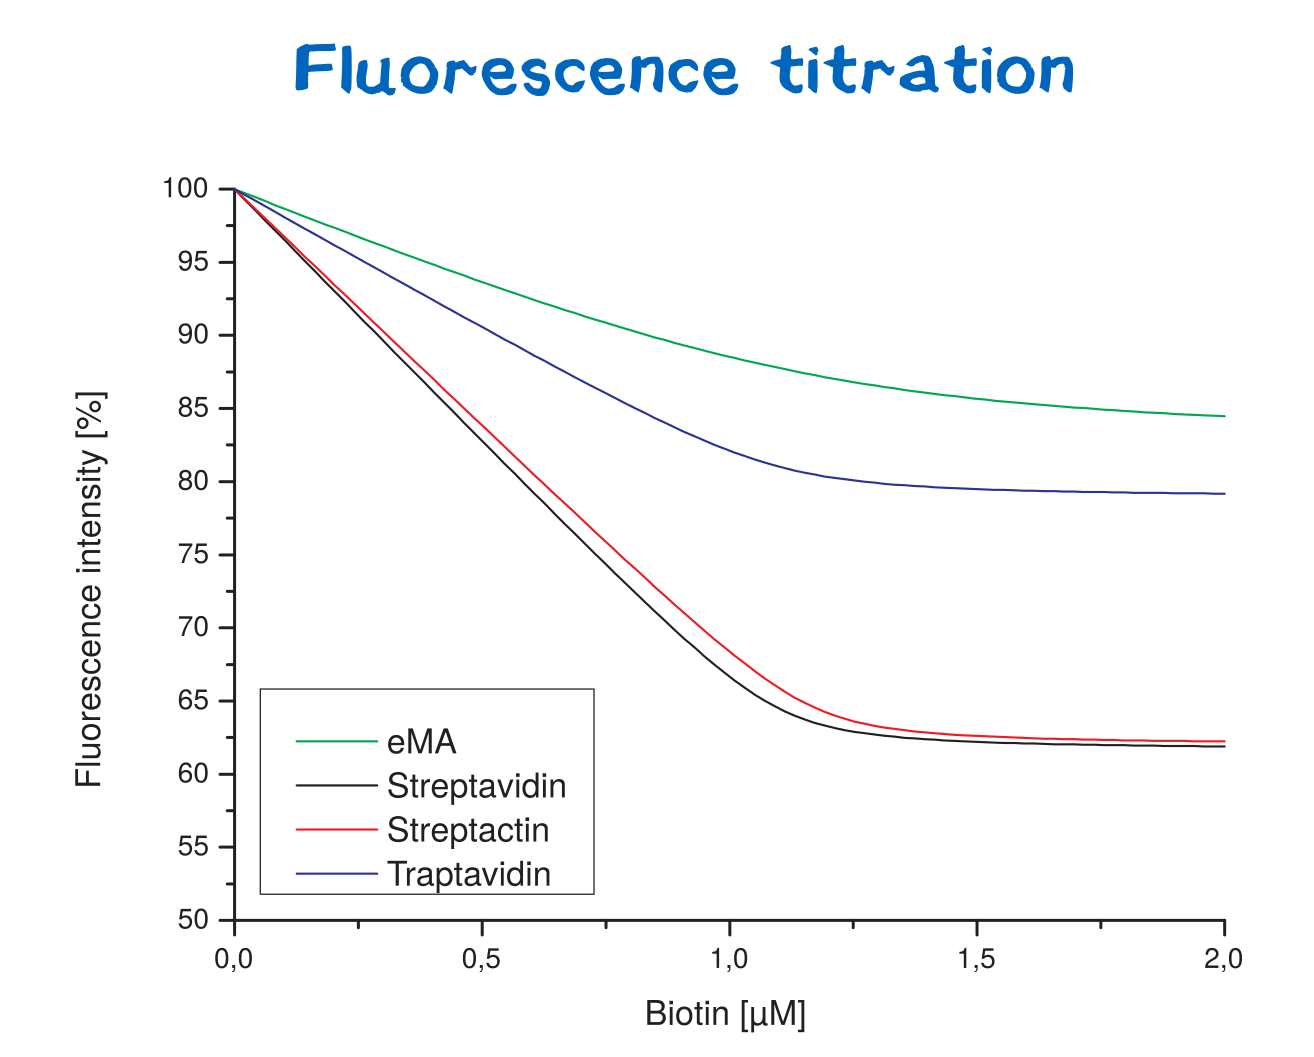
Fluorescence titration is a method that utilizes the change of intrinsic protein fluorescence upon ligand binding in order to quantify binding properties. This way, the binding affinity - as characterized by the KD value - can be determined.
For the analysis of protein-ligand or protein-protein interactions, one binding partner is therefore titrated against a constant concentration of the other binding partner (streptavidin or a variant).
The path length of the cuvettes used for absorption and emission studies hereby was 1 cm. For fluorescence titrations, stock solutions of streptavidin or its variants were prepared (1 μM) in 50 mM Tris–HCl, 100 mM NaCl , pH 8.0. Working solutions of biotin (100 µM) were prepared from a stock solution in the same buffer. Fluorescence titration was performed with a Perkin-Elmer LS 50 instrument. Wavelengths for excitation and emission were set to 295 and 350 nm, respectively, with slide widths of 5 nm. A 2 ml volume of a 1 µM Streptavidin solution was pipetted into the cuvette. Then, 2 µl aliquots of biotin solution were added and incubated for 1 minute. Fluorescence measurements were performed after each incubation by using 5 sec integration time settings. The data was fitted by non-linear least-squares regression.
Thereby, the binding affinities of wild-type streptavidin and its variants towards biotin were quantified via fluorescence titration.
Although traptavidin should have a 10-fold lower dissociation constant KD than Streptavidin due to its optimized binding pocket, the results differ. Both, streptavidin and strep-tactin seem to have a lower KDthan traptavidin. Only the results for eMA came up to expectations.
Analysis of secondary structure and thermal stability
For the analysis of protein folding states, circular dichroism spectroscopy was applied, as it allows drawing conclusions about the formation of protein secondary structures.
To determine the ideal wavelengths for measurement, a UV-CD spectrum was recorded in folded and unfolded protein state. Therefore a 10 µM protein solution (according to monomer), solved in buffer A (20 mM KH2PO4, 50 mM K2SO4; pH 7.5), was measured in a 1 mm cuvette. The spectrum was recorded between 190 and 250 nm at 20 °C. By comparing spectra of folded and unfolded state, the wavelength showing maximum variance was selected. Afterwards a denaturation and renaturation spectrum was recorded for each protein by setting 213 nm wavelength and measuring while heating up the solution from 20 °C to 95 °C. As an exception, enhanced monomeric avidin was measured at 203 nm. For blank measurement only buffer was used.
De- and renaturation curves as well as UV-CD-spectra were measured and can be seen in figure 14. All CD spectra were evaluated by the Spectra Manager Software. Results can be seen in figure 14. Furthermore, the temperature melting temperature Tm was calculated, being defined as the temperature where 50% of the protein are denatured. Herefore, the data for each protein was entered into a GraphPad Prism sheet and calculated respectively. Results can be seen in table 1. Streptavidin and streptactin are appear more stable than eMA, but less stable than traptavidin.
References
- ↑ Determined via http://www.expasy.org/
- ↑ Chivers, C. E., Koner, A. L., Lowe, E. D., & Howarth, M. (2011). How the biotin–Streptavidin interaction was made even stronger: investigation via crystallography and a chimaeric tetramer. Biochemical Journal, 435(1), 55-63.
- ↑ Weber, P. C., Ohlendorf, D. H., Wendoloski, J. J., & Salemme, F. R. (1989). Structural origins of high-affinity biotin binding to Streptavidin. Science, 243(4887), 85.
- ↑ Schmidt, T. G., & Skerra, A. (2007). The Strep-tag system for one-step purification and high-affinity detection or capturing of proteins. Nature protocols, 2(6), 1528-1535.
- ↑ Weber, P. C., Ohlendorf, D. H., Wendoloski, J. J., & Salemme, F. R. (1989). Structural origins of high-affinity biotin binding to Streptavidin. Science, 243(4887), 85.
- ↑ Stayton, P. S., Freitag, S., Klumb, L. A., Chilkoti, A., Chu, V., Penzotti, J. E., ... & Stenkamp, R. E. (1999). Streptavidin–biotin binding energetics. Biomolecular engineering, 16(1), 39-44.
- ↑ Chivers, C. E., Crozat, E., Chu, C., Moy, V. T., Sherratt, D. J., & Howarth, M. (2010). A streptavidin variant with slower biotin dissociation and increased mechanostability. Nature methods, 7(5), 391-393.
- ↑ Schmidt, T. G., & Skerra, A. (2007). The Strep-tag system for one-step purification and high-affinity detection or capturing of proteins. Nature protocols, 2(6), 1528-1535.
- ↑ Lee, J. M., Kim, J. A., Yen, T. C., Lee, I. H., Ahn, B., Lee, Y., ... & Jung, Y. (2016). A Rhizavidin Monomer with Nearly Multimeric Avidin‐Like Binding Stability Against Biotin Conjugates. Angewandte Chemie International Edition, 55(10), 3393-3397.
- ↑ Skerra, A., Gebauer, M., Schönfeld, D., Schmelz, E. (2007). Skript zu "Fortgeschrittenenpraktikum Proteinchemie"
- ↑ Schlapschy, M., Binder, U., Börger, C., Theobald, I., Wachinger, K., Kisling, S., ... & Skerra, A. (2013). PASylation: a biological alternative to PEGylation for extending the plasma half-life of pharmaceutically active proteins. Protein Engineering Design and Selection, 26(8), 489-501.
- ↑ Majorek, K. A., Porebski, P. J., Dayal, A., Zimmerman, M. D., Jablonska, K., Stewart, A. J., ... & Minor, W. (2012). Structural and immunologic characterization of bovine, horse, and rabbit serum albumins. Molecular immunology, 52(3), 174-182.
- ↑ Cinelli, R. A., Ferrari, A., Pellegrini, V., Tyagi, M., Giacca, M., & Beltram, F. (2000). The Enhanced Green Fluorescent Protein as a Tool for the Analysis of Protein Dynamics and Localization: Local Fluorescence Study at the Single‐molecule Level. Photochemistry and photobiology, 71(6), 771-776.


