Yeast activation
Description
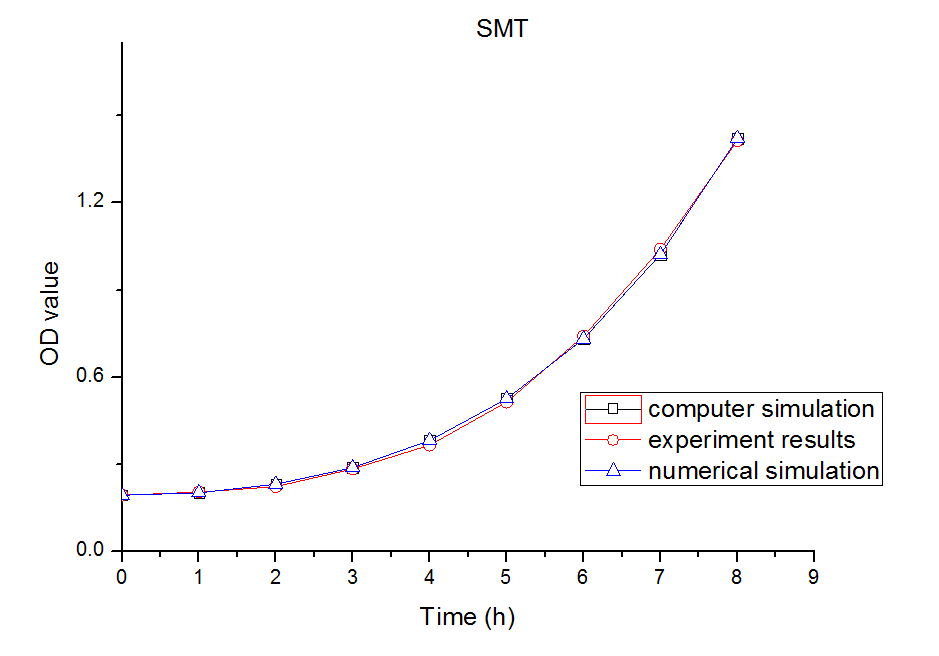
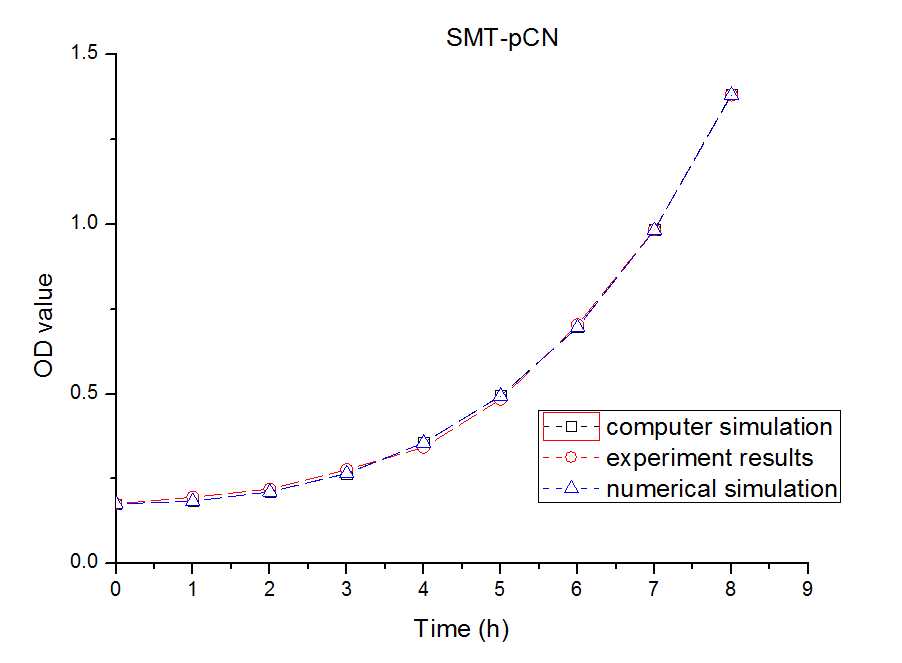
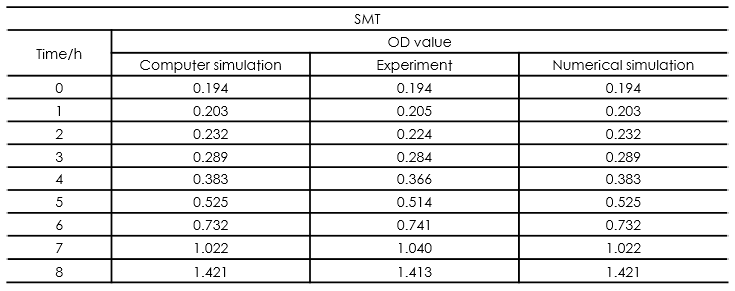
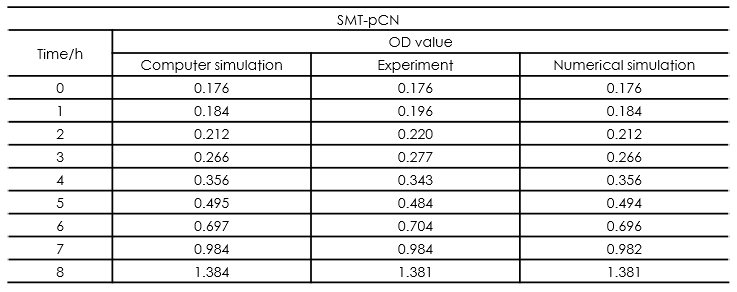
In this part, we established a model for the activation process of dry yeasts by simulating the total number of cells corresponding to time. Since the time period we consider is long enough for activated yeast to proliferate, the proliferation process is considered in this model. After the parameters in the model were adjusted, we found that our simulation results fits experiment results well.
Basic assumption
- all yeasts are inactivated at first.
- only activated yeasts can proliferate.
- yeasts’activation process is so slow that not much yeasts are activated even after hours.
- some yeast are dead initially.
Formula and derivation
The activation process of the cells corresponding to time
We assume the activation process of yeasts is as follows:
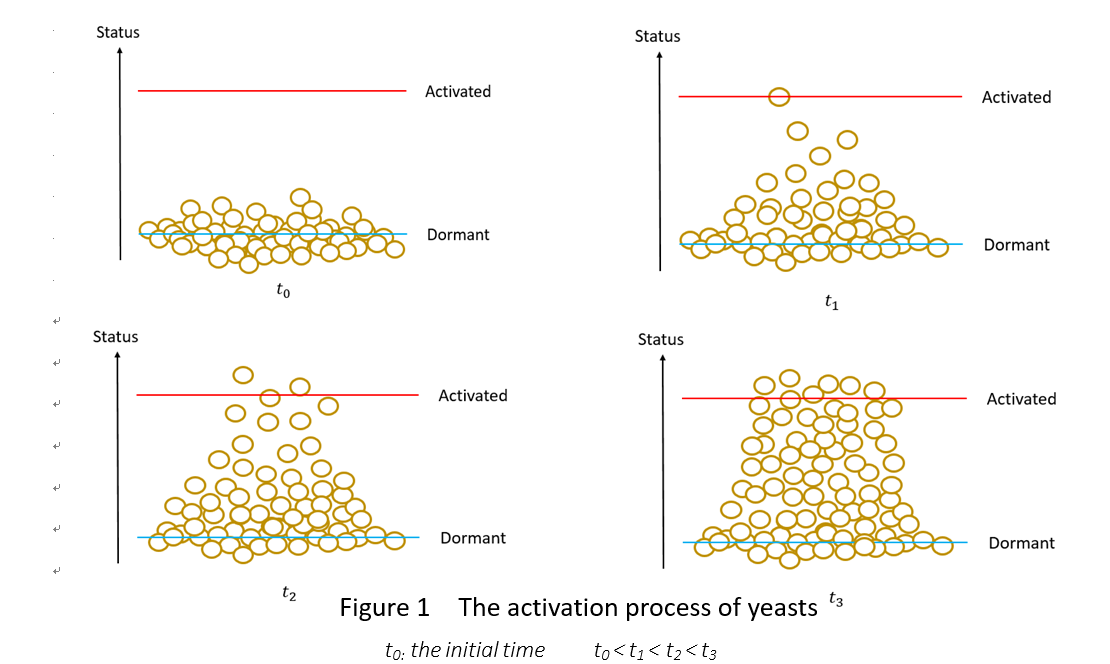
In the beginning, all the cells are in the status of dormant. To t1, a few have been activated and most cells are around the status of dormant. To t2, some cells have been activated and the number of the cells around the activated line is increasing. To t3, many cells are activated and the cells around the activated line are distinctively more than before.
As assumed in assumption 3, the activation process is far from saturation, therefore, combined with the process description before, we can say that the more the cells have been activated at the point, the more the newly-activated cells may occur around this time. And we assume this relationship complies the following equation:
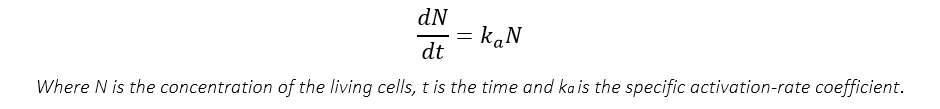
To make the following derivation easier, we divide both side of the equation by N0, the initial number of yeasts.

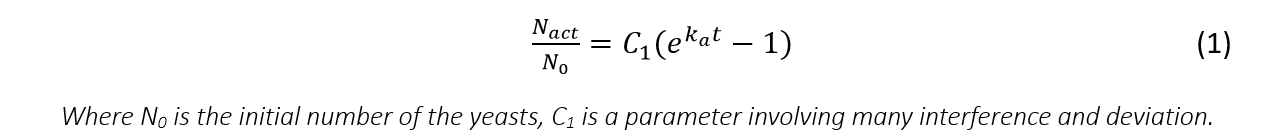
Then, after calculation and considering basic assumption 1, we get the formula of the amount of activated yeasts:
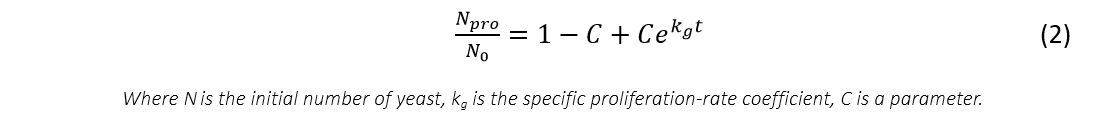
For proliferation part, we simply use exponential function with one parameter as:
The total number of the cells at time t.
The cells at time t can be divided into three groups:
- the proliferation cells originated from the activated cells, noted as Nact,pro
- the inactivated cells, noted as Ninact
- the dead cells, noted as Ndead
For Nact,pro
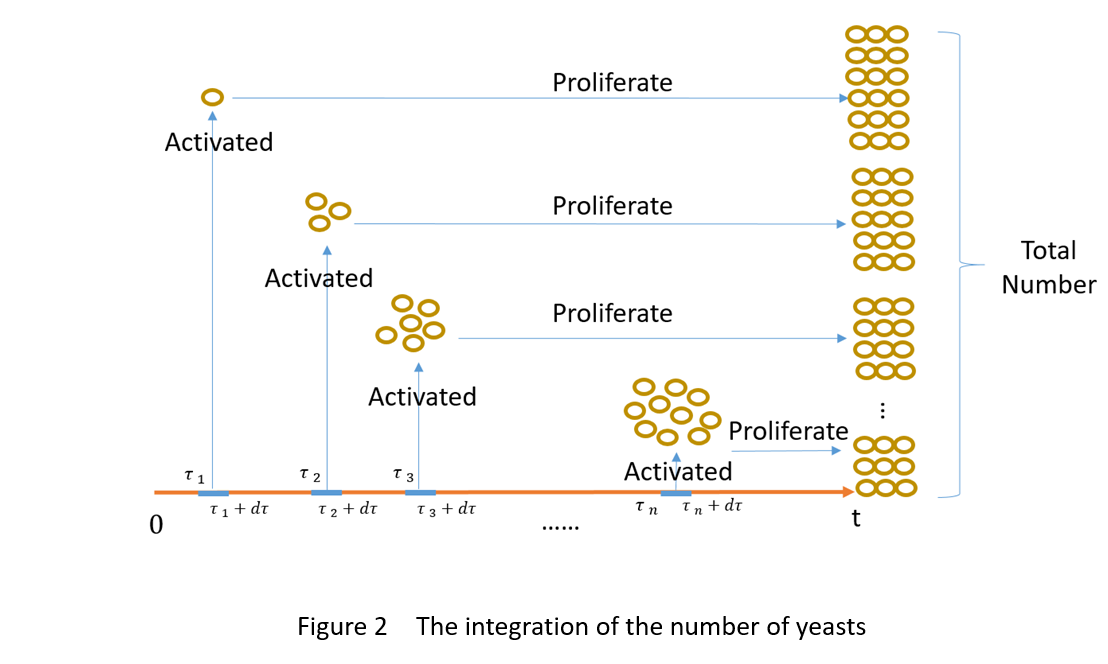
As is shown in figure 2, the total number of the proliferation cells at time t is the sum of the number of the proliferation cells originated from the cells activated in the time period of τn—τn+dτ (n=1,2…+∞).
And the number of the cells activated in the time period τ to τ+dτ can be derived from equation (1):

Then, considering the proliferation part of cell activated in the time period τ to τ+dτ, we can get the total number of the proliferation cells originated from the activated cells and the activated cells themselves by integration as follow:

For Ninact and Ndead
We can get that:

And

With Part1,2,3,we can get the total number of the cells at time t as:

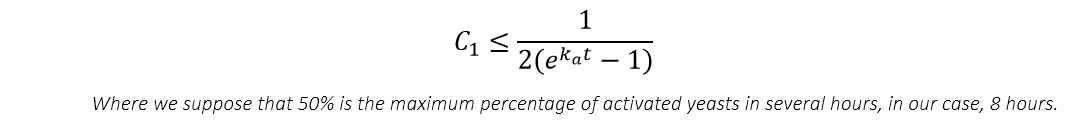
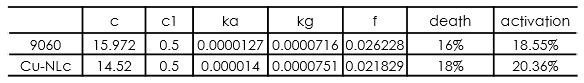
From the equation above can we know that what really contribute to the change of the number of yeasts is the multiplication of C and C1 , not two single parameters. Considering assumption 3, we know that parameter C1 is restricted to a small value, which at least follow the inequation: