Yeast glucose sensor-assisting diabetes diagnosis
Background
Glucose and diabetes
Diabetes, also called Diabetes mellitus (DM), is a group of metabolic diseases in which there are high blood sugar levels over a prolonged period. Symptoms of high blood sugar include frequent urination, increased thirst, and increased hunger. If left untreated, diabetes can cause many complications. Diabetes mellitus is characterized by recurrent or persistent high blood sugar and corresponding clinical symptoms[1]. Although the blood sugar is a well-defined criterion for diabetes diagnosis, it’s sometime a hard decision for every to get their blood samples tested as most of the devices are invasive.
Urine glucose, also known as glycosuria, is usually caused by uncontrolled diabetes. Healthy individuals are able to maintain blood glucose within normal range of 70–115 mg per deciliter. When the glucose level in blood rises to the renal threshold, the kidneys excrete glucose into the urine[2]. So we decided to let our biosensor detect the urine glucose level reveal the health status of the individual. As the urine glucose cannot be a criterion for diabetes diagnosis, our aim is to help individuals monitor their urine sugar so that they will be kept known of their health status, a positive result means that they should go to the hospital for physical examination.
The glucose receptor: Gpr1
In yeast, there is a specific GPCR for glucose sensing named Gpr1. It’s a relatively new kind of GPCR discovered in Saccharomyces cerevisiae, unlike the well-studied pheromone sensing mechanism. Yeast cells prefer glucose as a carbon source because of its rapid fermentation to ethanol, which inhibits the growth of competing micro-organisms. Glucose triggers the switch to a fermentative life-style by transiently activating cAMP synthesis and thereby activating cAMP-dependent protein kinase (PKA), which controls a broad range of targets. Activation of this cascade is dependent on a GPCR system consisting of the putative glucose receptor Gpr1 and the cognate Gα protein Gpa2[3].
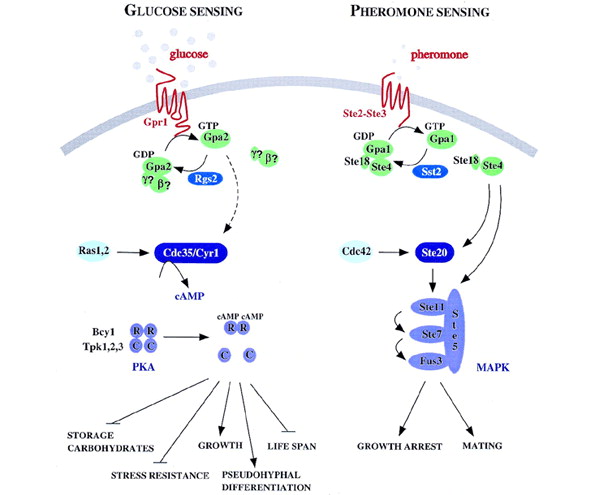
Fig.1 Comparison of glucose sensing pathway and pheromone sensing pathway in yeast
Design and characterization
Design
Since the range of cAMP molecules that reporter protein Nano-lantern cAMP 1.6 (NLc) can detect in Dictyostelium discoideum is around 5 nmol/g, the cAMP surge triggered by 100mM glucose in yeast around 2 nmol/g, further adaptation of protein expression should be made [4, 5]. So we cloned the coding sequence for NLc downstream three yeast endogenous different promters: pADH1, pGAL1 and pCUP1, yielding composite parts K1969007, K1969013 and K1969014. Then we inserted these biobricks into TRP1 locus insertion vector (provided by professor Zhiping XIe’s lab), which has a multiple cloning site flanked by two TRP1 locus homologous sequences, to make genomic insertion into yeast Saccharomyces cerevisiae, strain SMT (genotype: MATα his3Δ leu2Δ lys2Δ ura3Δ; pho8Δ60, pho13Δ, trpΔ). For convenience, we named the transformants as follows: SMT-pAN for pADH1-NLc transformant, SMT-pGN for pGAL1-NLc transformant and SMT-pCN for pCUP1-NLc transformant.
Characterization
As the fusion protein, Nano-lantern (cAMP 1.6), contains a portion of mutated yellow fluorescent protein, we can tell the relative expression level of different promoters under the fluorescent microscope.
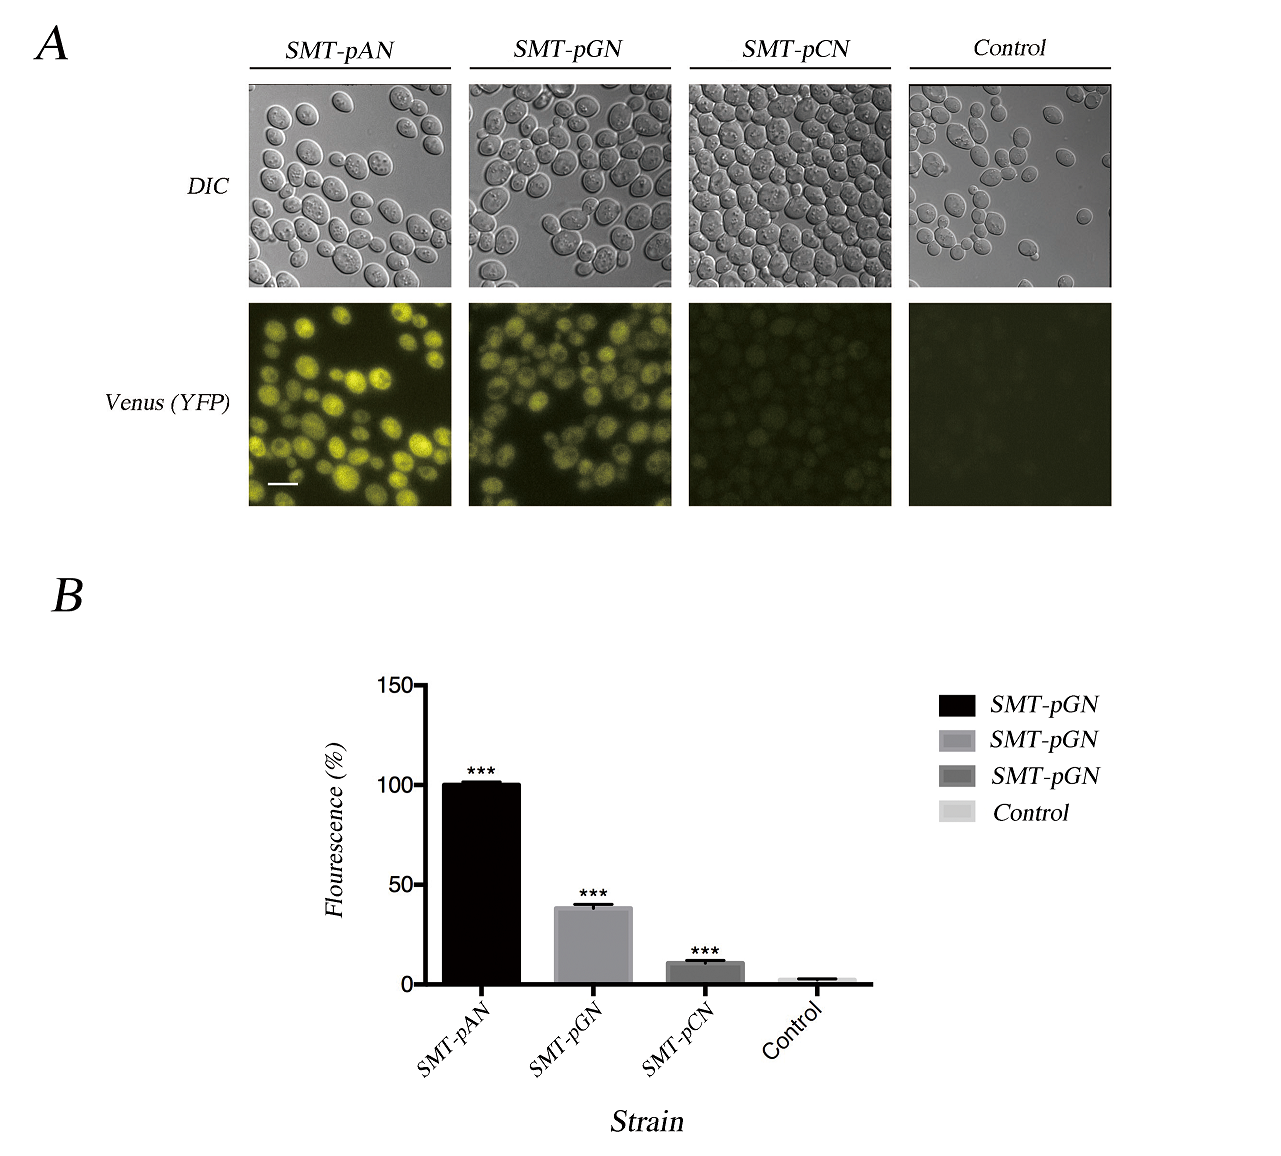
Fig.2 Characterization of expressed Nano-lantern(cAMP 1.6). (A) The fluorescent microscopy results together with the DIC result show the successful expression of NLc in transformants. Scale bar: 10μm; (B) The florescence of transformants was quantified using ImageJ, the value was the average difference between the yeast cell and background under three different fields and normalized with the fluorescence of pADH1-NLc. Data was analyzed using Student-t test, *** indicates p < 0.001.
As the cAMP surge in yeast triggered by GPCR sensing mechanism is incredibly fast and decays within 5 minutes, we monitor the glucose response in first 5 minutes. The results shows that the luminescence in three engineered strains was obviously higher than control group (Fig.3). While only pADH1-NLc transformant showed a good positive correlation between luminescence and the concentration of glucose, and we may need more experiment groups to improve the statistical power as the p values of one-way ANOVA was quite confusing in most of the experimental groups. As the resultsFiF show, strain SMT-pAN has a good relationship between luminescence and glucose concentration at 0-1min (Fig.3).

Fig.3 The luminescence of transformants after glucose stimulation. (A) Dose dependent effects of glucose exposure on cAMP mediated luminescence measured simultaneously in 96-well plate format. Data was shown as average of three parallel groups. The pseudo-color scale indicates intensities of emitted luminescence signals; (B) P values calculated by One-way ANOVA at different time points within three parallel groups, the red line indicated the value of 0.05; (C) The R values calculated by linear regression of the average luminescence at different time points and the the logarithm of the glucose concentration (except 0mM) to base 10. Red line indicated the value of 0.9.
In order to detect the changes in glucose concentration in pathologic urine samples, we added corresponding amount of glucose into urine samples collected from a healthy individual to make mimic pathologic urine samples with glucose concentration of 0, 10, 50 mM. As the P value was the least at 30s in strain SMT-pAN, we compared the glucose response at 30s after adding mimic pathologic urine samples (Fig.4). The results showed postitive correlation between three strains. Although the significance between 10mM treatment groups and the control groups is not promising, we found our device capable of differentiate mimic pathologic urine samples containing 50mM glucose and the healthy urine.
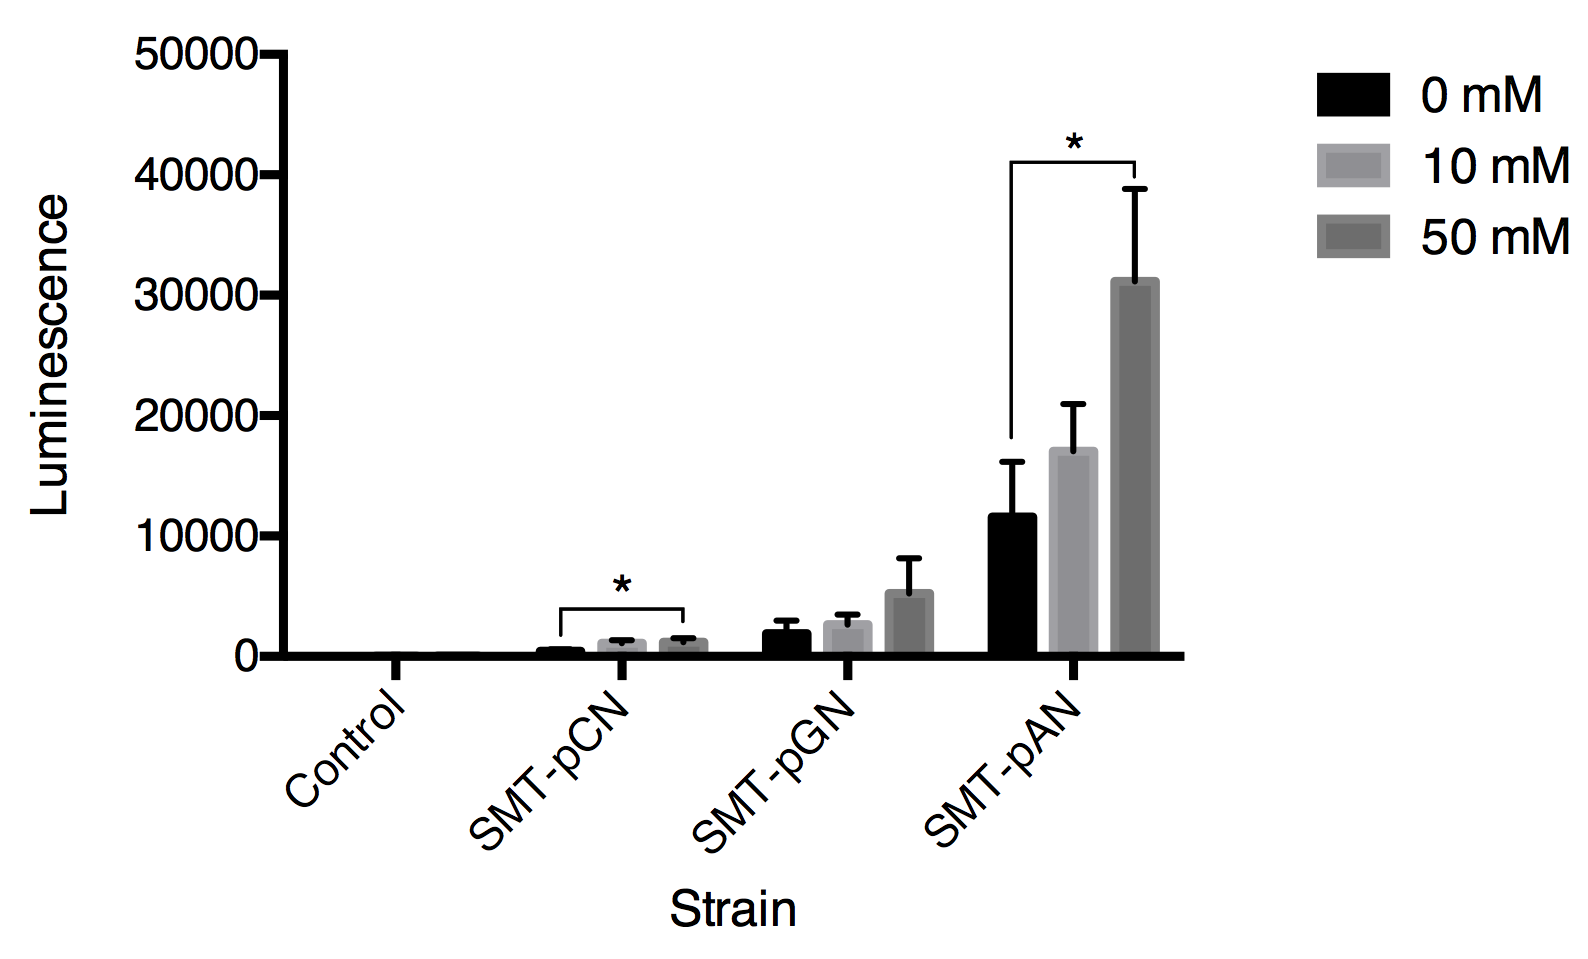
Fig.4 Luminescence triggered by mimic pathologic urine samples with gradient glucose concentration. All data are presented as mean ± SD, n=3. Significance was analyzed using Student-t test.
Summary
In this stage, we have
- 1. Demonstrated the functional expression of cAMP reporter protein, Nano-lantern (cAMP 1.6) in yeast.
- 2. Experimentally validated that our constructed bio-brick parts BBa_K1969007 and BBa_K1969013 works as expected (success in detecting either glucose solution or mimic pathologic urine samples or both).
- 3. Given proof of the capability of engineered yeast cells to work under real-world conditions by using mimic pathologic urine samples.
As our ultimate hope is allowing individuals to analyze their urine biomarkers by photographs taken by cell phones, we picked the brightest strain, SMT-pAN, for further experiments.
Reference
[1] Alberti, K.G.M.M., P.Z. Zimmet, and W. Consultation, Definition, diagnosis and classification of diabetes mellitus and its complications part 1: Diagnosis and classification of diabetes mellitus - Provisional report of a WHO consultation. Diabetic Medicine, 1998. 15(7): p. 539-553.
[2] Walford, S., M.M. Page, and S.P. Allison, The influence of renal threshold on the interpretation of urine tests for glucose in diabetic patients. Diabetes Care, 1980. 3(6): p. 672-4.
[3] Versele, M., K. Lemaire, and J.M. Thevelein, Sex and sugar in yeast: two distinct GPCR systems. Embo Reports, 2001. 2(7): p. 574-579.
[4] Devreotes, P.N., P.L. Derstine, and T.L. Steck, Cyclic 3',5' AMP relay in Dictyostelium discoideum. I. A technique to monitor responses to controlled stimuli. J Cell Biol, 1979. 80(2): p. 291-9.
[5] Rolland, F., et al., Glucose-induced cAMP signalling in yeast requires both a G-protein coupled receptor system for extracellular glucose detection and a separable hexose kinase-dependent sensing process. Molecular Microbiology, 2000. 38(2): p. 348-358.
