Difference between revisions of "Team:HZAU-China/Experiments-Light control"
| (13 intermediate revisions by 3 users not shown) | |||
| Line 3: | Line 3: | ||
<head> | <head> | ||
<meta charset="UTF-8"> | <meta charset="UTF-8"> | ||
| − | <title> | + | <title>light_control</title> |
<style> | <style> | ||
*{margin: 0;padding: 0;} | *{margin: 0;padding: 0;} | ||
| Line 152: | Line 152: | ||
} | } | ||
| − | + | ||
| − | + | ||
| − | + | ||
| − | + | ||
| − | + | ||
| − | + | ||
| − | + | ||
| − | + | ||
</style> | </style> | ||
| Line 196: | Line 189: | ||
<div class="content_part" id="masterdiv"> | <div class="content_part" id="masterdiv"> | ||
| − | |||
| − | |||
| − | |||
| − | |||
| − | |||
| − | |||
| − | |||
| − | |||
| − | + | <a href="#A1">1.Introduction</a> | |
| − | + | <div class="menutitle" onclick="SwitchMenu('sub1')"> | |
| + | </div> | ||
| + | |||
| + | <a href="#A2">2.Materials and Methods</a> | ||
| + | <div class="menutitle" onclick="SwitchMenu('sub2')"> | ||
| + | <div class="little"></div> | ||
| + | </div> | ||
| + | <ul class="my_submenu" id="sub2" style="display: block"> | ||
| + | <li><a href="#A21">2.1 Material</a></li> | ||
| + | <li><a href="#A22">2.2 Method</a></li> | ||
| + | </ul> | ||
| + | |||
| + | |||
| + | <a href="#A3">3.Result</a> | ||
| + | <div class="menutitle" onclick="SwitchMenu('sub3')"> | ||
<div class="little"></div> | <div class="little"></div> | ||
</div> | </div> | ||
| − | <ul class="my_submenu" id=" | + | <ul class="my_submenu" id="sub3" style="display: block"> |
| − | <li><a href="# | + | <li><a href="#A31">3.1 PCB optimization in CcaS-CcaR system</a></li> |
| − | <li><a href="# | + | <li><a href="#A32">3.2 Optimization on Chassis Strain</a></li> |
| − | <li><a href="# | + | <li><a href="#A33">3.3 Optimization on PcpcG2</a></li> |
| − | + | ||
</ul> | </ul> | ||
| − | + | <a href="#A4">Reference</a> | |
| − | + | <div class="menutitle" onclick="SwitchMenu('sub4')"> | |
</div> | </div> | ||
| + | |||
| + | </div> | ||
| + | </div> | ||
<div class="main_part"> | <div class="main_part"> | ||
| − | <img src="https://static.igem.org/mediawiki/2016/ | + | <img src="https://static.igem.org/mediawiki/2016/a/a2/T--HZAU-China--wetlab8000.png" width="168px"> |
<div class="article"> | <div class="article"> | ||
| − | <h2> | + | <h2>Experiments-chassis integration</h2> |
<div class="random"><a id="A1" ></a></div> | <div class="random"><a id="A1" ></a></div> | ||
| − | <h3>1. | + | <h3>1.Introduction</h3><br/> |
| − | <p> | + | <p>To better integrate the three devices, light-switchable TCS, riboswitch device, and motility device, co-expression in a demanding E.coli strain is inevitable. However, it is a tough decision on which strain to choose as the chassis of our project. At first we have two options, one is to choose CL1, a strain lacks motility-related gene cheZ but has envZ which is functionally equivalent to CcaS. The other is to choose JT2, optogenetically optimized but possesses cheZ. Therefore, to better achieve our goal on making the whole project work, we are determined to enforce gene knockout with λ Red recombination system, either to knockout envZ in CL1, or to knockout cheZ in JT2. However, swarming assay shows that been JT2 has been traumatized in previous research and show no motility (swarming ability even lower than CL1, data not shown). Consequently, deletion of envZ in CL1 strain is the optimized design.</p> |
| − | + | <p></p> | |
| − | + | ||
| − | </p> | + | <div class="random"><a id="A2" ></a></div> |
| + | <h3>2.Material and Method</h3> | ||
| − | <div class="random"><a id=" | + | <div class="random"><a id="A21" ></a></div> |
| − | <h4> | + | <h4>2.1 Material</h4> |
| − | + | <p>1.Kits: TIANprep Mini Plasmid Kit (TIANGEN), QIAquick Gel Extraction Kit (QIAGEN), E.Z.N.A Plasmid DNA Mini Kit (OMEGA), AxyPrepTM PCR Cleanup Kit (AXYGEN)</p> | |
| − | <p | + | <p>2.Enzymes: Four standard restriction enzymes:EcoRI, XbaI, SpeI, PstI (TAKARA). For ligation: T4 ligase, SolutionI (TAKARA)</p> |
| − | <p> | + | <p>3.For PCR use: TaqMix, Prime Start, Prime Start MAX (TAKARA)</p> |
| − | <p> | + | <p>4.For Recombination: ExnaseII-ClonExpress II One Step Cloning Kit(Vazyme biotech)</p> |
| − | <p> | + | <p>5. Bacteria: JT2 (RU1012ΔPompC-lacZ. Purchased from Addgene Inc.), CL1 (shared by Dr. Chenli Liu, SIAT CSynBER)</p><br/><br/> |
| − | <p> | + | |
| − | < | + | <p >Table1. Strains used in this work</p> |
| − | < | + | <img src="https://static.igem.org/mediawiki/2016/9/98/T--HZAU-China--experimentlighttable1.png" width="700px"><br/> |
| − | + | ||
| − | < | + | <p>6. Plasmid: (Figure 1)</p> |
| − | + | <img src="https://static.igem.org/mediawiki/2016/c/cd/T--HZAU-China--experimentlightfigure2.png" width="700px"> | |
| − | <img src=" | + | <p style="text-align:center">Figure 1. Plasmid we constructed. a. psR43_6. b. PCB(△CcaS). c. PCB∆-Ribo-CheZ. d. PCB∆-Ribo-sfGFP. e. pJT119b∆. f. Opto∆-PleD. g. Opto∆-CheZ</p><br/> |
| − | + | <br/><br/> | |
| − | <p>a. | + | |
| − | + | ||
| − | < | + | |
| − | + | <p >Table2. Plasmids used in this study. </p> | |
| − | < | + | <img src="https://static.igem.org/mediawiki/2016/e/e0/T--HZAU-China--experimentlighttable2.png" width="700px"><br/><br/> |
| − | + | ||
| − | < | + | |
| − | + | ||
| − | + | ||
| − | + | ||
| − | + | ||
| − | + | ||
| − | + | ||
| − | + | ||
| − | + | ||
| − | + | ||
<div class="random"><a id="A22" ></a></div> | <div class="random"><a id="A22" ></a></div> | ||
| − | <h4>2.2 | + | <h4>2.2 Method</h4> |
| − | < | + | <h5>2.2.1 Plasmid Construction and Integration</h5> |
| − | + | <p>DNA construction was carried out in E. coli strain Trans5a ( Transgene.Inc ) following standard procedures. The plasmids and primers used in this study are listed in Supporting Information Tables S1 and S2, respectively. For plasmid construction, DNA fragments were amplified using the primers listed below. PCR products were individually gel-purified from 1% agarose and the concentration determined with a NanoDrop 2000 (Thermo Fisher Scientific, Waltham, MA, U.S.A.). ClonExpress II One Step Cloning Kit was used to construct the most plasmids. All plasmid constructs were confirmed by sequencing at Sangon, Inc. (Wuhan,China).</p> | |
| − | <p | + | <p>After getting the right plasmids, by electroporation, we co-transformed the plasmids into our chassis bacteria, JT2, CL1, and our EnvZ knockout CL1 strain to do functional detection.</p> |
| − | + | <br/><br/> | |
| − | + | ||
| − | <p> | + | |
| − | <br/> | + | |
| − | <p> | + | <p>Table3. Plasmid assembly detailed descriptions.</p> |
| − | + | <img src="https://static.igem.org/mediawiki/2016/7/7f/T--HZAU-China--experimentlighttable3.png" width="700px"><br/><br/> | |
| + | <h5>2.2.2 Light Exposure Measurements</h5> | ||
| + | <p>Simple DIY device for preliminary measurement:</p> | ||
| + | <p>Green LED (λmax = 520 nm,indensity=600 lux ); Red LED (λmax = 650 nm, indensity=1000 lux )</p> | ||
| + | <img src="https://static.igem.org/mediawiki/2016/8/83/T--HZAU-China--experimentlightdevice1.png" width="700px"><br/><br/> | ||
| + | <p>light exposure and harvesting protocol:</p> | ||
| + | <p>1. Inoculated from a -80°C stock into a tube containing 3ml LB medium and the appropriate antibiotics (50 µg/mL kanamycin, 100 µg/mL spectinomycin and 25 µg/mL chloramphenicol for the CcaS-CcaR system, and cultured at 37 centigrade and 180 rpm overnight. Three repeats for each strain.</p> | ||
| + | <p>2. Cultures were then diluted 5000-folds into 5 mL fresh LB Miller Broth (OD600 0.0005), and the OD600 were determined using a Cary50 UV/vis spectrophotometer. Bacteria were cultured at 37 centigrade and 180 rpm for 13 hours.</p> | ||
| + | <p>3. Cells were then further 1:10 diluted into 2 mL M9 minimal medium in culture tubes containing the appropriate antibiotics. Using SK724 5ml centrifuge tube (Sukang Medical Supplies).</p> | ||
| + | <p>4. Shake the centrifuge tubes under different illumination condition in the measurement device V1.0 at 37 centigrade and 180 rpm.</p> | ||
| + | <p>5. After 8 h of growth, harvest all test tubes by immediately transferring them into an ice bath. Wait 10 min for the cultures to equilibrate to the cold temperature and for gene expression to stop. </p> | ||
| + | <p>* Approximately 1h before stopping the experimental cultures, begin preparing a solution of phosphate-buffered saline (PBS; 137 mM NaCl, 2.7 mM KCl, 10 mM Na2HPO4, 2 mM KH2PO4, pH to 7.4) + 500 µg/mL of the transcription inhibitor rifampicin (Rif, BIOSHARP, Sigma. #R3501). Filter the dissolved solution of PBS + Rif through a 0.22-µm 20-mL syringe filter for sterilization.</p> | ||
| + | <p>6. Transfer 50uL of the filtered PBS + Rif and 50ul bacteria into 96-well plate per culture sample. Three repeats derived from each tube.</p> | ||
| + | <p>7. Incubate the plate in a 37°C water bath for 0.5 h for maturation of sfGFP.</p> | ||
| + | <p>8. Transfer plate back into ice-water bath for 15 min. (4)</p> | ||
| + | <p>9. Use the Synergy Multiscan Spectrum (Synergy<sup>TM</sup> H1) microplate reader for fluorescence assay.</p><br/><br/> | ||
| − | + | <p>Table4. the protocol of Multi-Mode Reader</p> | |
| − | + | <img src="https://static.igem.org/mediawiki/2016/f/f3/T--HZAU-China--experimentlighttable4.png" width="700px"><br/><br/><br/> | |
| − | <p> | + | |
| − | + | ||
| − | <img src=" | + | |
| − | + | ||
| − | + | ||
| − | + | ||
| − | + | ||
| − | + | ||
| − | <p> | + | <h5>2.2.3 LPA Apparatus For Further Measurement</h5> |
| − | + | <img src="https://static.igem.org/mediawiki/2016/9/99/T--HZAU-China--experimentlightdevice2.png" width="700px"><br/> | |
| + | <p>To make frozen starter aliquots, a 3 mL LB + 50 µg/mL kanamycin, 100 µg/mL spectinomycin and 34 µg/mL chloramphenicol culture was inoculated from a -80°C stock and grown (37°C, 250 rpm) to OD600 < 0.3. 30% glycerol was added, absorbance measured, and 50μL aliquots made and stored at -80°C. For experiments, M9 + antibiotics was inoculated with a starter aliquot, to OD600 = 0.00015. 500 μL starter culture was added to each well of the 24-well plate and the plate was sealed with adhesive foil. The plate was placed into the LPA and the assembly mounted on a shaker/incubator at 37°C, 200 rpm for 8 h. The plate was then removed and chilled in an ice-water bath. Cells were chilled for ≥ 15 min and the foil removed. 200 μL from each well was transferred to 96-well plate containing 66ul rifampicin containing PBS(500ng/mL).(5)</p> | ||
| − | |||
| − | |||
| − | |||
| − | |||
| − | |||
| − | |||
| − | |||
| − | |||
| − | |||
| − | |||
| − | |||
| − | <img src=" | + | <div class="random"><a id="A3" ></a></div> |
| − | <p style="text-align:center"> | + | <h3>3. Result</h3> |
| − | <p> | + | |
| + | <div class="random"><a id="A31" ></a></div> | ||
| + | <h4>3.1 PCB Optimization in CcaS-CcaR System</h4> | ||
| + | <p>As previously described, we removed the redundant ccaS in pSR43.6. Quantitative measurement on sfGFP fluorescence was operated in the purpose of certifying the feasibility of the removal, a premise for constructing plasmid PCB-J23117-BC345-cheZ and PCB-J23117-BC345-cheZ in our ultimate genetic circuit. Under green-light illumination, JT2 with PCB (△ccaS) and CcaS-CcaR encoding plasmid pJTb119 occured to be green which can be recognized by naked eye after centrifugation (Figure 2.a). This qualitatively demonstrates that the light-switchable system is available without the redundant ccaS in pSR43.6. Moreover, quantitative measurement result on sfGFP fluorescence depicts that in E.coli strain JT2 CcaS-CcaR system produces 266.0 ± 19.3 and 509.0 ± 55.4 au of sfGFP in red and green light, corresponding to 1.91 ± 0.34-fold activation, illustrating that PcpcG2 is functionally regulated by light, green-activated and red-repressed (Figure 2.b). And bacteria without redundant ccaS shows significantly higher dynamic, indicating that the optimization is effective. We suspect that the exceeding expression level of CcaS has great impact on the metabolic pathway of bacteria.</p> | ||
| + | <img src="https://static.igem.org/mediawiki/2016/d/d1/T--HZAU-China--experimentlightfigure3.png" width="700px"> | ||
| + | <p style="text-align:center">Figure 2.Measurement on sfGFP fluorescence in PCB optimization.</p> | ||
| + | <p> a. Green-light activated JT2 with PCB (△ccaS) and pJTb119 centrifugation. b. Fluorescence assay of primitive PCB and PCB (△CcaS) in JT2.</p><br/> | ||
| + | |||
| + | <div class="random"><a id="A32" ></a></div> | ||
| + | <h4>3.2 Optimization on Chassis Strain</h4> | ||
| + | <p>To better integrate the three devices, light-switchable TCS, riboswitch device, and motility device, it is inevitable to achieve co-expression in CL1 E.coli strain, cheZ deleted mutant strain. Optimization on chassis strain has been accomplished as we created SBSP strain (CL1 △EnvZ)(see “<a href="https://2016.igem.org/Team:HZAU-China/Experiments-chassis_integration">chassis integration</a>”). Quantitative fluorescence measurement on CcaS-CcaR system in different strains JT2, CL1 and SBSP allude that the differences in fluorescence value under green and red light are approximately the same in three strains, although JT2 has higher expression efficiency (Figure 3). So it is plausible to transform the CcaS-CcaR system into CL1 (△EnvZ) for experiment on motility. </p> | ||
<br/> | <br/> | ||
| − | <p> | + | <img src="https://static.igem.org/mediawiki/2016/2/26/T--HZAU-China--experimentlightfigure4.png" width="700px"> |
| − | <p> | + | <p style="text-align:center">Figure 3. Fluorescence assay in different chassis strain B,C,D. All three strains have co-expression of both two plasmids, PCB (△ccaS) and pJTb119.</p> |
| + | |||
| + | <div class="random"><a id="A33" ></a></div> | ||
| + | <h4>3.3 Optimization on PcpcG2</h4> | ||
| + | <p>Although CcaS-CcaR light-switchable system has shown excellent difference responding to green and red light, leakiness still exist and will be a huge problem when this device is applied for motility control. Therefore, optimization on green-light activated promoter PcpcG2 was executed. In bacteria strain D and E, containing PcpcG2 before and after truncation respectively, E seems to be less green than D when cultured in dark condition (Figure 4a). This is an indication of reduction in leakiness when constitutive promoter is eliminated. Fluorescence assays also infer that leaked expression in darkness significantly reduced after truncation of the constitutive promoter. (Figure 4b) By the way, the difference of fluorescence under green and red light is narrowed unexpectedly. We suspect it is due to the limited precision in cultural environment that the simple constructed detecting device v1.0 provides. For example, wavelength, light intensity, and uniformity in each centrifugal tube. These factors could be the reason to measurement mistakes.</p> | ||
| + | |||
| + | <img src="https://static.igem.org/mediawiki/2016/d/d7/T--HZAU-China--experimentlightfigure5.png" width="700px"> | ||
| + | <p style="text-align:center">Figure 4. Measurement on fluorescence in PcpcG2 optimization. </p> | ||
| + | <p> a. Bacteria cultured in darkness. Strain D and E are both CL1 (△EnvZ) strains, contain the same plasmid PCB (△ccaS), but contain different PcpcG2, PcpcG2-238 and PcpcG2-172.</p> | ||
| + | <p>b. Fluorescence assay of CcaS-CcaR system with PcpcG2-238 and PcpcG2-172 in CL1 (△EnvZ), and PCB (△CcaS) as chromophore.</p><br/><br/> | ||
| + | |||
| + | |||
| + | <div class="random"><a id="A4" ></a></div> | ||
| + | <h3>Reference</h3> | ||
| + | <p>1. J. J. Tabor, A. Levskaya, C. A. Voigt, Multichromatic control of gene expression in Escherichia coli. Journal of molecular biology 405, 315-324 (2011); published online EpubJan 14 (10.1016/j.jmb.2010.10.038).</p> | ||
| + | <p>2. Y. Hirose, T. Shimada, R. Narikawa, M. Katayama, M. Ikeuchi, Cyanobacteriochrome CcaS is the green light receptor that induces the expression of phycobilisome linker protein. Proceedings of the National Academy of Sciences of the United States of America 105, 9528-9533 (2008); published online EpubJul 15 (10.1073/pnas.0801826105).</p> | ||
| + | <p>3. S. R. Schmidl, R. U. Sheth, A. Wu, J. J. Tabor, Refactoring and optimization of light-switchable Escherichia coli two-component systems. ACS synthetic biology 3, 820-831 (2014); published online EpubNov 21 (10.1021/sb500273n).</p> | ||
| + | <p>4. Olson, E. J., Hartsough, L. A., Landry, B. P., Shroff, R., and Tabor, J. J. (2014) Characterizing bacterial gene circuit dynamics with optically programmed gene expression signals. Nat. Methods 11, 449‒455. </p> | ||
| + | <p>5. K.P. Gerhardt, E.J. Olson, S.M. Castillo-Hair, L.A. Hartsough, B.P. Landry, F. Ekness, R. Yokoo, E.J. Gomez, P. Ramakrishnan, J. Suh, D.F. Savage, J.J. Tabor* (2016) An open-hardware platform for optogenetics and photobiology. Sci. Rep.</p> | ||
| + | |||
| − | |||
</div> | </div> | ||
| − | |||
| − | |||
</div> | </div> | ||
| − | |||
Latest revision as of 08:51, 5 December 2016

Experiments-chassis integration
1.Introduction
To better integrate the three devices, light-switchable TCS, riboswitch device, and motility device, co-expression in a demanding E.coli strain is inevitable. However, it is a tough decision on which strain to choose as the chassis of our project. At first we have two options, one is to choose CL1, a strain lacks motility-related gene cheZ but has envZ which is functionally equivalent to CcaS. The other is to choose JT2, optogenetically optimized but possesses cheZ. Therefore, to better achieve our goal on making the whole project work, we are determined to enforce gene knockout with λ Red recombination system, either to knockout envZ in CL1, or to knockout cheZ in JT2. However, swarming assay shows that been JT2 has been traumatized in previous research and show no motility (swarming ability even lower than CL1, data not shown). Consequently, deletion of envZ in CL1 strain is the optimized design.
2.Material and Method
2.1 Material
1.Kits: TIANprep Mini Plasmid Kit (TIANGEN), QIAquick Gel Extraction Kit (QIAGEN), E.Z.N.A Plasmid DNA Mini Kit (OMEGA), AxyPrepTM PCR Cleanup Kit (AXYGEN)
2.Enzymes: Four standard restriction enzymes:EcoRI, XbaI, SpeI, PstI (TAKARA). For ligation: T4 ligase, SolutionI (TAKARA)
3.For PCR use: TaqMix, Prime Start, Prime Start MAX (TAKARA)
4.For Recombination: ExnaseII-ClonExpress II One Step Cloning Kit(Vazyme biotech)
5. Bacteria: JT2 (RU1012ΔPompC-lacZ. Purchased from Addgene Inc.), CL1 (shared by Dr. Chenli Liu, SIAT CSynBER)
Table1. Strains used in this work

6. Plasmid: (Figure 1)

Figure 1. Plasmid we constructed. a. psR43_6. b. PCB(△CcaS). c. PCB∆-Ribo-CheZ. d. PCB∆-Ribo-sfGFP. e. pJT119b∆. f. Opto∆-PleD. g. Opto∆-CheZ
Table2. Plasmids used in this study.

2.2 Method
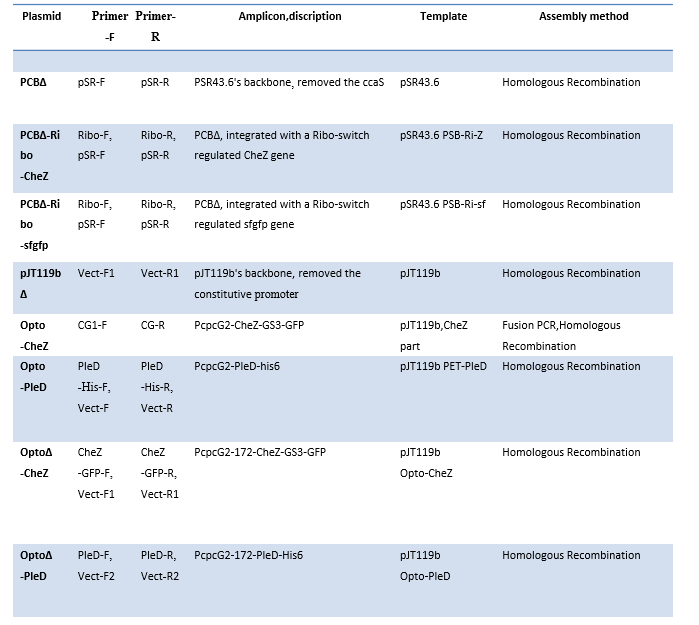
2.2.1 Plasmid Construction and Integration
DNA construction was carried out in E. coli strain Trans5a ( Transgene.Inc ) following standard procedures. The plasmids and primers used in this study are listed in Supporting Information Tables S1 and S2, respectively. For plasmid construction, DNA fragments were amplified using the primers listed below. PCR products were individually gel-purified from 1% agarose and the concentration determined with a NanoDrop 2000 (Thermo Fisher Scientific, Waltham, MA, U.S.A.). ClonExpress II One Step Cloning Kit was used to construct the most plasmids. All plasmid constructs were confirmed by sequencing at Sangon, Inc. (Wuhan,China).
After getting the right plasmids, by electroporation, we co-transformed the plasmids into our chassis bacteria, JT2, CL1, and our EnvZ knockout CL1 strain to do functional detection.
Table3. Plasmid assembly detailed descriptions.
2.2.2 Light Exposure Measurements
Simple DIY device for preliminary measurement:
Green LED (λmax = 520 nm,indensity=600 lux ); Red LED (λmax = 650 nm, indensity=1000 lux )

light exposure and harvesting protocol:
1. Inoculated from a -80°C stock into a tube containing 3ml LB medium and the appropriate antibiotics (50 µg/mL kanamycin, 100 µg/mL spectinomycin and 25 µg/mL chloramphenicol for the CcaS-CcaR system, and cultured at 37 centigrade and 180 rpm overnight. Three repeats for each strain.
2. Cultures were then diluted 5000-folds into 5 mL fresh LB Miller Broth (OD600 0.0005), and the OD600 were determined using a Cary50 UV/vis spectrophotometer. Bacteria were cultured at 37 centigrade and 180 rpm for 13 hours.
3. Cells were then further 1:10 diluted into 2 mL M9 minimal medium in culture tubes containing the appropriate antibiotics. Using SK724 5ml centrifuge tube (Sukang Medical Supplies).
4. Shake the centrifuge tubes under different illumination condition in the measurement device V1.0 at 37 centigrade and 180 rpm.
5. After 8 h of growth, harvest all test tubes by immediately transferring them into an ice bath. Wait 10 min for the cultures to equilibrate to the cold temperature and for gene expression to stop.
* Approximately 1h before stopping the experimental cultures, begin preparing a solution of phosphate-buffered saline (PBS; 137 mM NaCl, 2.7 mM KCl, 10 mM Na2HPO4, 2 mM KH2PO4, pH to 7.4) + 500 µg/mL of the transcription inhibitor rifampicin (Rif, BIOSHARP, Sigma. #R3501). Filter the dissolved solution of PBS + Rif through a 0.22-µm 20-mL syringe filter for sterilization.
6. Transfer 50uL of the filtered PBS + Rif and 50ul bacteria into 96-well plate per culture sample. Three repeats derived from each tube.
7. Incubate the plate in a 37°C water bath for 0.5 h for maturation of sfGFP.
8. Transfer plate back into ice-water bath for 15 min. (4)
9. Use the Synergy Multiscan Spectrum (SynergyTM H1) microplate reader for fluorescence assay.
Table4. the protocol of Multi-Mode Reader

2.2.3 LPA Apparatus For Further Measurement

To make frozen starter aliquots, a 3 mL LB + 50 µg/mL kanamycin, 100 µg/mL spectinomycin and 34 µg/mL chloramphenicol culture was inoculated from a -80°C stock and grown (37°C, 250 rpm) to OD600 < 0.3. 30% glycerol was added, absorbance measured, and 50μL aliquots made and stored at -80°C. For experiments, M9 + antibiotics was inoculated with a starter aliquot, to OD600 = 0.00015. 500 μL starter culture was added to each well of the 24-well plate and the plate was sealed with adhesive foil. The plate was placed into the LPA and the assembly mounted on a shaker/incubator at 37°C, 200 rpm for 8 h. The plate was then removed and chilled in an ice-water bath. Cells were chilled for ≥ 15 min and the foil removed. 200 μL from each well was transferred to 96-well plate containing 66ul rifampicin containing PBS(500ng/mL).(5)
3. Result
3.1 PCB Optimization in CcaS-CcaR System
As previously described, we removed the redundant ccaS in pSR43.6. Quantitative measurement on sfGFP fluorescence was operated in the purpose of certifying the feasibility of the removal, a premise for constructing plasmid PCB-J23117-BC345-cheZ and PCB-J23117-BC345-cheZ in our ultimate genetic circuit. Under green-light illumination, JT2 with PCB (△ccaS) and CcaS-CcaR encoding plasmid pJTb119 occured to be green which can be recognized by naked eye after centrifugation (Figure 2.a). This qualitatively demonstrates that the light-switchable system is available without the redundant ccaS in pSR43.6. Moreover, quantitative measurement result on sfGFP fluorescence depicts that in E.coli strain JT2 CcaS-CcaR system produces 266.0 ± 19.3 and 509.0 ± 55.4 au of sfGFP in red and green light, corresponding to 1.91 ± 0.34-fold activation, illustrating that PcpcG2 is functionally regulated by light, green-activated and red-repressed (Figure 2.b). And bacteria without redundant ccaS shows significantly higher dynamic, indicating that the optimization is effective. We suspect that the exceeding expression level of CcaS has great impact on the metabolic pathway of bacteria.

Figure 2.Measurement on sfGFP fluorescence in PCB optimization.
a. Green-light activated JT2 with PCB (△ccaS) and pJTb119 centrifugation. b. Fluorescence assay of primitive PCB and PCB (△CcaS) in JT2.
3.2 Optimization on Chassis Strain
To better integrate the three devices, light-switchable TCS, riboswitch device, and motility device, it is inevitable to achieve co-expression in CL1 E.coli strain, cheZ deleted mutant strain. Optimization on chassis strain has been accomplished as we created SBSP strain (CL1 △EnvZ)(see “chassis integration”). Quantitative fluorescence measurement on CcaS-CcaR system in different strains JT2, CL1 and SBSP allude that the differences in fluorescence value under green and red light are approximately the same in three strains, although JT2 has higher expression efficiency (Figure 3). So it is plausible to transform the CcaS-CcaR system into CL1 (△EnvZ) for experiment on motility.

Figure 3. Fluorescence assay in different chassis strain B,C,D. All three strains have co-expression of both two plasmids, PCB (△ccaS) and pJTb119.
3.3 Optimization on PcpcG2
Although CcaS-CcaR light-switchable system has shown excellent difference responding to green and red light, leakiness still exist and will be a huge problem when this device is applied for motility control. Therefore, optimization on green-light activated promoter PcpcG2 was executed. In bacteria strain D and E, containing PcpcG2 before and after truncation respectively, E seems to be less green than D when cultured in dark condition (Figure 4a). This is an indication of reduction in leakiness when constitutive promoter is eliminated. Fluorescence assays also infer that leaked expression in darkness significantly reduced after truncation of the constitutive promoter. (Figure 4b) By the way, the difference of fluorescence under green and red light is narrowed unexpectedly. We suspect it is due to the limited precision in cultural environment that the simple constructed detecting device v1.0 provides. For example, wavelength, light intensity, and uniformity in each centrifugal tube. These factors could be the reason to measurement mistakes.

Figure 4. Measurement on fluorescence in PcpcG2 optimization.
a. Bacteria cultured in darkness. Strain D and E are both CL1 (△EnvZ) strains, contain the same plasmid PCB (△ccaS), but contain different PcpcG2, PcpcG2-238 and PcpcG2-172.
b. Fluorescence assay of CcaS-CcaR system with PcpcG2-238 and PcpcG2-172 in CL1 (△EnvZ), and PCB (△CcaS) as chromophore.
Reference
1. J. J. Tabor, A. Levskaya, C. A. Voigt, Multichromatic control of gene expression in Escherichia coli. Journal of molecular biology 405, 315-324 (2011); published online EpubJan 14 (10.1016/j.jmb.2010.10.038).
2. Y. Hirose, T. Shimada, R. Narikawa, M. Katayama, M. Ikeuchi, Cyanobacteriochrome CcaS is the green light receptor that induces the expression of phycobilisome linker protein. Proceedings of the National Academy of Sciences of the United States of America 105, 9528-9533 (2008); published online EpubJul 15 (10.1073/pnas.0801826105).
3. S. R. Schmidl, R. U. Sheth, A. Wu, J. J. Tabor, Refactoring and optimization of light-switchable Escherichia coli two-component systems. ACS synthetic biology 3, 820-831 (2014); published online EpubNov 21 (10.1021/sb500273n).
4. Olson, E. J., Hartsough, L. A., Landry, B. P., Shroff, R., and Tabor, J. J. (2014) Characterizing bacterial gene circuit dynamics with optically programmed gene expression signals. Nat. Methods 11, 449‒455.
5. K.P. Gerhardt, E.J. Olson, S.M. Castillo-Hair, L.A. Hartsough, B.P. Landry, F. Ekness, R. Yokoo, E.J. Gomez, P. Ramakrishnan, J. Suh, D.F. Savage, J.J. Tabor* (2016) An open-hardware platform for optogenetics and photobiology. Sci. Rep.